Validation of Urinary Luteinizing Hormone Tests: Analytical Performance, Clinical Applications, and Future Directions
This comprehensive review synthesizes current evidence on the validation of urinary luteinizing hormone (LH) tests against serum hormone measures, addressing key considerations for researchers and drug development professionals.
Validation of Urinary Luteinizing Hormone Tests: Analytical Performance, Clinical Applications, and Future Directions
Abstract
This comprehensive review synthesizes current evidence on the validation of urinary luteinizing hormone (LH) tests against serum hormone measures, addressing key considerations for researchers and drug development professionals. The article explores the biological foundation of LH detection, methodological approaches for test validation across diverse populations, strategies for optimizing test performance and troubleshooting limitations, and comparative analyses of validation metrics against gold-standard references. By examining recent advances in urinary LH quantification and clinical applications in both fertility and specialized populations, this analysis provides a scientific framework for evaluating test accuracy, establishing threshold values, and identifying future research priorities for biomarker development and regulatory considerations.
The Biological Basis of LH Detection: From Serum Biomarkers to Urinary Metabolites
The accurate prediction of ovulation is a critical component of reproductive health and infertility management. The luteinizing hormone (LH) surge, a pivotal endocrine event triggering ovulation, can be measured in both serum and urine. This guide provides a comprehensive comparison of these two measurement approaches, synthesizing current evidence on their correlation, the molecular dynamics of urinary LH immunoreactivity, and detailed experimental methodologies. For researchers and drug development professionals, we present quantitative data on performance metrics, standardized protocols for assay validation, and emerging insights into how the detection of urinary LH degradation products may expand the fertility window. The objective analysis confirms that urinary LH measurements provide a reliable, non-invasive alternative to serum testing, with modern quantitative assays demonstrating high correlation to serum LH levels and clinical outcomes.
The mid-cycle surge of Luteinizing Hormone (LH) is the primary endocrine signal that initiates ovulation, making its accurate detection fundamental for basic reproductive research and clinical applications in fertility [1]. For decades, the gold standard for identifying this surge has been the measurement of intact LH in serum. However, the necessity for frequent phlebotomy makes serum monitoring impractical for long-term or home-based studies [2].
The correlation between serum patterns and urinary excretion of LH is therefore a cornerstone of modern fertility testing. Urine contains not only intact LH but also its molecular degradation products, including the free beta-subunit (LHβ) and the LH beta-core fragment (LHβcf), collectively referred to as urinary LH immunoreactivity (U-LH-ir) [3] [4]. Understanding the dynamics of these different molecular forms in urine relative to the intact LH surge in serum is critical for developing more accurate and user-friendly ovulation prediction kits (OPKs). This guide objectively compares the performance of serum and urinary LH measurement, providing researchers with the experimental data and protocols needed to validate urinary LH tests against serum benchmarks.
Molecular Foundations of Urinary LH
The immunoreactive LH measured in urine is a composite of several molecular species derived from pituitary LH secreted into the bloodstream.
LH Forms in Serum and Urine
- Serum LH (S-LH-ir): Comprises almost exclusively intact LH. The concentrations of free LHβ and LHβcf in serum are negligible [5] [4].
- Urinary LH (U-LH-ir): Contains a mixture of:
- Intact LH
- Free beta-subunit (LHβ)
- LH beta-core fragment (LHβcf)
This heterogeneity arises from the renal metabolism and degradation of the hormone before its excretion [3]. The composition of these forms shifts dramatically during the periovulatory period.
Dynamics of LH Forms Around the Surge
The following diagram illustrates the temporal relationship between serum LH and the different molecular forms of LH in urine during the periovulatory period.
As depicted, intact LH in both serum and urine shows a sharp peak coinciding with the LH surge day (Day 0), followed by a rapid decline to baseline within 1-2 days [3]. In contrast, total U-LH-ir remains statistically significantly elevated for up to 5 days after the serum surge due to the accumulating degradation products [5] [4]. This extended detectability of total U-LH-ir is a key advantage for widening the fertility prediction window.
Comparative Performance: Serum vs. Urinary LH
Quantitative Correlation Data
Extensive research has established a strong correlation between serum and urinary LH measurements. The table below summarizes key quantitative findings from recent studies.
Table 1: Correlation Between Serum and Urinary LH Surge Markers
| Performance Metric | Study Findings | Context / Assay Details | Citation |
|---|---|---|---|
| LH Surge Day Agreement | High correlation (R = 0.94, p<0.001) between urine monitors (Mira & ClearBlue) in postpartum women. | Postpartum fertility transition; Bland-Altman analysis showed good agreement. | [6] |
| LH Surge Day Agreement | High correlation (R = 0.83, p<0.001) between urine monitors in perimenopausal women. | Perimenopause fertility transition; Bland-Altman analysis showed good agreement. | [6] |
| Temporal Relationship | Intact U-LH-ir surges with serum, but total U-LH-ir remains elevated for 5+ days post-surge. | Total U-LH-ir includes LHβcf, which clears slowly. S-LH-ir returns to baseline in 1-2 days. | [5] [4] |
| Clinical Utility | Urine LH testing 12h post-trigger correctly identified 356/359 IVF donors with adequate LH surge. | GnRHa trigger in IVF; one false positive; cost-effective strategy to prevent failed retrieval. | [7] |
| Assay Validation | Inito monitor showed high correlation with ELISA for urinary E3G, PdG, and LH. | Quantitative home monitor; correlation established for all three metabolites. | [8] |
Characteristics of the Urinary LH Surge
Understanding the natural variability of the urinary LH surge in ovulatory cycles is essential for developing and interpreting OPKs.
Table 2: Characteristics of the Urinary LH Surge in Ovulatory Women
| Characteristic | Mean (±SD) / Distribution | Range (Observed) | Citation |
|---|---|---|---|
| Start Day (Cycle Day) | 14.5 ± 3.6 | 9 - 26 | [9] |
| Peak Concentration | 41.2 ± 20.0 mIU/mg Cr | 12.1 - 104.0 | [9] |
| Fold Increase from Baseline | 7.7 ± 3.0 | 2.5 - 14.8 | [9] |
| Surge Duration | 7.6 ± 1.5 days | 5 - 11 days | [9] |
| Surge Onset Type | Rapid (within 1 day): 42.9%Gradual (2-6 days): 57.1% | N/A | [9] |
| Surge Configuration | Spike: 41.9%Biphasic: 44.2%Plateau: 13.9% | N/A | [9] |
Experimental Protocols for Validation
For researchers aiming to validate new urinary LH assays or methodologies, the following protocols provide a robust framework.
Protocol 1: Validating Urinary LH Assays Against Serum
This protocol is adapted from studies that established the correlation between serum and urinary LH dynamics [5] [4].
- Subject Recruitment: Recruit healthy, reproductive-aged women (e.g., 18-40 years) with proven regular menstrual cycles. Exclude subjects using hormonal contraception or with conditions affecting ovulation.
- Sample Collection: Collect first-morning void urine and matched blood samples daily for 32 consecutive days. For precise timing, collect samples at a fixed time each morning (e.g., 8:00 AM). Serum should be separated and stored at -20°C. Urine can be stored at 4°C for up to a week before analysis.
- Hormone Assays:
- Serum: Measure intact LH and progesterone (to confirm ovulation). Use a highly specific immunoassay that does not cross-react with LHβ or LHβcf.
- Urine: Measure total U-LH-ir. Use an immunoassay that detects intact LH, LHβ, and LHβcf (e.g., the LHspec assay). Note: Creatinine correction may not be necessary if using first-morning voids and if correlation with serum is not improved by it [4].
- Data Analysis:
- Align cycles based on the day of the serum LH peak (Day 0).
- Plot the trajectories of intact S-LH-ir and total U-LH-ir across the periovulatory period.
- Use paired t-tests to compare the levels of S-LH-ir and U-LH-ir on the same days, particularly focusing on the days following the surge.
Protocol 2: Method Comparison for LH Surge Onset Detection
This protocol outlines methods for identifying the onset day of the LH surge in urine, a critical parameter for OPKs [1].
- Sample Set: Utilize stored daily urine samples from complete menstrual cycles with confirmed ovulation (e.g., via PdG rise >5 μg/mL [9]).
- Baseline Calculation (Three Key Methods):
- Method #1 (Fixed Days): Calculate the baseline mean and standard deviation (SD) from LH values from fixed cycle days (e.g., days 5-9).
- Method #2 (Retrospective, Peak-Based): Calculate the baseline from a window of days (e.g., 4-5 days) ending 2 days before the visually identified peak LH day.
- Method #3 (Retrospective, Surge-Based): Calculate the baseline from a window of days immediately preceding the estimated start of the surge.
- Surge Onset Definition: The LH surge onset day is typically defined as the first day when the LH level exceeds the baseline mean by a predefined threshold (e.g., 2.5 x SD of the baseline) and is sustained for at least one subsequent day.
- Validation: Compare the surge day identified by each algorithmic method against a "reference surge day" determined by expert visual analysis of the full hormonal profile.
Conclusion from Literature: Method #3, which uses a retrospective baseline assessment tailored to the individual's surge pattern, is reported as the most reliable [1].
The Scientist's Toolkit: Essential Research Reagents
Table 3: Key Reagents and Assays for LH Surge Research
| Item / Solution | Function / Application | Example & Notes |
|---|---|---|
| Intact LH Serum Assay | Measures bioactive, intact LH in serum; the gold standard reference. | AutoDELFIA hLH (PerkinElmer); uses an α-subunit capture and β-subunit detection antibody. |
| Total LH Urine Assay | Measures intact LH, LHβ, and LHβcf in urine; detects the full LH immunoreactivity. | AutoDELFIA hLHspec (PerkinElmer); both antibodies target the β-subunit. |
| Urinary PdG EIA Kit | Confirms ovulation via the urinary metabolite of progesterone. | Arbor Pregnanediol-3-Glucuronide EIA Kit (K037-H5). |
| Urinary E3G EIA Kit | Tracks estrogen rise to predict the start of the fertile window before the LH surge. | Arbor Estrone-3-Glucuronide EIA Kit (K036-H5). |
| WHO LH Standards | Calibrates assays to ensure consistency and comparability across studies. | WHO 2nd IS for pituitary LH (80/552). |
| Quantitative Home Monitors | For at-home validation studies; allows correlation of user-grade devices with lab assays. | Mira Monitor, Inito Fertility Monitor; provide quantitative hormone values. |
The body of evidence confirms a strong correlation between serum LH patterns and urinary LH excretion, validating urine as a reliable matrix for ovulation prediction. The key insight for future research and development lies in the molecular complexity of urinary LH. While intact LH in urine mirrors the serum surge, the prolonged detectability of total LH immunoreability—driven by the LH beta-core fragment—presents an opportunity to develop OPKs with a longer and more accurate detection window. For researchers and drug developers, the experimental protocols and performance data summarized here provide a foundation for the rigorous validation of new urinary LH assays and technologies, ultimately aiming to improve the precision of fertility awareness and clinical outcomes.
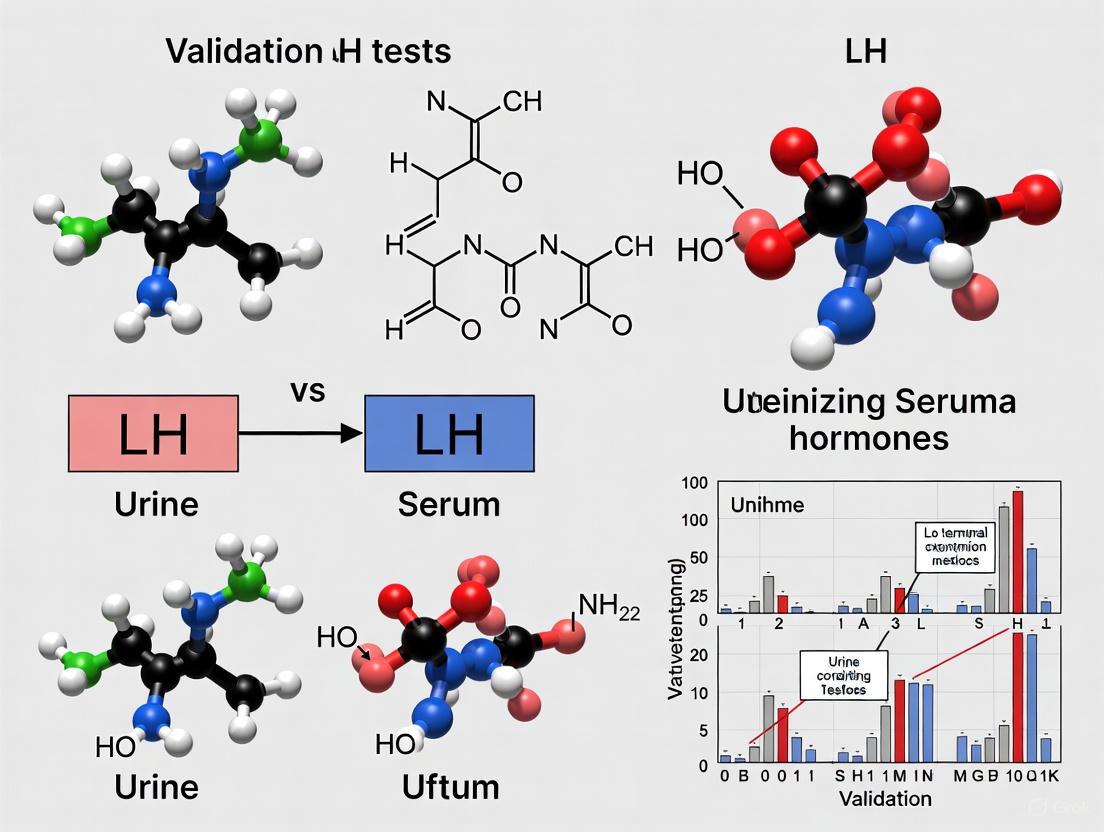
Luteinizing hormone (LH) is a critical glycoprotein for human reproduction, orchestrating ovulation in females and testosterone production in males. While serum LH levels are a standard diagnostic measure, the analysis of LH in urine presents a more complex picture due to metabolic processing. Following its secretion and clearance from the bloodstream, LH is metabolized by the kidneys, resulting in a mixture of molecular forms excreted in urine [10] [11]. Research has consistently identified three distinct immunoreactive forms of LH in urine: the intact LH heterodimer, the free LH beta-subunit (LHβ), and a smaller LH beta core fragment (LHβcf) [10] [5] [11]. The latter two constitute the non-intact portion of total urinary LH immunoreactivity (U-LH-ir) [11].
The accurate measurement of these forms is crucial for non-invasive clinical assessments, from evaluating the onset of puberty to predicting fertility windows. However, the varying detectability of these forms across different commercial immunoassays poses a significant challenge for researchers and clinicians aiming to validate urine LH tests against the gold standard of serum measures [10]. This guide provides a comparative analysis of the molecular forms of urinary LH and the assays used to detect them, offering a framework for their application in endocrine research and drug development.
Molecular Forms and Clinical Significance
The three molecular forms of LH found in urine are not present in equal proportions, and their ratios shift dynamically during different physiological states, such as the menstrual cycle.
Table 1: Molecular Forms of Luteinizing Hormone in Urine
| Molecular Form | Description | Clinical and Research Significance |
|---|---|---|
| Intact LH | The complete, heterodimeric glycoprotein hormone composed of both alpha and beta subunits [12]. | Considered the biologically active form. Its surge in serum and urine is a primary marker for predicting imminent ovulation (within 24-48 hours) [13] [14]. |
| LH Beta-Subunit (LHβ) | The isolated beta subunit of the LH molecule. | A metabolic derivative of intact LH. Its presence contributes to the total LH immunoreactivity measured in urine [10] [11]. |
| LH Beta Core Fragment (LHβcf) | A smaller fragment (approximately 10-12 kDA) resulting from the proteolytic digestion of the LH beta-subunit, leading to losses in its N- and C-terminal parts [10] [11]. | The predominant immunoreactive form in urine during the post-surge period [11]. It peaks 1-3 days after the intact LH surge and can reach concentrations several-fold higher than intact LH, potentially extending the detectable fertility window [15] [5] [11]. |
The following diagram illustrates the metabolic relationship between these molecular forms, from secretion to urinary excretion.
Diagram 1: Metabolic pathway of LH forms from secretion to urinary excretion.
Comparative Analysis of Commercial Immunoassays
The discontinuation of the widely used Delfia immunofluorometric assay (IFMA) has necessitated a comparative evaluation of alternative commercial assays for measuring urinary LH. The key differentiator among these assays is their ability to recognize the various molecular forms of LH, particularly the degradation products.
Table 2: Immunoassay Detection Profiles for Molecular Forms of Urinary LH
| Immunoassay | Manufacturer | Detection Capability | Key Findings from Gel Filtration Studies |
|---|---|---|---|
| Delfia IFMA (Discontinued) | Wallac, PerkinElmer | Total U-LH-ir (Intact LH, LHβ, and LHβcf) [10] | Served as a reference method for 30 years. Detects all three immunoreactive forms, making it a "total LH" assay [10]. |
| Immulite 2000 LH ICMA | Siemens | Total U-LH-ir (Intact LH, LHβ, and LHβcf) [10] | Identified as the only currently available alternative that detects all three forms of U-LH-ir with a profile similar to Delfia [10]. |
| Elecsys LH Cobas ECLIA | Roche | Intact LH and LHβ (Does not detect LHβcf) [10] | Detects intact LH and the free beta-subunit but fails to detect the smaller LHβcf, potentially missing a significant portion of non-intact immunoreactivity [10]. |
| Architect LH CMIA | Abbott | Intact LH only [10] | Detects solely the intact LH molecule. May significantly underestimate total LH immunoreactivity in urine, especially during the post-surge period when LHβcf is dominant [10]. |
Experimental Data: Temporal Patterns and Detection Dynamics
Understanding the temporal dynamics of these molecular forms is essential for applications like ovulation prediction. Experimental data from studies involving daily sampling of women during their menstrual cycles reveal distinct patterns.
Table 3: Temporal Dynamics of LH Molecular Forms Around the Surge
| Time Point Relative to LH Surge | Intact U-LH-ir | LHβcf & Non-Intact U-LH-ir | Serum LH-ir (S-LH-ir) |
|---|---|---|---|
| During the LH Surge (Day 0) | Dominant form; presents with an abrupt increase [11]. | Levels are present but not dominant [11]. | Peaks, indicating the primary signal from the pituitary [5] [11]. |
| 1 Day Post-Surge (Day +1) | Drops rapidly [11]. | LHβcf increases further, becoming the dominant form [11]. | Returns to follicular phase levels immediately [5]. |
| Days +2 to +5 Post-Surge | Remains at low, baseline levels [11]. | Remains strongly to moderately elevated. Total U-LH-ir stays significantly higher than S-LH-ir for 5 consecutive days [5] [11]. | At baseline levels [5]. |
| Day +7 Post-Surge | At baseline levels [11]. | May still be mildly elevated. Total U-LH-ir takes ~7 days to return to baseline [5]. | At baseline levels [5]. |
The following diagram visualizes these temporal relationships, highlighting the extended window of detection for urinary total LH immunoreactivity compared to serum LH.
Diagram 2: Comparative dynamics of serum and urinary LH forms around the surge.
Detailed Experimental Protocols
To ensure reproducibility in research, the following summarizes the key methodological details from the cited comparative studies.
Sample Collection and Preparation
- Subject Population: Studies typically involve healthy, regularly menstruating women (e.g., aged 22-48) [11]. Postmenopausal urine samples may be used as a source of high LH concentration for assay validation [10].
- Sample Type: First-morning-voided (FMV) urine is often collected, as it reflects the integrated nighttime LH secretion [10]. Serum samples are collected concurrently for comparison.
- Storage: Urine samples can be stored at +4°C for up to a week before analysis. For longer storage, samples are often frozen, though specific stability data should be consulted [12] [11].
Gel Filtration Chromatography
- Purpose: To physically separate the different molecular weight forms of LH (intact, LHβ, LHβcf) from concentrated urine samples for individual analysis [10] [11].
- Protocol:
- Concentration: Fresh urine samples are concentrated via centrifugal concentration [10].
- Column: Processed using gel filtration columns (e.g., 10/300 mm Superdex G-75, 16/600 mm Sephacryl S-100) [10].
- Elution: Eluted with 0.1 M ammonium bicarbonate buffer (e.g., 15 mmol/L, pH 8) at a flow rate of 0.5 mL/min [10].
- Fraction Collection: 0.5 mL samples are collected, producing fractions enriched in different LH forms based on molecular size [10].
Immunoassay Methodology
Assays are performed according to manufacturers' instructions, typically using a sample volume of 25 µL for both serum and urine [10] [11]. The core principle is a sandwich immunoassay:
- Capture: One monoclonal antibody is immobilized onto a solid phase (e.g., microtiter strip well, microparticle).
- Incubation: The sample is added, and the target LH forms bind to the capture antibody.
- Detection: A second antibody, labeled with a detectable marker (europium chelate, chemiluminescent compound, etc.), binds to a different epitope on the target LH forms, completing the "sandwich."
- Measurement: The signal from the label is measured and is proportional to the concentration of the LH form(s) detected by the antibody pair [10] [12] [11].
The Scientist's Toolkit: Key Research Reagents and Materials
Table 4: Essential Materials for Urinary LH Form Research
| Item | Function in Research | Example Specifications |
|---|---|---|
| Commercial LH Immunoassays | To quantify intact, total, or specific forms of LH in serum and urine fractions. | Delfia IFMA (reference), Immulite 2000 ICMA, Elecsys Cobas ECLIA, Architect CMIA [10]. |
| Gel Filtration Chromatography System | To separate the different molecular forms of LH (intact, LHβ, LHβcf) from urine samples based on molecular size. | Superdex G-75 column, Sephacryl S-100 column [10]. |
| Chromatography Elution Buffer | To serve as the mobile phase for gel filtration, maintaining pH and ionic strength for optimal protein separation and stability. | 0.1 M Ammonium bicarbonate buffer (e.g., 15 mmol/L, pH 8.0) [10]. |
| Assay Buffer | To provide a consistent matrix for immunoassay reactions, minimizing non-specific binding and stabilizing reagents. | Tris-buffered saline (TBS) with BSA, bovine globulin, and detergent (e.g., Tween 20) [11]. |
| WHO International LH Standards | To calibrate immunoassays, ensuring consistency and comparability of results across different laboratories and studies. | WHO 2nd IS for pituitary LH (80/552); WHO 2nd IRP of pituitary FSH/LH (78/549) [5] [11]. |
The precise temporal relationship between the luteinizing hormone (LH) surge and subsequent ovulation represents a fundamental biological process with significant implications for fertility management and reproductive research. The established 24-48 hour window between the urinary LH surge and ovulation provides a critical timeframe for conception planning and assisted reproductive technologies [16] [17]. This review examines the validation of urine-based LH detection methods against serum hormone measures, comparing technological approaches and their clinical applications across diverse patient populations.
Urinary LH testing has evolved significantly from qualitative lateral flow assays to quantitative digital platforms that simultaneously track multiple hormonal biomarkers. These advancements aim to bridge the gap between laboratory-based serum analytics and practical home-use applications, providing researchers and clinicians with increasingly sophisticated tools for ovulation monitoring [8]. The following analysis synthesizes current evidence on the performance characteristics of various urinary LH testing methodologies within the context of the well-characterized 24-48 hour preovulatory window.
Physiological Basis of the LH Surge and Ovulation
Endocrine Orchestration of Ovulation
The luteinizing hormone surge initiates a cascade of biochemical events culminating in follicular rupture and oocyte release. Produced by the pituitary gland, LH circulates in serum before being metabolized and excreted in urine [16] [17]. The surge triggers the final maturation of the dominant follicle, activating proteolytic enzymes that degrade the follicular wall, leading to rupture and egg release approximately 24-36 hours after surge initiation [18] [17].
Research demonstrates that urine contains multiple molecular forms of LH immunoreactivity, including intact LH, LH beta-subunit (LHβ), and LHβ core fragment (LHβcf) [5]. The proportion of these forms varies significantly during the periovulatory period, with total urinary LH immunoreactivity remaining elevated for several days after the serum LH surge has subsided [5]. This extended detection profile potentially widens the observable fertility window beyond what serum monitoring alone can provide.
Figure 1: Hormonal Pathway from Pituitary Secretion to Urinary Detection. This diagram illustrates the metabolic pathway of luteinizing hormone from pituitary secretion through serum circulation to urinary excretion, highlighting the extended detection window of LH fragments in urine compared to intact LH in serum.
Temporal Dynamics Between LH Surge and Ovulation
The temporal relationship between LH surge detection and ovulation has been quantitatively characterized through multimodal assessment strategies. Transvaginal ultrasonography combined with urinary LH testing has demonstrated that ovulation follows the onset of the detectable urinary LH surge within a predictable 24-48 hour window in the majority of cycles [19]. However, notable individual variability exists, with some women ovulating as early as 8 hours or as late as 60 hours after surge detection [16].
Table 1: Temporal Relationship Between LH Surge and Ovulation
| Parameter | Timeframe | Supporting Evidence |
|---|---|---|
| Onset of Urinary LH Surge to Ovulation | 24-48 hours | [16] [17] |
| Peak Urinary LH to Ovulation | 8-20 hours | [16] |
| Duration of LH Surge | 24-48 hours | [16] [20] |
| Serum LH to Urinary LH Detection Lag | 2-8 hours | [5] |
| Post-Ovulation LH Normalization | 24-48 hours | [16] [20] |
| Discrepant Cases (Ovulation Before Surge Detection) | 9% of cycles | [19] |
Quantitative studies reveal that serum LH normalization occurs rapidly post-ovulation, while urinary LH immunoreactivity remains elevated for 5-7 days after the serum surge due to persistent LH metabolite excretion [5]. This extended urinary detection profile has implications for fertility window identification, particularly for women attempting to conceive through natural or assisted means.
Comparative Analytical Performance of Urinary LH Detection Systems
Methodological Approaches in Urinary LH Detection
Various technological platforms have been developed to detect the urinary LH surge, each employing distinct methodological approaches with corresponding performance characteristics. Traditional lateral flow immunoassays provide qualitative or semi-quantitative results through visual interpretation of test and control lines [21]. More advanced digital systems incorporate optical readers and smartphone connectivity to provide quantitative hormone measurements [8].
Recent innovations include multi-hormone fertility monitors that simultaneously measure LH alongside other reproductive biomarkers such as estrone-3-glucuronide (E3G) and pregnanediol glucuronide (PdG) [6] [8]. These systems aim to expand the detectable fertility window beyond the LH surge alone and provide ovulation confirmation through paired hormone metrics.
Table 2: Analytical Performance of Urinary LH Detection Systems
| Methodology | Detection Principle | Hormones Measured | Reported Correlation with Serum | Key Performance Characteristics |
|---|---|---|---|---|
| Traditional Lateral Flow Assays | Visual line interpretation | LH | Not quantitatively established | 68-84% agreement with reference method [21] |
| ClearBlue Fertility Monitor | Optical intensity measurement | E3G, LH | Not directly reported | "High" and "Peak" fertility designations [6] |
| Mira Monitor | Fluorescence assay | E3G, LH | R=0.94 (postpartum), R=0.83 (perimenopause) vs. CBFM [6] | Quantitative values (IU/L) |
| Inito Fertility Monitor | Smartphone-based image analysis | E3G, PdG, LH | High correlation with ELISA (R values not specified) [8] | 99% lab-grade accuracy claimed [18] |
| Laboratory ELISA | Microplate spectrophotometry | LH, E3G, PdG | Gold standard | Intra-assay CV: <2-10% [5] |
Validation Studies and Method Comparison
Substantial research has focused on validating home-use urinary LH tests against established reference methods. A 2023 study evaluating the Inito Fertility Monitor demonstrated strong correlation with laboratory-based ELISA measurements for LH, E3G, and PdG [8]. The monitor showed coefficient of variation (CV) values of 5.57% for LH measurement, 4.95% for E3G, and 5.05% for PdG, indicating acceptable analytical precision for home-use devices [8].
Comparative studies between different monitoring systems have revealed generally strong agreement. Research comparing the Mira Monitor and ClearBlue Fertility Monitor demonstrated high correlation in ovulation day identification (R=0.94 postpartum, R=0.83 perimenopause) [6]. These findings support the clinical validity of quantitative home-use monitors across different physiological states, including the postpartum and perimenopausal transitions where cycle regularity is often compromised.
Figure 2: Methodological Landscape of Urinary LH Detection Technologies. This diagram categorizes current urinary LH detection methodologies by technological approach and performance characteristics, highlighting the evolution from qualitative visual tests to quantitative multi-hormone monitoring systems with established correlation to reference methods.
Experimental Protocols for Urinary LH Test Validation
Standardized Validation Methodology
Robust validation of urinary LH tests requires carefully controlled experimental protocols that establish analytical and clinical performance against reference standards. The following methodology synthesizes approaches from multiple validation studies [6] [8] [5]:
Sample Collection and Handling:
- First-morning urine samples collected daily throughout menstrual cycle
- Aliquot preservation at -20°C until batch analysis
- Paired serum samples collected concurrently for method comparison studies
- Documentation of sample collection time and time since last void
Analytical Procedures:
- Parallel testing of samples with investigational device and reference method
- For quantitative systems: calibration against standard solutions of known concentration
- For qualitative tests: blinded interpretation by multiple readers to assess inter-rater reliability
- Assessment of precision through repeated measures of control materials
Statistical Analysis:
- Correlation analysis between investigational device and reference method
- Bland-Altman analysis to assess agreement between methods
- Calculation of coefficients of variation for precision assessment
- Receiver Operating Characteristic (ROC) analysis for diagnostic accuracy
Special Population Considerations
Validation protocols must account for performance variations across different physiological states and patient populations:
Perimenopausal Women:
- Defined by STRAW criteria as early perimenopause (>40 years with persistent ≥7-day cycle length variations) or late perimenopause (>60-day amenorrhea intervals) [6]
- Typically demonstrate higher baseline LH levels requiring adjusted reference ranges
Postpartum Women:
- Testing initiated after first postpartum menses
- Consideration of lactational status and potential impact on LH pulsatility
Polycystic Ovary Syndrome (PCOS):
- Characterized by persistently elevated LH levels potentially leading to false-positive surge detection [17]
- Requires confirmation of ovulation through additional biomarkers such as progesterone or PdG
Research Reagent Solutions for LH Detection Studies
Table 3: Essential Research Reagents for Urinary LH Detection Studies
| Reagent/Category | Specific Examples | Research Application | Performance Notes |
|---|---|---|---|
| Reference Standards | WHO International Standard for pituitary LH (80/552) | Assay calibration | Provides standardized IU/L measurements across platforms [5] |
| LH Immunoassays | AutoDELFIA hLH (PerkinElmer), DRG LH ELISA (EIA-1290) | Reference method establishment | Detect intact LH and fragments with specific epitope recognition [5] |
| Urinary Metabolite Assays | Arbor Estrone-3-Glucuronide EIA (K036-H5), Arbor Pregnanediol-3-Glucuronide EIA (K037-H5) | Fertility window expansion | Measures estrogen and progesterone metabolites [8] |
| Quality Control Materials | Spiked urine samples with known LH concentrations | Precision and recovery studies | Assess assay linearity and reproducibility [8] |
| Interference Substances | hCG, acetaminophen, ascorbic acid, caffeine, hemoglobin | Specificity assessment | Identifies potential cross-reactivity [8] |
Discussion and Research Implications
The validation of urinary LH tests against serum measures represents a critical interface between laboratory endocrinology and clinical practice. While the 24-48 hour temporal relationship between urinary LH surge detection and ovulation is well-established, emerging evidence suggests that the inclusion of additional urinary biomarkers may enhance fertility window prediction, particularly in special populations with altered LH dynamics [6] [8] [5].
Quantitative home-use devices show promising correlation with reference methods, yet important limitations persist. The variability in LH fragmentation patterns between individuals [5], potential for anovulatory cycles despite detected LH surges [20], and methodological differences in surge definition across platforms [21] represent ongoing challenges in the field. Future research directions should include standardized validation protocols across devices, investigation of population-specific reference ranges, and integration of multiple hormonal biomarkers to improve predictive value across diverse patient populations.
The continuing evolution of urinary hormone monitoring technologies offers exciting possibilities for both clinical management and reproductive research. As these platforms become increasingly sophisticated and accessible, they provide unprecedented opportunities to study menstrual cycle dynamics across diverse populations and physiological states, potentially yielding new insights into the complex endocrine interactions governing human reproduction.
The accurate tracking of ovarian function is fundamental to fertility research, gynecological drug development, and womens health diagnostics. For decades, the clinical gold standard for hormonal assessment has been serum testing, which provides direct measurement of reproductive hormones in the bloodstream [22]. However, the advent of urinary luteinizing hormone (LH) tests has offered a less invasive, more accessible alternative for predicting ovulation and monitoring reproductive status [23]. This guide objectively compares the performance of urinary LH testing against serum hormone measures across diverse physiological populations, with particular attention to cycle regularity, postpartum recovery, and perimenopausal transition.
The critical biochemical relationship underpinning this comparison lies in the hypothalamic-pituitary-gonadal (HPG) axis. Urinary LH tests detect the intact hormone or its metabolites excreted in urine, while serum tests measure circulating concentrations directly [23]. Understanding the correlation between these compartments is essential for validating urinary testing across varying physiological states where hormone production, metabolism, and clearance may differ significantly.
Comparative Performance Data: Urine LH Tests vs. Serum Measures
Table 1: Overall Performance of Urinary LH Tests in Predicting Ovulation
| Metric | Performance | Reference Standard | Study Details |
|---|---|---|---|
| Sensitivity | ~90% | Transvaginal ultrasonography | 1989 study of 33 spontaneously ovulating women [19] |
| Specificity | 100% | Transvaginal ultrasonography | 1989 study of 33 spontaneously ovulating women [19] |
| Ovulation Detection | 100% of cycles | Luteal phase progesterone & endometrial biopsy | 1989 study of 33 spontaneously ovulating women [19] |
| Limitation | Onset of urinary LH occurred after follicle rupture in 9% of women | Transvaginal ultrasonography | Indicates potential for late prediction in a minority of cases [19] |
Correlation with Serum Hormones and Cycle Phase Tracking
Table 2: Correlation Between Urinary and Serum Hormone Measurements Across the Menstrual Cycle
| Hormone Pair | Correlation/Performance | Clinical Implication | Study Details |
|---|---|---|---|
| Urinary LH (ULH) vs. Serum LH | More fluctuations in urinary levels | Serum levels provide a more stable baseline measurement [24] | 2024 comparative study of 4 women with daily blood & urine samples [24] |
| E3G (Urine) vs. Serum Estradiol (E2) | E3G failed to identify start of fertile window; Serum E2 successfully predicted it (Day -7 or -5) | Serum E2 superior for predicting the start of the 6-day fertile window [24] | Fertility Indicator Equation (FIE) tested in ovulatory cycles [24] |
| PDG (Urine) & Serum Progesterone | Both (E3G, PDG) and (E2, P) with AUC algorithm signaled ovulation/luteal transition | Both methods successful for timing the ovulation to luteal phase transition [24] | Area Under the Curve (AUC) algorithm applied [24] |
| Urinary LH vs. Endometrial Histology | Significant correlation (P=0.079) | Excellent method for planning endometrial biopsies in luteal phase [25] | 1992 study of 20 women undergoing infertility evaluation [25] |
Experimental Protocols for Method Comparison
Protocol 1: Daily Serum and Urine Hormone Tracking in Ovulatory Cycles
Objective: To compare day-specific serum hormone levels with urinary hormone metabolites for identifying fertile window and ovulation/luteal transition [24].
Population: Adult women with confirmed ovulatory cycles.
Methodology:
- Blood Collection: Daily venous blood samples collected throughout entire menstrual cycle.
- Serum Analysis: Quantification of LH, Estradiol (E2), and Progesterone (P) via immunoassay.
- Urine Collection: First-morning void collected daily; analyzed with Mira monitor for urinary LH (ULH), Estrone-3-glucuronide (E3G), and Pregnanediol-3-glucuronide (PDG).
- Ovulation Confirmation: Transvaginal ultrasonography performed to track dominant follicle collapse, defined as Day 0.
- Data Analysis: Cycle day indexing relative to ovulation (Day 0). Application of Fertility Indicator Equation (FIE) and Area Under the Curve (AUC) algorithm to identify start of fertile window and ovulation/luteal transition point [24].
Protocol 2: Ultrasonography-Confirmed Urinary LH Surge Accuracy
Objective: To evaluate the accuracy of urinary LH testing in predicting (rather than merely detecting) ovulation [19].
Population: Spontaneously ovulating women (n=33).
Methodology:
- Urine Testing: Daily urinary LH testing beginning cycle day 10.
- Ovulation Confirmation: Transvaginal ultrasonography to visualize follicle development and rupture.
- Additional Confirmation: Luteal phase progesterone levels and endometrial biopsy.
- Data Analysis: Comparison between day of urinary LH surge onset and day of follicle rupture confirmed by ultrasonography [19].
Signaling Pathways and Experimental Workflows
The Hypothalamic-Pituitary-Gonadal (HPG) Axis and Hormone Measurement
Diagram 1: HPG Axis and Hormone Measurement Sites. The HPG axis regulates reproductive hormone secretion. Serum tests measure hormones directly in blood, while urine tests detect metabolites after processing.
Experimental Workflow for Serum vs. Urine Hormone Comparison
Diagram 2: Experimental Workflow for Method Comparison. Parallel collection of serum and urine samples with independent analysis and correlation against a confirmed ovulation standard.
Population-Specific Considerations
Perimenopausal Women
The menopausal transition presents particular challenges for hormonal monitoring due to extreme hormone fluctuations [26]. During perimenopause, the hallmark hormonal changes include low anti-Müllerian hormone (AMH), declining estradiol and progesterone, and elevated follicle-stimulating hormone (FSH) [26] [27]. These fluctuations may impact the reliability of both serum and urinary hormone assessments.
Key Considerations:
- Hormonal Variability: The late menopausal transition is characterized by the most extreme hormone fluctuations, particularly of estradiol [26]. Single timepoint measurements (serum or urine) may not capture the dynamic hormonal milieu.
- Ovulation Confirmation: In perimenopause, anovulatory cycles become more frequent. Urinary LH surges may occur without subsequent ovulation, potentially leading to false-positive ovulation predictions [24].
- FSH Interpretation: Both serum and urinary FSH levels are typically elevated during perimenopause and remain stably elevated postmenopause [26]. However, FSH can fluctuate widely during the transition.
Postpartum and Lactating Women
The postpartum period is characterized by a unique endocrine environment, particularly in lactating women. The return of ovarian function is variable and influenced by breastfeeding frequency and duration.
Key Considerations:
- LH Surge Reliability: The first ovulatory cycles postpartum are often associated with subtle LH surges that may be more challenging to detect with urinary tests [19].
- Baseline Hormone Levels: The hormonal milieu of lactation (elevated prolactin, suppressed estradiol) may alter the characteristics of the first detectable LH surge.
- Cycle Irregularity: Initial cycles postpartum are frequently anovulatory or characterized by luteal phase defects, complicating the interpretation of both serum and urinary hormone patterns.
Women with Irregular Cycles
Women with polycystic ovary syndrome (PCOS) or other causes of oligo-ovulation present particular challenges for ovulation prediction.
Key Considerations:
- Extended Testing Windows: Women with irregular cycles may require prolonged daily testing to capture the LH surge, increasing cost and testing burden [28].
- Baseline Hormone Levels: Mildly elevated baseline LH levels are common in PCOS, potentially reducing the surge-to-baseline ratio and making surge detection more difficult with qualitative tests [29].
- Anovulatory Cycles: The frequency of anovulatory cycles is higher in this population, leading to potential misinterpretation of urinary LH patterns without ovulation confirmation.
The Scientist's Toolkit: Research Reagent Solutions
Table 3: Essential Research Materials for Hormone Comparison Studies
| Reagent/Kit | Function | Application Context |
|---|---|---|
| Serum LH/FSH Immunoassay | Quantifies circulating levels of gonadotropins | Gold standard reference for pituitary hormone secretion [24] |
| Serum Estradiol/Progesterone Immunoassay | Measures bioactive ovarian hormones in circulation | Direct assessment of ovarian steroid production [24] [26] |
| Urinary LH Test Strips (Lateral Flow) | Detects LH surge in urine; qualitative or semi-quantitative | Home testing; population screening studies [30] |
| Digital Urine Hormone Monitor (e.g., Mira) | Quantifies urinary LH, E3G, PDG, FSH | Longitudinal tracking of hormone metabolites; fertility monitoring research [24] [23] |
| Transvaginal Ultrasound Probe | Visualizes follicular development and collapse | Gold standard for confirming ovulation timing [24] [19] |
| AMH (Anti-Müllerian Hormone) Assay | Measures ovarian reserve | Population stratification for reproductive aging studies [26] |
The validation of urinary LH tests against serum hormone measures reveals a complex performance profile that varies across physiological populations. While urinary LH testing demonstrates excellent specificity and reliability for detecting the LH surge in regularly cycling women [19] [25], serum estradiol measurements may provide superior prediction of the fertile window onset [24]. Critical considerations for researchers include the 9% rate of post-ovulation LH surge detection [19], the superior performance of serum estradiol for fertile window opening, and the comparable performance of both methods for detecting the ovulation-to-luteal transition [24].
Population-specific factors significantly influence test performance. Perimenopausal women exhibit extreme hormonal fluctuations that may impact the interpretation of single timepoint measurements [26]. Postpartum and lactating women present unique challenges related to their distinctive endocrine environment, while women with irregular cycles require extended testing windows and consideration of frequent anovulatory cycles.
These findings highlight the need for population-specific validation of urinary hormone testing and careful consideration of the research question when selecting between serum and urinary hormone assessment methods. Future directions should include developing integrated algorithms that combine the strengths of both testing modalities across diverse physiological states.
Methodological Approaches for Urinary LH Test Validation and Clinical Implementation
Luteinizing Hormone (LH) is a pivotal glycoprotein secreted by the anterior pituitary gland, playing an essential role in regulating gonadal function. In females, it stimulates ovulation and corpus luteum formation, while in males, it regulates testosterone production by Leydig cells. The accurate measurement of serum LH is therefore fundamental for diagnosing infertility, evaluating menstrual irregularities, identifying pituitary disorders, and managing assisted reproductive technologies [31]. Immunoassays have become the cornerstone for LH quantification in clinical and research settings, with various technological platforms offering different performance characteristics.
A critical context for evaluating these assays is the validation of urinary LH tests against serum hormone measures. Urinary LH measurement presents a non-invasive alternative, but its reliability hinges on a clear understanding of its correlation with serum levels, which are the direct reflection of pituitary secretion. This guide provides a systematic comparison of contemporary serum LH immunoassays, details their correlation with the gold standard of ultrasonography for timing ovulation, and outlines the experimental protocols essential for validating these assays in both clinical and research environments. This foundation is vital for researchers and drug development professionals aiming to develop and validate robust, non-invasive urinary LH tests [10] [32].
Comparative Analysis of Serum LH Immunoassay Platforms
A diverse array of immunoassay platforms is available for the quantification of serum LH, each with distinct methodologies, sensitivities, and clinical applications. The choice of assay can significantly influence the measured LH concentration due to differences in antibody specificity, particularly towards the various molecular forms of LH in circulation (intact hormone, free subunits, and fragments).
Table 1: Comparison of Contemporary Serum LH Immunoassay Methodologies
| Assay Platform | Technology Abbreviation | Principle | Representative Commercial Kits | Reported Detection Limit | Key Characteristics |
|---|---|---|---|---|---|
| Chemiluminescent Magnetic Immunoassay | MPs-CLEIA | Sandwich immunoassay using magnetic particles as solid phase and separator; HRP-luminol-H₂O₂ chemiluminescent detection [31]. | In-house developed assay [31] | 0.2 mIU/mL [31] | High-throughput, rapid, sensitive, wide linear range (0.5-200 mIU/mL), avoids radioactive labels [31]. |
| Immunochemiluminometric Assay | ICMA | Sandwich immunoassay using chemiluminescent detection. | Immulite 2000 LH (Siemens) [10] | Not specified in search | Detects total LH immunoreactivity, including intact LH, LHβ, and LHβcf; suitable for urinary LH [10]. |
| Electrochemiluminescence Immunoassay | ECLIA | Electrochemiluminescence detection technology. | Elecsys LH Cobas (Roche) [10] | Not specified in search | Detects only intact LH and LHβ; does not detect the LHβ core fragment [10]. |
| Chemiluminescent Microparticle Immunoassay | CMIA | Chemiluminescent detection with antibody-coated microparticles. | Architect LH (Abbott) [10] | Not specified in search | Detects solely the intact form of LH [10]. |
| Ultrasensitive ELISA | ELISA | Sandwich ELISA with enzymatic colorimetric or fluorescent detection. | Breen assay (research use) [33] | More sensitive than predecessor (Steyn assay) [33] | Capable of measuring LH in very small sample volumes (2-4 µL); ideal for pulsatility studies in mouse models [33]. |
The performance of these assays is not only a matter of technological sensitivity but also of antibody specificity. For instance, the Immulite 2000 (Siemens) demonstrates a capability to detect total LH immunoreactivity, including the intact hormone, its free beta-subunit (LHβ), and the core fragment of the beta-subunit (LHβcf). This is particularly important in contexts like measuring urinary LH in neonates or during the onset of puberty, where capturing all immunoreactive remnants is crucial. In contrast, the Architect LH (Abbott) detects only the intact hormone, and the Elecsys LH Cobas (Roche) detects intact LH and LHβ but not the LHβcf [10]. This difference in specificity can lead to disparate clinical interpretations and underscores the necessity of selecting an assay aligned with the clinical or research question.
Correlation of Serum LH with Ultrasonography for Ovulation Timing
The surge in serum LH is a primary hormonal predictor of impending ovulation, and its correlation with transvaginal ultrasonography (TVUS) is the gold standard for pinpointing the fertile window. TVUS visually tracks the development and subsequent collapse of the dominant follicle, providing direct morphological evidence of ovulation.
A rigorous study comparing day-specific serum hormone levels with TVUS findings indexed the cycle to the day of dominant follicle (DF) collapse (defined as Day 0). Ovulation was confirmed to occur in the 24-hour interval between the last day of maximum DF diameter (Day -1) and Day 0. The data demonstrated that the serum LH peak is tightly coupled with this ultrasonographic event. Furthermore, the combination of serum estradiol (E2) and progesterone (P) levels, analyzed using an Area Under the Curve (AUC) algorithm, successfully signaled the Day -1 to Day 0 ovulation/luteal transition interval in all cycles studied [32].
Table 2: Key Hormonal and Ultrasonographic Markers for Ovulation Timing
| Parameter | Method of Measurement | Typical Pattern Relative to Ovulation (Day 0) | Utility in Ovulation Prediction |
|---|---|---|---|
| Serum LH | Immunoassays (e.g., CLIA, ECLIA) | Sharp peak 24-36 hours before ovulation [32]. | Excellent primary predictor; surge precedes ovulation. |
| Serum Progesterone (P) | Immunoassays (e.g., CLIA, FEIA) | Low pre-ovulation; begins a definitive rise immediately after ovulation [34] [32]. | Confirms ovulation has occurred; rise indicates luteal phase onset. |
| Serum Estradiol (E2) | Immunoassay | Peaks just before the LH surge [32]. | Signals follicular maturation and impending LH surge. |
| Dominant Follicle (DF) | Transvaginal Ultrasonography (TVUS) | Grows to maximum diameter (Day -1), then collapses (Day 0) [32]. | Direct visualization of ovulation; gold standard for confirmation. |
| Urinary LH (ULH) | Home fertility monitors (e.g., Mira) | Peaks in urine approximately 24 hours after serum LH peak [32]. | Non-invasive proxy for serum surge; practical for home use. |
This multi-parameter approach highlights that while the LH surge is a critical signal, the most robust determination of the ovulatory event comes from integrating hormonal data with ultrasonographic imaging. This correlation is essential for validating urinary LH tests, as their objective is to accurately mirror these serum and morphological events through a non-invasive medium [32].
Detailed Experimental Protocols for Assay and Ultrasound Correlation
To ensure the validity and reproducibility of data correlating serum LH with ovulation, standardized experimental protocols are paramount. The following outlines key methodologies cited in the literature.
Protocol for Serum LH Measurement via Magnetic Chemiluminescent Immunoassay (MPs-CLEIA)
This protocol, adapted from a 2009 study, describes a sensitive and rapid method for serum LH quantification [31].
- Reagent Preparation: Coat magnetic particles (MPs) with anti-fluorescein isothiocyanate (FITC) antibody. Prepare a working solution of FITC-labeled anti-LH antibody and horseradish peroxidase (HRP)-labeled anti-LH antibody.
- Immunological "Sandwich" Reaction: In a test tube, mix 50 µL of serum sample (or calibrator) with 50 µL of the FITC-labeled anti-LH antibody and 50 µL of the HRP-labeled anti-LH antibody. Vortex and incubate for 15 minutes at 37°C in a thermostatic culture oscillator.
- Magnetic Separation and Washing: Place the test tube on a magnetic separator to pellet the MPs. Carefully aspirate and discard the supernatant. Wash the pellet with wash buffer to remove unbound components.
- Chemiluminescent Detection: Add 200 µL of a chemiluminescent substrate solution (luminol and H₂O₂) to the MPs. The HRP enzyme catalyzes a reaction that produces light.
- Measurement and Calculation: Place the tube in a luminometer to measure the relative light units (RLU). The LH concentration in the sample is determined by interpolating from a calibration curve of RLU versus LH concentration for the calibrators.
Protocol for Correlating Serum LH with Transvaginal Ultrasonography
This protocol is derived from a 2024 study that provided daily hormonal and ultrasonographic tracking [32].
- Subject Recruitment and Sample Collection: Recruit subjects with regular menstrual cycles. Obtain daily venous blood samples every morning, starting from cycle day 1 until the next menses. Allow blood to clot, centrifuge, and store the serum at -80°C until assayed.
- Transvaginal Ultrasonography (TVUS): Begin TVUS examinations approximately seven days prior to the estimated day of ovulation. Perform scans daily until two days after observed dominant follicle (DF) collapse.
- Imaging: Use a high-resolution ultrasound machine (e.g., Philips EPIQ 7). Measure all follicles in two perpendicular dimensions and record the mean diameter.
- Definition of Key Days:
- Day -1: The last day the DF is observed at its maximum diameter.
- Day 0: The first day of DF collapse, identified by a decrease in size and changes in the cyst wall.
- Ovulation is defined as having occurred in the 24-hour interval between Day -1 and Day 0.
- Hormonal Assay: Analyze the daily serum samples for LH, estradiol (E2), and progesterone (P) using validated immunoassays (e.g., CLIA, ECLIA).
- Data Analysis: Index all daily hormone levels to the TVUS-defined Day 0. Analyze the patterns to identify the relationship between the serum LH peak and the morphological event of follicle collapse. Apply mathematical tools like the Area Under the Curve (AUC) algorithm for the (E2, P) pair to objectively identify the transition to the luteal phase.
Diagram 1: Experimental workflow for correlating serum LH levels with ultrasonography.
The Scientist's Toolkit: Key Research Reagent Solutions
The following reagents and materials are essential for conducting research on LH and its role in reproductive function.
Table 3: Essential Research Reagents for LH and Ovarian Function Studies
| Research Reagent | Function and Application in Research |
|---|---|
| Monoclonal Anti-LH Antibodies | Core components of sandwich immunoassays; specificity for different epitopes on the LH molecule determines which molecular forms (intact, LHβ, LHβcf) are detected [10] [33]. |
| LH Reference Standards & Calibrators | Essential for assay calibration and ensuring quantitative accuracy across different batches and platforms. Calibrators are typically standardized against international reference preparations (e.g., WHO standards) [10]. |
| Magnetic Particles (MPs) | Serve as a mobile solid phase in advanced immunoassays (e.g., MPs-CLEIA). They facilitate rapid separation of bound and free analytes, reducing assay time and improving sensitivity [31]. |
| Chemiluminescent Substrates (e.g., Luminol-H₂O₂) | Used in CLEIA and CLIA for highly sensitive detection. The light-emitting reaction catalyzed by enzymes like HRP provides a low detection limit and a wide dynamic range [31]. |
| Estradiol Valerate | Exogenous estrogen used in clinical research protocols, such as preparing the endometrium in hormone replacement therapy-frozen embryo transfer (HRT-FET) cycles, to study controlled ovarian and uterine responses [35]. |
| GnRH Agonists (e.g., Leuprolide) | Used to suppress the endogenous hypothalamic-pituitary-gonadal axis in research settings, allowing for the study of isolated endocrine pathways or the control of the menstrual cycle in clinical studies [35]. |
The correlation between serum LH immunoassays and transvaginal ultrasonography remains the undisputed reference standard for defining the ovulatory event in the menstrual cycle. This comparative guide illustrates that while modern immunoassays are highly sensitive, their clinical utility is profoundly influenced by their specificity for different molecular forms of LH. The integration of hormonal data with ultrasonography provides a robust framework for validation.
Future directions in this field will likely involve the refinement of fully automated, high-throughput assays like MPs-CLEIA to improve accessibility and standardization. Furthermore, the ongoing development of ultrasensitive assays for research, such as those used in mouse models, deepens our understanding of LH pulsatility [33]. A significant application of this reference-standard correlation is the validation of non-invasive urinary hormone monitors. As research continues to clarify the relationship between serum and urinary LH forms [10] [32], the potential for accurate, user-friendly fertility tracking technologies will expand, bridging the gap between clinical diagnostics and personal health monitoring.
The accurate prediction of ovulation is a cornerstone of reproductive health, enabling optimized timing for conception and providing critical insights for the diagnosis and treatment of infertility. Among the various biomarkers used for this purpose, the urinary luteinizing hormone (LH) surge serves as a pivotal, non-invasive predictor that ovulation is imminent. Despite the widespread commercial availability of urinary LH tests, a significant challenge persists: the lack of consensus on the optimal LH concentration threshold that reliably predicts ovulation, with manufacturers employing thresholds ranging from 20 to 50 mIU/mL [36] [37]. This variability underscores a critical methodological gap in the field, necessitating a rigorous, evidence-based approach to threshold optimization. This review frames the validation of urine LH tests within the broader thesis of correlating non-invasive urinary biomarkers with serum hormone measures, a relationship fundamental to their clinical utility. We aim to objectively compare the analytical and clinical performance of LH thresholds within the 20-40 mIU/mL range, providing researchers, scientists, and drug development professionals with a synthesis of current evidence, methodological protocols, and key reagents essential for advancing this field.
Comparative Performance of LH Thresholds
The clinical performance of an LH threshold is measured by its ability to correctly classify cycles relative to the actual time of ovulation, typically confirmed by transvaginal ultrasonography. Key metrics include sensitivity, specificity, positive predictive value (PPV), and negative predictive value (NPV). Research indicates that no single threshold is universally perfect; rather, performance is a balance influenced by the chosen cutoff and the clinical context (e.g., predicting ovulation within 24 vs. 48 hours) [36].
Table 1: Performance Metrics of Urinary LH Thresholds for Predicting Ovulation within 24 Hours
| LH Threshold (mIU/mL) | Sensitivity | Specificity | Positive Predictive Value (PPV) | Negative Predictive Value (NPV) | Key Findings |
|---|---|---|---|---|---|
| 20 | Data not specified in results | Data not specified in results | Data not specified in results | Data not specified in results | Lower thresholds may increase false positives as cycle progresses [36] |
| 25 | High (specific values not reported) | High (specific values not reported) | 50-60% | ~98% | Identified as part of the ideal range (25-30 mIU/mL); best predictive value when testing starts earlier in cycle (e.g., day 7) [36] [37] |
| 30 | High (specific values not reported) | High (specific values not reported) | 50-60% | ~98% | Part of the ideal 25-30 mIU/mL range; provides a balance of PPV and NPV [36] [37] |
| 35 | Data not specified in results | Data not specified in results | Data not specified in results | Data not specified in results | Studied as a commercially available threshold, but not in the identified optimal range [36] |
| 40 | Data not specified in results | Data not specified in results | Data not specified in results | Data not specified in results | Used in other models (e.g., IUI timing); may be less optimal for standalone urinary test prediction [38] |
A pivotal observational study that analyzed 283 cycles from 107 women determined that the ideal urinary LH thresholds for predicting ovulation within 24 hours reside in the 25-30 mIU/mL range [36] [37]. This range was found to offer a PPV of 50-60%, an NPV of approximately 98%, and favorable likelihood ratios. The study further concluded that initiating testing earlier in the menstrual cycle (e.g., cycle day 7) enhances the predictive value of the test. It was also noted that relying on consecutive positive tests or attempting to predict ovulation over a longer window (e.g., 48-72 hours) increases the false-positive rate [36].
In contrast, research on LH algorithms for timing intrauterine insemination (IUI), which often relies on serum LH measurements, has explored different thresholds. One retrospective study of 2467 natural cycles developed a dual-threshold model. This model utilized a low threshold of 11 mIU/mL and a high threshold of 40 mIU/mL to guide whether to perform another blood test, schedule IUI for the next day, or perform IUI on the same day [38]. This highlights that the optimal "threshold" can be a dynamic range rather than a single value and is highly dependent on the clinical application and the sample matrix (serum vs. urine).
Key Experimental Protocols in Urinary LH Validation
The validation of urinary LH tests against established gold standards involves meticulously designed experimental protocols. The following section details the core methodologies cited in the comparative performance data.
Protocol for Establishing Urinary LH Thresholds (PMC5712333)
This multicenter study serves as a primary reference for establishing optimal urinary LH thresholds [36] [37].
- Patient Recruitment and Criteria: The study enrolled 107 women aged 19-45 from eight European natural family planning clinics. Participants had regular menstrual cycles (24-34 days) and were excluded for conditions like anovulation, infertility, hormonal treatment, polycystic ovarian syndrome, or recent postpartum/breastfeeding status [36].
- Sample Collection and Hormonal Assessment: Participants collected first-morning urine samples daily. Two 10-12 mL aliquots were frozen at -20°C on the day of collection. Hormonal assessments for LH, FSH, estrone-3-glucuronide (E1G), and pregnanediol-3a-glucuronide (PDG) were performed in a single laboratory using time-resolved fluorometric immunosorbent assays (Delfia) in duplicate [36].
- Gold Standard for Ovulation: Participants underwent serial transvaginal ovarian ultrasounds. Scanning began with the onset of cervical mucus or a detected LH surge and continued every other day until a follicle reached 16 mm, then daily until ultrasound-confirmed ovulation (US-DO) [36].
- Data Analysis and Threshold Determination: A positive test was defined as exceeding a predefined LH threshold. Sensitivity, specificity, PPV, and NPV were calculated for thresholds from 5 to 50 mIU/ml. Receiver operating characteristic (ROC) curves and cost-benefit analyses were used to identify the best thresholds for predicting ovulation within 24, 48, and 72 hours [36].
Protocol for Serum LH-Based Ovulation Prediction Model (PMC11263514)
This study illustrates an alternative approach using serum LH in a clinical treatment context [38].
- Study Design and Population: A retrospective cohort study analyzed 2467 natural cycles from patients undergoing natural cycle frozen embryo transfers. Ovulation day was determined using a previously developed AI model [38].
- LH Measurement and Algorithm Design: Serum LH levels were measured via blood tests. The study tested all possible combinations of low and high LH thresholds (from 1 to 120 mIU/ml) to build a prediction algorithm. The model assigned clinical actions based on whether the serum LH value was below the low threshold, between thresholds, or above the high threshold [38].
- Outcome Evaluation: The algorithm's success was defined as correctly suggesting IUI 1 or 2 days before ovulation (day -1 or -2). An "error" was a suggestion to perform IUI outside this optimal window [38].
Protocol for Analyzing LH Molecular Forms in Urine (PMC9581300)
This exploratory study investigates the complexity of urinary LH immunoreactivity, which has implications for assay design [5].
- Subjects and Sample Collection: Ten healthy women with regular menstrual cycles provided daily morning blood and urine samples for 32 consecutive days. The day of ovulation was determined in reference to the peak serum FSH and LH levels [5].
- Assay Methodology: Serum and urine samples were analyzed using immunofluorometric assays (IFMA). The serum LH assay measured intact LH, while the urinary LH assay measured "total LH immunoreactivity," which includes intact LH, LH beta-subunit (LHβ), and an LHβ core fragment (LHβcf) [5].
- Data Interpretation: The proportion of total urinary LH immunoreactivity to intact serum LH was calculated. This inferred the presence and persistence of LH degradation products in urine after the serum LH surge had subsided [5].
The logical workflow integrating these protocols is summarized below.
Figure 1: Experimental Workflow for Validating Urinary LH Tests. This diagram outlines the core methodologies common to key studies, involving concurrent urine collection, serum sampling, and gold-standard ovulation confirmation to generate data for threshold analysis.
Analytical Considerations and Complexities
Beyond establishing a simple threshold, a deep understanding of analytical factors is crucial for robust test validation and interpretation.
- Molecular Heterogeneity of Urinary LH: Urine contains not only intact LH but also its degradation products, notably the LH beta-core fragment (LHβcf). Research shows that total urinary LH immunoreactivity remains elevated for several days longer than intact LH in serum because these fragments persist [5]. This means a positive urinary test may reflect the LH surge's aftermath rather than its onset, potentially extending the perceived fertile window and complicating the definition of a single "surge." Assays that specifically detect intact LH versus total immunoreactivity will therefore yield different surge profiles and may require different thresholds.
- Impact of Ovarian Response on LH Dynamics: The clinical context can significantly influence optimal LH levels. In assisted reproduction, studies on GnRH antagonist protocols indicate that the degree of LH suppression needed for optimal outcomes varies with a patient's ovarian response. For example, one study recommended different LH suppression thresholds for high responders (2.40–3.69), normal responders (1.29–2.05), and poor responders (0.86–1.35) [39]. This principle underscores that a one-size-fits-all threshold may not be sufficient across all patient populations.
- Synergy with Other Biomarkers: Relying solely on LH has limitations. The combination of a urinary LH test (≥25 mIU/mL) with the observation of peak-fertility type cervical mucus was shown to yield a higher specificity (97-99%) than either marker used alone [36] [37]. Furthermore, an AI model that integrated LH with estradiol and progesterone levels significantly outperformed (93.6% success rate) an LH-threshold-only model (75.4% success rate) in predicting the optimal time for IUI [38]. This strongly suggests that multi-analyte approaches represent the future of precise ovulation prediction.
The relationship between LH, its metabolites, and other hormonal signals is a complex system that can be visualized as follows.
Figure 2: Signaling Pathways and Biomarker Relationships in Ovulation. This diagram shows the endocrine axis governing ovulation and the relationship between serum LH, urinary LH forms, and other key biomarkers used for validation.
The Scientist's Toolkit: Essential Research Reagents and Materials
Table 2: Key Reagents and Materials for Urinary LH Validation Research
| Item | Function in Research | Example from Search Results |
|---|---|---|
| Time-Resolved Fluorometric Immunosorbent Assays (e.g., Delfia) | Quantitative measurement of urinary reproductive hormones (LH, FSH, E1G, PDG) with high sensitivity and precision. | Used for duplicate analysis of daily first-morning urine samples [36] [37]. |
| Immunofluorometric Assays (IFMA) | Distinguishing and measuring different molecular forms of LH (intact, LHβ, LHβcf) in urine and serum. | Used to demonstrate persistent total LH immunoreactivity in urine post-surge [5]. |
| Transvaginal Ultrasound Scanner | The gold-standard method for confirming follicular rupture and the precise day of ovulation (US-DO). | Used for serial monitoring until follicle rupture was observed [36]. |
| Clearblue Advanced Digital Ovulation Test (AOT) | An advanced over-the-counter test that detects a rise in urinary estrogen (E3G) prior to the LH surge. | Used in comparative studies to schedule late follicular phase assessments [40]. |
| Standard Ovulation Test (SOT) | A common over-the-counter test that detects the urinary LH surge. Used as a comparator in performance studies. | Used in studies comparing scheduling accuracy versus advanced tests [40]. |
| Serum Hormone Immunoassays | Quantifying intact LH, FSH, estradiol, and progesterone in serum for correlation with urinary levels. | Used for daily serum hormone level tracking in conjunction with urine tests [38] [5]. |
The optimization of the urinary LH threshold within the 20-40 mIU/mL range is a nuanced process that balances analytical capability with clinical need. The body of evidence synthesized here strongly suggests that a threshold of 25-30 mIU/mL, particularly when testing is initiated by cycle day 7, provides the most robust predictive value for ovulation within 24 hours. However, this single-threshold model represents a starting point, not the culmination of research. The future of precise ovulation prediction lies in embracing complexity: accounting for the molecular heterogeneity of urinary LH, developing dynamic threshold algorithms tailored to individual patient factors, and, most powerfully, integrating LH data with other hormonal biomarkers like estradiol and progesterone. For researchers and drug developers, this underscores the imperative to move beyond standalone LH tests and invest in the development and validation of multi-analyte, algorithm-driven diagnostic solutions that more accurately reflect the sophisticated physiology of the human menstrual cycle.
The validation of urine luteinizing hormone (LH) tests against serum hormone measures represents a critical advancement in reproductive endocrinology, offering a non-invasive alternative for monitoring endocrine function. The reliability of urinary hormone data, however, is fundamentally dependent on specimen collection protocols, which directly impact analytical variability and clinical interpretation. This guide objectively compares two primary urine collection approaches—first-morning void (FMV) and random timed collections—by synthesizing current experimental data and methodological frameworks from clinical studies. The physiological basis for timed collections stems from the pulsatile secretion patterns of gonadotropins, particularly the nocturnal augmentation of LH secretion that occurs during pubertal development and across the menstrual cycle [41] [42]. Understanding the technical performance characteristics of each protocol enables researchers to optimize experimental designs for specific applications in drug development and clinical diagnostics.
Physiological and Analytical Basis for Urine Collection Timing
The timing of urine collection is not merely a logistical consideration but a fundamental methodological factor rooted in endocrine physiology. Luteinizing hormone secretion follows a pulsatile pattern dictated by hypothalamic gonadotropin-releasing hormone (GnRH) release, with notable amplification during nocturnal hours in early puberty and the periovulatory period in menstruating women [43] [42]. First-morning void urine represents the integrated concentration of LH secreted during the preceding nighttime hours, effectively capturing this pulsatile activity without requiring invasive serial blood sampling [41] [4].
From an analytical perspective, urine contains multiple molecular forms of LH immunoreactivity, including intact LH, LH beta-subunit (LHβ), and LH beta-core fragment (LHβcf) [4]. These fragments accumulate in urine and exhibit different clearance patterns, with total urinary LH immunoreactivity (U-LH-ir) remaining elevated longer than serum LH (S-LH) following the LH surge. This extended detection window provides broader coverage of the fertile period in cycle monitoring applications [4]. The composition of these fragments varies throughout the day based on renal processing of pituitary secretions, further justifying standardized collection times.
Table: Molecular Forms of Luteinizing Hormone in Different Biological Matrices
| Biological Matrix | Molecular Forms Present | Key Characteristics |
|---|---|---|
| Serum | Primarily intact LH | Reflects momentary pituitary secretion; requires invasive collection [4] |
| Urine | Intact LH, LH beta-subunit (LHβ), LH beta-core fragment (LHβcf) | Represents integrated secretion and metabolic processing; non-invasive collection [4] |
Direct Comparison of Collection Protocols
The methodological distinction between first-morning void and random timed collections produces significantly different analytical performance characteristics, as quantified through clinical studies across pediatric and reproductive-age populations.
First-Morning Void (FMV) Protocol
The FMV protocol entails collection of the first urine void upon waking after nighttime sleep. This approach is physiologically optimized to capture concentrated urine reflecting integrated nocturnal hormone secretion. Studies demonstrate that FMV collection provides superior correlation with serum LH levels (r=0.64, P<0.0001) compared to random collections [42]. In pediatric populations, FMV U-LH shows a significant increase before the first clinical signs of puberty, serving as an early marker of hypothalamic-pituitary-gonadal axis activation [41] [42].
The day-to-day biological variation of FMV U-LH, quantified as net inter-assay coefficient of variation (CV%), ranges from 21.6% to 32.7% across studies, reflecting intrinsic hormonal pulsatility rather than analytical imprecision [41] [43]. This variation pattern is sex-independent but exhibits higher random fluctuations in adolescents aged ≥13 years [43]. To mitigate this variability, research protocols increasingly incorporate multiple consecutive FMV collections (typically 3 days) to establish a reliable baseline [41] [43].
Random Timed Collection Protocol
Random timed collections involve urine specimen acquisition at any time of day without standardization for fasting or time of day. While this approach offers greater convenience for participants, it introduces substantial analytical variability due to diurnal hormone fluctuations and differences in urine concentration. The same assays applied to random samples show wider confidence intervals in correlative analyses with serum hormone levels [44] [4].
Despite these limitations, random collections remain useful in specific research contexts. For fertility monitoring, some studies indicate that random urine can be used for LH surge detection when first-morning voids are impractical, though with potentially reduced precision in ovulation prediction [44]. The practical advantage of random sampling is the ability to collect specimens in clinic settings without requiring patients to transport samples from home.
Table: Performance Comparison of Urine Collection Protocols for LH Measurement
| Performance Characteristic | First-Morning Void (FMV) | Random Timed Collection |
|---|---|---|
| Correlation with Serum LH | Good (r=0.64) [42] | Reduced correlation due to diurnal variation [4] |
| Day-to-Day Variation (Net CV%) | 21.6%-32.7% [41] [43] | Expected to be higher, though not quantified in studies |
| Detection of Pre-Pubertal Rise | Yes, precedes physical signs [42] | Limited sensitivity for early activation |
| Ovulation Prediction Window | 5-day post-surge detection [4] | Potentially shorter detection window |
| Practical Implementation | Requires at-home collection | Suitable for clinic-based collection |
| Standardization Needs | Multiple samples (≥3 days) recommended [43] | Single samples more common |
Experimental Protocols for Method Validation
Researchers employing urine LH methodologies should adhere to standardized experimental protocols to ensure data quality and cross-study comparability.
Sample Collection and Handling Procedures
For FMV collections, participants should empty their bladder just before bedtime and collect the first void upon waking [41]. Samples should be stored in tubes coated with 0.1% bovine serum albumin (BSA) to prevent adsorption of glycoprotein hormones to container surfaces [41]. During transport, samples must be maintained at +4°C and subsequently stored at -20°C if not analyzed immediately [1]. The use of sodium azide as a preservative (0.1% concentration) is recommended for longer-term storage [1].
For random timed collections, the time of void should be precisely recorded, and participants should avoid excessive fluid intake before collection to prevent urine dilution. Similar storage conditions apply as for FMV specimens.
Hormone Analysis Methods
The technical foundation for urinary LH measurement relies primarily on immunoassay platforms. The DELFIA immunofluorometric assay (IFMA) system has been extensively validated for urinary gonadotropin measurements and can be configured to detect total LH immunoreactivity (intact LH, LHβ, and LHβcf) [41] [4]. More recently, novel smartphone-connected readers like the Inito Fertility Monitor have demonstrated comparable performance to laboratory-based ELISA methods, with average coefficients of variation below 6% for LH, E3G, and PdG measurements [8].
Critical methodological considerations include:
- Assay Specificity: Researchers must determine whether their assay detects intact LH only or total LH immunoreactivity including degradation products [4]
- Urine Concentration Adjustment: While creatinine correction has been traditionally employed, recent evidence suggests it may cause overcorrection in very dilute samples; alternative approaches include using uncorrected values or applying a cohort-based normalization factor [41]
- Sample Dilution: Urine samples may require dilution (typically 1:20) to fall within the assay's linear range [1]
LH Surge Detection Algorithms
Multiple computational approaches exist for determining LH surge onset from urinary hormone profiles. Methodological comparisons identify three primary categories:
- Fixed-Day Method: Uses predetermined cycle days (e.g., days 5-10) for baseline calculation [1]
- Peak-Referenced Method: Determines baseline relative to the identified LH peak day [1]
- Surge-Estimation Method: Employs retrospective surge estimation to identify the optimal baseline period [1]
The most reliable method uses 2 days before the estimated surge day plus the previous 4-5 days for baseline establishment, with surge defined as the first sustained rise exceeding 2.5 times the standard deviation above mean baseline levels [1].
LH Surge Detection Algorithm
Research Reagent Solutions
Table: Essential Research Reagents for Urinary LH Determination
| Reagent/Assay | Function/Application | Key Characteristics |
|---|---|---|
| DELFIA IFMA | Immunofluorometric LH detection | Measures total LH immunoreactivity; CV <6.4% [41] |
| BSA-Coated Tubes | Sample collection and storage | Prevents hormone adsorption to container surfaces [41] |
| Sodium Azide | Urine preservative | Inhibits microbial growth during storage [1] |
| Creatinine Assay | Urine concentration normalization | Alternative correction method for dilute samples [41] |
| Inito Fertility Monitor | Digital urine hormone reader | Provides quantitative E3G, PdG, and LH measurements [8] |
The comparative analysis of urine collection protocols reveals a consistent methodological advantage for first-morning void specimens in research applications requiring precision in LH measurement. The FMV protocol demonstrates superior correlation with serum measures, enhanced sensitivity for detecting early pubertal activation, and optimal capture of integrated nocturnal secretion patterns. Random timed collections, while operationally convenient, introduce greater analytical variability that may compromise data interpretation in longitudinal studies. The validation of urine LH tests against serum standards continues to evolve with technological advancements in immunoassay platforms and computational algorithms for hormone surge detection. Researchers should select collection protocols based on their specific endocrine endpoints, recognizing that FMV collections with appropriate standardization procedures provide the most rigorous approach for quantitative urinary LH determination in both clinical trials and basic endocrine investigations.
The validation of urinary luteinizing hormone (ULH) tests against traditional serum hormone measures represents a significant advancement in clinical endocrinology. While the agreement between urinary and serum reproductive hormone profiles is well-established in normally menstruating women [45], the application of this technology in specialized patient populations requires further examination. This review focuses on two novel applications: confirming ovulation trigger in In-Vitro Fertilization (IVF) cycles and monitoring hormonal suppression in central precocious puberty (CPP). The translation of ULH testing from standard ovulation detection to these complex clinical scenarios demonstrates both its utility and limitations, providing a critical framework for researchers and clinicians considering alternative endocrine monitoring strategies.
Performance Comparison: Quantitative Data Across Applications
The following tables summarize key performance metrics for urinary LH testing in specialized populations, based on recent clinical studies.
Table 1: Performance of Urinary LH Testing in IVF Trigger Confirmation
| Study Parameter | Value | Clinical Context |
|---|---|---|
| False Negative Rate | 15.8% (16/101 cycles) | GnRHa trigger confirmation; negative test but good oocyte retrieval [46] |
| False Positive Rate | 0% (0/85 cycles) | GnRHa trigger confirmation; positive test with successful retrieval [46] |
| Test Sensitivity | 30 mIU/mL | Cut-off value for Akralab SL urine test [46] |
| Optimal Testing Time | ~12 hours post-trigger | Corresponds to LH pharmacodynamics after GnRHa administration [46] |
Table 2: Performance of Urinary LH Testing in Pediatric Endocrinology (CPP)
| Study Parameter | Value | Clinical Context |
|---|---|---|
| Correlation with Serum LH | r = 0.91 | Very strong correlation with stimulated LH levels [47] |
| Diagnostic Cut-off | 1.01 mIU/mL | For inadequate suppression on GnRHa therapy [47] |
| Sensitivity at Cut-off | 92.3% | For identifying inadequate suppression [47] |
| Specificity at Cut-off | 100% | For identifying inadequate suppression [47] |
| Correlation with Basal LH | r = 0.65 | Modest correlation [47] |
Application 1: IVF Trigger Confirmation
Clinical Rationale and Experimental Protocol
In assisted reproductive technology, a bolus of gonadotropin-releasing hormone agonist (GnRHa) is frequently used to trigger final oocyte maturation, particularly in oocyte donation cycles where it minimizes the risk of Ovarian Hyperstimulation Syndrome (OHSS). However, in a small subset of patients, the GnRHa may fail to elicit a sufficient endogenous LH surge, potentially leading to oocyte retrieval failure [46]. Serum LH measurement 12 hours post-trigger has been proposed as a predictive tool, but it is inconvenient for patients.
A prospective observational study evaluated self-detection of the endogenous LH surge using a urine test to confirm a successful GnRHa trigger [46]. The study involved 101 oocyte donation cycles. The experimental protocol was as follows:
- Intervention: A bolus of Triptorelin 0.4mg was administered when >2 follicles >17 mm were observed.
- Urine Testing: Patients performed a urine LH test (Akralab SL, Spain, sensitivity 30 mIU/mL) approximately 12 hours post-trigger using the first morning urine.
- Data Collection: Patients sent a digital picture of the test result to a blinded nurse coordinator.
- Outcome Measure: Oocyte retrieval was performed 36 hours post-trigger, and the number of collected oocytes was compared with the urine test result.
Key Findings and Limitations
The study revealed that while a positive urine test was highly predictive of a successful oocyte retrieval (0% false positive rate), a negative test was poorly predictive of failure. Specifically, 16 donors with a negative LH test subsequently had good oocyte retrieval rates, yielding a false negative rate of 15.8% [46]. This suggests that a negative test should not be used to cancel a scheduled retrieval.
The high false negative rate may be attributed to the test's sensitivity (30 mIU/mL), which is higher than the serum LH cut-off of <15 mIU/mL associated with lower oocyte yield [46]. Furthermore, the GnRHa-induced LH surge has a rapid ascending limb (~4 hours) and a long descending limb (~20 hours) [46]. A single test at 12 hours might miss the peak if the surge timing varies between individuals.
Application 2: Pediatric Endocrinology
Clinical Rationale and Experimental Protocol
The standard treatment for Central Precocious Puberty (CPP) is depot GnRHa. Monitoring treatment efficacy traditionally requires invasive serial blood sampling during an LHRH stimulation test, which is time-consuming, costly, and distressing for children [47]. First-voided urinary LH (FV-ULH) measurement offers a non-invasive alternative that reflects integrated gonadotropin secretion over time.
A prospective study was conducted to determine whether FV-ULH levels could adequately assess pubertal suppression [47]. The methodology was as follows:
- Participants: 68 female patients with CPP or rapidly progressing early puberty receiving monthly GnRHa therapy.
- Sample Collection: First-voided urine samples were collected after overnight urine accumulation. Serum and urinary LH were assayed on the same day using electrochemiluminescence assay (ECLIA).
- Reference Standard: Patients underwent a standard LHRH test. Adequate suppression was defined as a peak stimulated LH ≤ 2 mIU/mL.
- Analysis: The concordance between FV-ULH and stimulated serum LH levels was assessed.
Key Findings and Clinical Validity
The study found an exceptionally strong correlation between FV-ULH and stimulated serum LH levels (r = 0.91) [47]. A FV-ULH cut-off value of 1.01 mIU/mL demonstrated high sensitivity (92.3%) and specificity (100%) for identifying inadequate hormonal suppression [47]. This indicates that FV-ULH is a highly reliable marker for monitoring GnRHa therapy efficacy. The correlation with basal LH levels was weaker (r = 0.65), reinforcing that FV-ULH is a better surrogate for stimulated LH, which is the clinical gold standard.
Diagram 1: FV-ULH Clinical Monitoring Workflow for CPP. ECLIA: Electrochemiluminescence Assay.
Technological Advances & Research Reagents
The evolution of ULH testing platforms is critical to their application in novel clinical settings. Newer quantitative home-use devices represent a significant improvement over traditional qualitative or semi-quantitative lateral flow assays.
Research Reagent Solutions
Table 3: Essential Materials and Reagents for Urinary Hormone Research
| Item | Function/Description | Example in Context |
|---|---|---|
| Electrochemiluminescence Assay (ECLIA) | Highly sensitive platform for measuring urinary LH; essential for low-concentration pediatric applications. | Used in CPP study; min. detectable LH 0.01 IU/L [47]. |
| Quantitative Fertility Monitors (e.g., Mira, Inito) | Smartphone-connected devices that quantify LH, E3G, and PdG; provide numerical hormone values for trend analysis. | Mira monitor used in postpartum/perimenopause validation [6]; Inito monitor validated against ELISA [8]. |
| Immunochromatographic Test Strips | Lateral flow assays for LH detection; format used in simple, rapid, at-home kits. | Akralab SL test strip with 30 mIU/mL sensitivity used in IVF trigger study [46]. |
| ELISA Kits | Laboratory-based gold standard for validating the accuracy of new urinary hormone devices. | Used to validate Inito Fertility Monitor measurements [8]. |
| Agitation-Enhanced Biosensors | Emerging microfluidic technology using agitation to improve mass transport and signal intensity for LH detection. | Prototype sensor with 10-fold signal improvement; LOD of ~1.3 mIU/mL [48]. |
Emerging Sensing Technologies
Emerging technologies promise to overcome the sensitivity limitations of current commercial tests. Recent research has developed an electrochemical biosensor that employs a microfluidic vertical agitation approach, achieving a 10-fold enhancement in the detection signal [48]. This biosensor demonstrated a low detection limit (1.02-1.53 mIU/mL) in the physiologically relevant range of 0–40 mIU/mL and showed no cross-reactivity with human chorionic gonadotropin (hCG) [48], a known confounder in LH assays. Such advances could directly address the high false-negative rate observed in the IVF trigger setting by enabling more sensitive, quantitative point-of-care readings.
Diagram 2: Agitation-Enhanced Biosensor for Quantitative ULH. LOD: Limit of Detection.
The validation and application of urinary LH tests extend well beyond their conventional use in natural cycle ovulation detection. In specialized populations, the performance characteristics of these tests are highly context-dependent. In pediatric CPP, first-voided ULH measurement demonstrates excellent correlation with serum gold-standard tests and high diagnostic accuracy, making it a viable, non-invasive tool for monitoring treatment. Conversely, in confirming an IVF trigger, while a positive urine test is a reliable indicator of a successful LH surge, the current technology suffers from a high false-negative rate, limiting its clinical utility for cycle cancellation decisions. Future directions should focus on integrating more sensitive, quantitative biosensor technologies into clinical practice and exploring the cost-benefit analysis of implementing these novel applications across diverse healthcare settings.
Analytical Challenges and Performance Optimization Strategies
The accurate prediction of ovulation is fundamental to fertility research and practice. Urinary luteinizing hormone (LH) tests, or ovulation predictor kits (OPKs), serve as a critical non-invasive tool for identifying the LH surge that precedes ovulation [36]. Despite their widespread use, a significant challenge persists across the field: the lack of consensus on the optimal urinary LH concentration threshold that reliably predicts ovulation. Manufacturers of these tests employ different thresholds, creating variability that can impact the consistency of research outcomes and clinical interpretations [36]. This guide systematically compares the performance of various LH testing methodologies and thresholds against the gold standard of ultrasound-confirmed ovulation. We synthesize experimental data from multiple peer-reviewed studies to provide researchers, scientists, and drug development professionals with an evidence-based analysis of threshold determination, its implications for predicting the fertile window, and the integration of complementary hormonal markers to enhance predictive validity.
Analytical Comparison of LH Threshold Performance
Table 1: Performance Metrics of Various LH Concentration Thresholds for Predicting Ovulation within 24 Hours (Adapted from Leiva et al.) [36] [49]
| LH Threshold (mIU/mL) | Sensitivity (Se) | Specificity (Sp) | Positive Predictive Value (PPV) | Negative Predictive Value (NPV) | Positive Likelihood Ratio (LR+) |
|---|---|---|---|---|---|
| 15 | 86% | 79% | 40% | 97% | 4.0 |
| 20 | 80% | 91% | 54% | 97% | 8.7 |
| 25 | 71% | 96% | 60% | 98% | 19.2 |
| 30 | 65% | 98% | 60% | 98% | 32.2 |
| 35 | 54% | 99% | 60% | 98% | 53.8 |
| 40 | 46% | 99% | 60% | 97% | 76.7 |
Table 2: Comparison of Home-Use Ovulation Monitoring Systems
| Monitoring System / Test | Hormones Measured | Output Type | Key Features & Research Findings |
|---|---|---|---|
| Standard OPKs (Various) | LH | Binary (Positive/Negative) or Quantitative | Wide variation in built-in thresholds (20-50 mIU/mL) [36]. |
| Clearblue Advanced Digital Ovulation Test | LH, Estrone-3-glucuronide (E3G) | Digital (Low/High/Peak) | Detects estrogen rise before LH surge, providing more warning prior to ovulation [40]. |
| Inito Fertility Monitor | LH, E3G, Pregnanediol glucuronide (PdG) | Quantitative (Numerical values) | Measures full fertile window and confirms ovulation. Validation study showed high correlation with ELISA (CV for LH: 5.57%) [50] [8]. |
| Mira Fertility Monitor | LH, Estrogen, Progesterone, FSH | Quantitative (Numerical values) | Tracks multiple hormones with lab-grade accuracy using fluorescent lateral flow immunoassay [51]. |
| Proov Predict & Confirm Kit | LH, PdG | Binary / Semi-Quantitative | Combines LH surge prediction with post-ovulation PdG testing to confirm ovulation [52]. |
The data in Table 1 reveals a fundamental trade-off in threshold selection. Lower thresholds, such as 15 mIU/mL, yield high sensitivity (86%) but at the cost of lower specificity (79%), leading to a higher rate of false positives. As the threshold increases, specificity improves dramatically. The range of 25-30 mIU/mL represents a pivotal point, achieving a near-perfect negative predictive value (NPV) of 98% and a substantial increase in positive likelihood ratios (LR+ 19.2-32.2) [36] [49]. This indicates that a negative test at this threshold is highly reliable for excluding imminent ovulation, while a positive result is 19 to 32 times more likely to be observed in a cycle where ovulation occurs within 24 hours.
A key finding from the research is that threshold performance is not static but is influenced by the timing of testing within the menstrual cycle. Beginning testing earlier in the cycle (e.g., day 7) with a threshold of 25-30 mIU/mL provides the best predictive value for ovulation within 24 hours [36].
Experimental Protocols for Threshold Validation
Core Study Design and Hormone Assessment
The foundational data on threshold performance, as presented in Table 1, were derived from a specific observational study design [36]. The protocol involved:
- Participants: 107 women contributed a total of 283 ovulatory cycles for analysis.
- Urine Sample Collection: Participants collected daily first morning urine samples for hormonal assessment.
- Hormonal Assays: Thawed urine aliquots were tested in duplicates for quantitative detection of LH (and other hormones) using time-resolved fluorometric immunosorbent assays (Delfia). The intra-assay coefficient of variation (CV) for LH was reported at 7.17% [36].
- Gold-Standard Ovulation Confirmation: Participants underwent serial transvaginal ovarian ultrasounds. Scanning was performed every other day until a follicle reached 16 mm, then daily until ultrasound evidence of ovulation (US-DO) was observed [36].
The definition of a "positive" test was central to the analysis. For a given concentration threshold, a test result above that threshold was considered positive. The sensitivity, specificity, PPV, and NPV were then estimated in relation to the timing of confirmed ovulation (within 24, 48, or 72 hours) [36].
Validation of Novel Monitoring Systems
Subsequent studies have validated newer, quantitative home-based systems using similar rigorous methodologies. For example, the validation of the Inito Fertility Monitor (IFM) involved [50] [8]:
- Accuracy and Precision Testing: The recovery percentage of IFM for measuring E3G, PdG, and LH was evaluated using standard spiked solutions. The assay's precision was determined by calculating the coefficient of variation (CV), which was 5.57% for LH measurement.
- Correlation with ELISA: The correlation between hormone concentrations obtained from IFM and those from laboratory-based ELISA was established using daily first morning urine samples from 100 women.
- Home-Use Assessment: A separate group of 52 women used the IFM device at home to assess its practical performance.
Enhancing Predictive Value with Multi-Hormonal Algorithms
Relying solely on a single LH threshold has limitations, as the LH peak is best described as a wave rather than a single peak, and levels can remain elevated after ovulation [36]. Consequently, research has evolved to focus on multi-hormonal algorithms to improve the accuracy of fertile window prediction and ovulation confirmation.
Combining LH with Estrogen Metabolites: Tests like the Clearblue Advanced Digital Ovulation Test measure both LH and estrone-3-glucuronide (E3G), a urinary metabolite of estrogen. The rise in E3G occurs before the LH surge, allowing the monitor to display a "High Fertility" reading (flashing smiley face) prior to the "Peak Fertility" reading (solid smiley face) triggered by the LH surge [52] [40]. This extends the warning before ovulation from 1-2 days to several days.
Confirming Ovulation with Progesterone Metabolites: A significant limitation of LH-only testing is that it predicts but does not confirm that ovulation has actually occurred. Up to 26-37% of natural cycles can be anovulatory [50] [8]. The measurement of pregnanediol glucuronide (PdG), a urinary metabolite of progesterone, provides post-ovulatory confirmation. Progesterone rises sharply after ovulation, and a sustained elevation of PdG in urine is a reliable indicator that ovulation has taken place [50] [52] [8]. Devices like the Inito Fertility Monitor and kits like Proov integrate PdG measurement to confirm ovulation.
Research by Leiva et al. supports this integrated approach, finding that the combination of peak cervical mucus with a positive LH test (≥25 mIU/ml) provided a higher specificity (97-99%) than either marker alone (77-95% for mucus, 91% for LH) [36].
Diagram 1: Multi-Hormonal Logic for Ovulation Prediction and Confirmation. This workflow illustrates the temporal relationship between estrogen (E3G), luteinizing hormone (LH), and progesterone (PdG) metabolites in a validated model for predicting and confirming ovulation. The diagram highlights how an LH threshold acts as a key predictor, while PdG rise provides essential confirmation.
The Scientist's Toolkit: Essential Research Reagents and Materials
Table 3: Key Research Reagents and Materials for Urinary LH Test Validation
| Item / Solution | Function in Experimental Protocol |
|---|---|
| First Morning Urine Samples | Standardized sample collection to control for diurnal hormone variation; used in both laboratory and home-testing validation studies [36] [50]. |
| Time-Resolved Fluorometric Immunosorbent Assays (e.g., Delfia) | Quantitative detection of LH, E1G, PdG, and FSH in urine samples with high precision; used as a reference method in core studies [36]. |
| Enzyme-Linked Immunosorbent Assay (ELISA) Kits | Laboratory-based quantitative method used for validating the accuracy of home-use monitors (e.g., Inito) by comparing recovered hormone concentrations [50] [8]. |
| Standard Spiked Solutions (LH, E3G, PdG) | Prepared with purified metabolites in urine to determine the recovery percentage, precision (CV), and linearity of novel monitoring systems [50] [8]. |
| Serial Transvaginal Ovarian Ultrasounds | Gold-standard methodology for confirming follicle growth, rupture, and the precise day of ovulation (US-DO) against which LH thresholds are validated [36]. |
Diagram 2: Experimental Workflow for Validating Urinary LH Tests. This diagram outlines the core methodology for validating home-use ovulation tests, involving parallel analysis of urine samples by laboratory reference methods and the device under test, with ovulation confirmation via ultrasound.
The determination of an optimal LH threshold is not a one-size-fits-all endeavor but a strategic choice that balances sensitivity and specificity based on research objectives. The evidence consolidates the 25-30 mIU/mL range as offering a favorable profile for predicting ovulation within 24 hours, characterized by a high negative predictive value and strong positive likelihood ratios [36] [49]. However, the future of precise ovulation monitoring lies in multi-hormonal algorithms that integrate estrogen metabolites for early fertile window detection and progesterone metabolites for retrospective ovulation confirmation [36] [50] [8]. For the research community, this underscores the necessity of transparent reporting of test thresholds by manufacturers and the adoption of validated, quantitative multi-analyte platforms to reduce variability and enhance the reliability of study outcomes related to the female menstrual cycle.
The accurate detection of the luteinizing hormone (LH) surge is critical for pinpointing ovulation in both clinical and research settings. While serum hormone measurement remains the gold standard, urinary LH tests offer non-invasive, convenient alternatives for fertility tracking and research applications. However, these tests face significant challenges related to false negatives that can compromise their reliability. This comprehensive analysis examines the limitations of urinary LH testing through the lens of scientific validation against serum hormone measures, addressing three primary sources of false negatives: problematic timing of test administration, the influence of hydration status on urine concentration, and inherent assay sensitivity limitations. Understanding these factors is essential for researchers designing studies involving ovulation timing and for professionals developing next-generation fertility diagnostics.
Performance Comparison: Urinary vs. Serum Hormone Monitoring
Diagnostic Accuracy and Methodological Limitations
Table 1: Comparison of Ovulation Detection Methods
| Method | Principle | False Negative Sources | Validation Against Serum | Best Use Cases |
|---|---|---|---|---|
| Standard Urinary LH Tests | Detects LH surge in urine (typically >20-25 mIU/mL) | • Brief LH surge window• Dilute urine samples• Sub-threshold LH levels• User interpretation errors | 97% accuracy in detecting ovulation [53], but significant individual variability in LH surge patterns [32] | Population studies with regular cycles where high precision is not critical |
| Advanced Urinary Hormone Monitors | Measures E3G, PdG, and LH simultaneously | • Fluctuations in metabolite levels• Variable hormone metabolism• Device-specific detection thresholds | Strong correlation for LH (R=0.94-0.98) [6], but more fluctuations in E3G compared to serum estradiol [32] | Longitudinal studies tracking complete fertile window and confirming ovulation |
| Serum Hormone Measurement | Direct measurement of E2, P, and LH in blood | • Pulsatile hormone release• Single timepoint sampling may miss surge• Practical limitations for frequent sampling | Gold standard reference method | Protocol validation and studies requiring high temporal precision for hormonal events |
Table 2: Quantitative Performance Metrics of Fertility Monitoring Technologies
| Parameter | Serum Hormones | Mira Monitor | Inito Monitor | ClearBlue AOT |
|---|---|---|---|---|
| LH Detection Correlation | Gold Standard | R=0.83-0.94 with serum [6] | 96% vs. serum for ovulation confirmation [8] | High agreement with laboratory values [40] |
| Estrogen/Estrogen Metabolite | Estradiol (E2) | E3G with significant fluctuations vs. serum [32] | E3G correlated with serum E2 [8] | E3G rise detection before LH surge [40] |
| Progesterone/Progesterone Metabolite | Progesterone (P) | PDG with AUC algorithm signals ovulation transition [32] | PdG confirms ovulation with 100% specificity [8] | Not measured |
| Inter-assay Coefficient of Variation | 5-10% (laboratory dependent) | Not specified | 4.95-5.57% across metabolites [8] | Not specified |
| Fertile Window Prediction | Day -7 to -5 with FIE and E2 [32] | Limited reliability with E3G alone [32] | 6-day fertile window identification [8] | Estrogen rise detection before LH surge [40] |
Key Limitations in Urinary Hormone Monitoring
The comparison between serum and urinary hormone monitoring reveals several critical limitations:
Fluctuation in Metabolite Levels: Urinary hormone metabolites (E3G and PDG) show significantly more fluctuation compared to their serum counterparts (E2 and P), making trend interpretation challenging [32]. This variability contributes to reduced reliability in predicting the start of the fertile window using urinary E3G alone.
Threshold Variability: While serum testing provides quantitative results across the full physiological range, many urinary tests have fixed thresholds (typically 20-25 mIU/mL for LH) that may not capture the natural variation in LH surge levels among individuals [54].
Temporal Displacement: The process of hormone metabolism, liver processing, and renal excretion creates a natural delay between serum hormone changes and their detection in urine, potentially causing minor misalignment in ovulation prediction [55].
Experimental Approaches for Method Validation
Protocol for Direct Serum-Urine Hormone Correlation
Objective: To validate urinary hormone measurements against serum standards throughout the menstrual cycle.
Methodology:
- Participant Recruitment: Naturally cycling women (n=4-100 across studies) with regular cycles, no hormonal contraception, and no known infertility conditions [32] [8].
- Sample Collection: Daily blood samples for serum E2, P, and LH levels throughout complete ovulatory cycles. Simultaneous first-morning urine samples for urinary LH, E3G, and PDG measurement.
- Ovulation Confirmation: Transvaginal ultrasonography performed daily during peri-ovulatory period, with Day 0 defined as first day of dominant follicle collapse [32].
- Hormone Analysis:
- Serum: Chemiluminescence immunoassays for E2, P, and LH
- Urine: Commercial fertility monitors (Mira, Inito, ClearBlue) and laboratory ELISA
- Data Analysis: Cycle day indexing relative to ovulation, correlation analysis between serum and urinary hormones, and receiver operating characteristic (ROC) analysis for ovulation confirmation thresholds [8].
Protocol for Hydration Impact Assessment
Objective: To quantify the effect of hydration status on urinary hormone concentration measurements.
Methodology:
- Participant Preparation: Controlled hydration protocol with specific fluid intake regimens.
- Sample Collection: Paired serum and urine samples at varying hydration states.
- Hormone Measurement: Simultaneous serum LH and urinary LH testing.
- Urine Specific Gravity: Measurement of urine concentration as covariate.
- Data Analysis: Comparison of urinary hormone concentrations across hydration states while serum levels remain constant [56] [55].
Advanced Ovulation Test Comparison Protocol
Objective: To compare the efficacy of standard LH-only tests versus advanced multi-hormone tests.
Methodology:
- Study Design: Randomized comparison of testing methods (n=21 females) [40].
- Intervention Groups:
- Standard Ovulation Test (SOT): LH detection only
- Advanced Ovulation Test (AOT): Estrogen rise detection followed by LH surge detection
- Outcome Measures: Timing of LF visit relative to ovulation, interval between estrogen rise and LH surge detection.
- Statistical Analysis: Linear mixed models for hormone levels, independent t-tests for group comparisons [40].
Figure 1: Hormone Pathways and Detection Limitations. This diagram illustrates the pathway from pituitary LH production to urinary detection, highlighting key points where false negatives can occur.
Timing Issues in Urinary LH Detection
The temporal aspect of LH surge detection represents a fundamental challenge for urinary testing:
Brief Surge Duration: The LH surge typically lasts only 48-72 hours, with peak levels often persisting for less than 24 hours [54]. This narrow detection window means that daily testing can easily miss the surge entirely, particularly in women with rapid LH surges.
Diurnal Variation: LH is typically released later in the day, making afternoon testing (between 10:00 and 20:00) more reliable than first-morning urine collection [54]. This contradicts the standard practice for pregnancy testing and creates confusion among users.
Cycle Variability: In normally cycling women, ovulation occurs approximately 14 days before the next menstrual period, but individual cycle length variations make generalized testing recommendations problematic [57]. Research indicates that only 13% of women have a textbook 28-day cycle [55].
Table 3: Impact of Testing Timing on False Negative Rates
| Testing Protocol | Testing Frequency | Reported False Negative Rate | Key Findings |
|---|---|---|---|
| Once Daily Testing | Single test, morning | 13-29% [54] [57] | Highest miss rate due to brief surge window |
| Once Daily Testing | Single test, afternoon | 7-18% [54] | Improved detection with afternoon testing |
| Twice Daily Testing | 12-hour intervals | <5% [54] | Significant reduction in false negatives |
| Advanced Monitor with Estrogen Rise | Daily until estrogen rise, then twice daily | Additional 2.68 days warning [32] | Permits adaptive testing frequency |
Hydration Effects on Urinary Hormone Concentration
Hydration status significantly impacts urine concentration and consequently hormone detectability:
Urine Dilution Mechanism: Excessive fluid intake before testing dilutes urinary LH concentrations, potentially pushing levels below the detection threshold of standard tests (typically 20-25 mIU/mL) [56] [57].
First-Morning Urine Paradox: While first-morning urine is typically more concentrated and theoretically better for detection, LH surges often begin later in the day, making afternoon testing more reliable despite potentially more dilute urine [54].
Quantitative Impact: Studies demonstrate that urinary hormone values can vary by up to 50% based on hydration status alone, even when serum hormone levels remain constant [55]. This variability directly contributes to false negative results when hormone concentrations hover near the assay's detection threshold.
Assay Sensitivity Limitations
The technological limitations of current urinary LH tests present significant barriers to accurate detection:
Fixed Detection Thresholds: Most commercial tests have predetermined LH thresholds (commonly 20-25 mIU/mL) that may not accommodate the natural biological variation in surge amplitudes, which can range from 6.5 to over 100 mIU/mL [54] [55].
Person-to-Person Variability: Research confirms substantial individual differences in LH surge characteristics, with some women exhibiting low, brief surges that fall below conventional detection limits [54].
Metabolic Variability: The process of hormone metabolism and excretion differs among individuals based on factors including liver function, kidney efficiency, and body composition, creating person-specific relationships between serum and urinary hormone levels [55].
Figure 2: Experimental Workflow for Urine Test Validation. This diagram outlines a comprehensive methodology for validating urinary LH tests against serum standards and ultrasound confirmation.
Research Reagent Solutions for Ovulation Test Validation
Table 4: Essential Materials for Urinary LH Test Validation Research
| Reagent/Equipment | Function in Validation | Specification Requirements | Example Products |
|---|---|---|---|
| LH Reference Standards | Calibration and recovery studies | WHO International Reference Standards | NIBSC code 80/552 |
| ELISA Kits | Laboratory reference method | Sensitivity <0.5 mIU/mL, Cross-reactivity characterization | DRG LH ELISA (EIA-1290), Arbor Assays |
| Urinary Metabolite Standards | E3G and PDG assay validation | >95% purity, Stability documentation | Sigma-Aldrich E2127, P9130 |
| Automated Immunoassay Analyzers | High-precision serum testing | CV <5% at decision thresholds | Roche Cobas, Siemens Advia Centaur |
| Fertility Monitors | Test device evaluation | Quantitative output, Data export capability | Mira Monitor, Inito Fertility Monitor |
| Ultrasound Systems | Ovulation confirmation gold standard | High-frequency transvaginal probe (>7MHz) | Philips EPIQ 7 with saved imaging |
| Sample Collection Supplies | Standardized specimen handling | Barcoded tubes, Consistent volume collection | SARSTEDT urine collection kits |
| Data Analysis Software | Statistical analysis and ROC curves | Mixed models capability, Correlation analysis | R, SPSS, GraphPad Prism |
Discussion and Future Directions
The validation of urinary LH tests against serum hormone measures reveals significant limitations contributing to false negative results. Current research indicates that while urinary tests can reliably detect the LH surge in ideal circumstances, their performance degrades substantially when faced with real-world variables including individual hormonal differences, hydration status, and testing frequency limitations.
Future research should focus on developing adaptive threshold technologies that accommodate individual surge patterns, incorporating multiple hormone parameters to cross-validate ovulation prediction, and establishing personalized testing protocols based on individual cycle characteristics. Additionally, the development of standardized validation protocols incorporating serum measures, ultrasound confirmation, and controlled hydration states will enable more meaningful comparisons between existing and emerging technologies.
For researchers and drug development professionals, these findings highlight the importance of selecting appropriate ovulation detection methods based on study requirements. While urinary tests offer practical advantages for large-scale studies, their limitations must be accounted for in study design and data interpretation. For applications requiring high temporal precision, serum monitoring remains the gold standard, despite its practical limitations.
This guide provides an objective comparison of urinary hormone metabolites, specifically Estrone-3-Glucuronide (E3G) and Pregnanediol-3-Glucuronide (PdG), against their serum hormone counterparts for fertility monitoring and ovulation confirmation. Within the broader thesis of validating urine LH tests against serum measures, we present experimental data demonstrating that while urinary and serum reproductive hormones show excellent agreement overall, significant differences exist in their ability to predict the start of the fertile window. Quantitative data from controlled studies reveal that serum estradiol (E2) outperforms urinary E3G in signaling the beginning of the 6-day fertile window, whereas both serum progesterone and urinary PdG effectively confirm the ovulation/luteal transition when analyzed with appropriate mathematical algorithms.
The validation of urinary luteinizing hormone (LH) tests against serum hormone measures represents a critical methodological foundation for modern fertility tracking. This research framework has naturally extended to other key reproductive biomarkers, particularly estrogen and progesterone metabolites. The fundamental premise is that urinary tests offer non-invasive, home-based monitoring, but require rigorous correlation with serum hormone levels considered the clinical gold standard.
Within this validation paradigm, Estrone-3-Glucuronide (E3G) is the primary urinary metabolite of estradiol (E2), while Pregnanediol-3-Glucuronide (PdG) is the major urinary metabolite of progesterone. Understanding the correlation dynamics between these urinary metabolites and their serum precursors is essential for developing reliable fertility tracking technologies. Research confirms that urinary and serum reproductive hormones generally show excellent agreement and "may be used interchangeably" for tracking cycle events [45]. However, recent studies with advanced mathematical analysis reveal nuanced performance differences, particularly in predicting the initiation of the fertile window versus confirming its conclusion.
Experimental Protocols: Direct Comparison Methodologies
Daily Paired Sampling Protocol with Ultrasound Confirmation
A rigorous 2024 study provides the most direct experimental comparison of serum and urinary biomarkers. The methodology was as follows [58] [32]:
- Subjects & Sampling: Four women with regular cycles provided daily blood samples for serum E2, progesterone (P), and LH levels throughout their entire ovulatory cycles. Three simultaneously used the Mira fertility monitor for daily morning urinary measurements of LH, E3G, and PdG.
- Ovulation Reference Point: All hormone levels were indexed to the first day of dominant follicle collapse observed via transvaginal sonography (defined as Day 0). This established an objective, ultrasound-confirmed ovulation reference, with ovulation occurring in the 24-hour interval between Day -1 (last day of maximum follicle diameter) and Day 0.
- Algorithm Application: Previously described mathematical tools—the Fertility Indicator Equation (FIE) and Area Under the Curve (AUC) algorithm—were tested on both serum and urinary hormone data to identify the start of the fertile window and the ovulation-to-luteal transition point.
Validation Protocol for Quantitative Urinary Hormone Monitors
A 2023 study focused on validating another quantitative home-based fertility monitor (Inito Fertility Monitor) using this protocol [50]:
- Sample Collection: 100 women aged 21-45 provided daily first morning urine samples.
- Laboratory Correlation: The recovery percentage of E3G, PdG, and LH from the monitor was evaluated using standard spiked solutions. The accuracy of measurement was calculated, and the correlation between reproducible values from the device and laboratory-based ELISA was established.
- Precision Metrics: The coefficient of variation (CV) was calculated across multiple measurements to investigate internal device variations.
Results: Performance Data Comparison
Table 1: Comparative Performance of Serum Hormones vs. Urinary Metabolites in Fertility Tracking
| Biomarker Function | Serum Hormone & Performance | Urinary Metabolite & Performance | Supporting Data |
|---|---|---|---|
| Predict Start of 6-Day Fertile Window | Estradiol (E2): Effective. FIE with E2 predicted start on Day -7 (2 cycles) and Day -5 (2 cycles) [58]. | Estrone-3-Glucuronide (E3G): Less Effective. No identifying signal found with E3G using FIE [58]. | Study with 4 women, daily serum & urinary sampling with ultrasound confirmation [58] [32]. |
| Confirm Ovulation / Luteal Transition | Progesterone (P): Effective. The (E2, P) pair with AUC algorithm signaled the Day -1 to Day 0 transition in all cycles [58]. | Pregnanediol-3-Glucuronide (PdG): Effective. The (E3G, PDG) pair with AUC algorithm signaled the Day -1 to Day 0 transition in all cycles [58]. | Study with 4 women, daily serum & urinary sampling with ultrasound confirmation [58] [32]. |
| Agreement with Serum Standards | Gold Standard (Reference) | LH, E3G, PdG: Show excellent agreement with serum hormones. Urinary and serum profiles are highly correlated [45]. | Study of 40 women showing serum and urinary hormones can be used interchangeably [45]. |
| Assay Precision | N/A | Inito Monitor CV: PdG: 5.05%, E3G: 4.95%, LH: 5.57%. High correlation with ELISA results shown [50]. | Validation study of 100 women [50]. |
Key Experimental Findings
- Fluctuation and Signal Clarity: The Mira urinary hormone levels displayed more fluctuations compared to the serum levels, which may contribute to the difficulty in establishing a clear start signal for the fertile window using E3G alone [58].
- Robust Ovulation Confirmation: The combination of estrogen and progesterone metabolites (both serum and urinary) proved robust for confirming the ovulation event. The AUC algorithm successfully identified the precise 24-hour ovulation/luteal transition interval (Day -1 to Day 0) in all cycles for both serum (E2, P) and urinary (E3G, PdG) pairs [58].
- Correlation and Accuracy: The Inito Fertility Monitor validation demonstrated that quantitative urinary hormone monitors can accurately reproduce urinary E3G, PdG, and LH concentrations, with high correlation to laboratory ELISA results and low coefficients of variation, making them suitable for home-based tracking [50].
Signaling Pathways and Hormonal Dynamics
The following diagram illustrates the temporal relationship between serum hormones, their urinary metabolites, and key fertility events during the menstrual cycle.
Experimental Workflow for Validation Studies
The diagram below outlines the standard experimental workflow for studies validating urinary hormone metabolites against serum standards.
The Scientist's Toolkit: Research Reagent Solutions
Table 2: Essential Materials and Reagents for Hormone Validation Studies
| Item | Function / Application | Example from Search Results |
|---|---|---|
| Transvaginal Ultrasound System | Gold-standard confirmation of ovulation timing via visualization of dominant follicle collapse. | Philips EPIQ 7 ultrasound machine [58]. |
| CLIA-Certified Automated Immunoassay System | High-quality, reproducible measurement of serum E2, P, and LH levels. | Abbott Architect ci4100 [58]. |
| Quantitative Urinary Hormone Monitor | At-home, quantitative measurement of urinary E3G, PdG, and LH; data is synced to an app. | Mira Fertility Monitor; Inito Fertility Monitor [58] [50]. |
| Laboratory ELISA Kits | Reference method for quantifying urinary metabolite concentrations in validation studies. | Arbor EIA Kits (E3G, PdG); DRG LH (Urine) ELISA Kit [50]. |
| Algorithm & Analysis Software | Mathematical tools to identify subtle hormone patterns predictive of fertility events. | Fertility Indicator Equation (FIE); Area Under the Curve (AUC) Algorithm [58]. |
The integration of E3G and PdG as complementary urinary biomarkers provides a validated, non-invasive method for comprehensive fertility monitoring. While urinary E3G shows limitations in reliably predicting the very start of the 6-day fertile window compared to serum E2—likely due to fluctuations in urinary levels and metabolic variability—the combination of E3G and PdG is highly effective for detecting the LH surge and confirming ovulation. This validation against serum standards and ultrasound-confirmed ovulation solidifies the role of quantitative urinary hormone monitors in both clinical research and consumer health applications. Future development should focus on refining algorithms to improve E3G-based prediction of the early fertile window.
The accurate prediction of ovulation and identification of the fertile window are foundational to reproductive health, infertility treatment, and conception planning. For decades, the clinical gold standard for hormonal assessment has relied on serum blood tests, which provide a snapshot of hormone levels at a single point in time but are impractical for frequent monitoring [59]. The advent of home-use urinary ovulation predictor kits (OPKs) marked a significant advancement, yet traditional tests have been largely qualitative or semi-quantitative, focusing primarily on luteinizing hormone (LH) and providing limited binary results [8] [36].
This article examines the transformative shift in fertility tracking driven by quantitative digital platforms and multi-hormone monitoring systems. These innovations leverage smartphone-connected readers and advanced immunoassays to provide quantitative, cycle-long hormone profiles from urine. By simultaneously tracking multiple hormones—including estrone-3-glucuronide (E3G), pregnanediol glucuronide (PdG), LH, and follicle-stimulating hormone (FSH)—these systems offer a comprehensive view of the menstrual cycle, enabling more precise fertile window prediction and ovulation confirmation [8] [60]. Framed within the critical context of validating urinary hormone metabolites against serum measures, this analysis explores the technological underpinnings, performance data, and research applications of these integrated diagnostic platforms.
Technological Foundations of Multi-Hormone Monitoring
From Qualitative Strips to Quantitative Digital Readers
Traditional lateral flow immunoassays, while convenient, often suffer from user interpretation errors and provide non-quantitative data. The new generation of systems addresses these limitations through integrated hardware and software.
Core Technological Components:
- Advanced Assay Formats: These systems employ a combination of competitive and sandwich ELISA formats on lateral flow strips. For example, E3G and PdG are typically measured in a competitive format, where the test line intensity decreases with increasing concentration. In contrast, LH is measured in a sandwich format, where test line intensity increases with concentration [8].
- Quantitative Optical Readers: Devices like the Inito Fertility Monitor (IFM) and Mira analyzer use a smartphone camera or a dedicated optical sensor to capture the test strip image. Instead of a visual reading, they quantify the result by measuring the optical density (OD) of the test and control lines [8] [61].
- Smartphone Integration and AI Algorithms: A connected mobile application processes the captured image using multi-scale algorithms to correct for variables like smartphone resolution and lighting. The app calculates hormone concentrations from calibration curves, displays numerical results, and tracks trends over the cycle, often using AI to personalize insights [8] [62].
Key Hormones and Their Clinical Significance
The power of these platforms lies in their multi-parameter approach. The table below details the key hormones measured and their specific roles in cycle mapping.
Table 1: Key Hormones and Metabolites in Multi-Parameter Fertility Monitoring
| Hormone/Metabolite | Serum Correlate | Biological Role in Cycle Tracking | Utility |
|---|---|---|---|
| Luteinizing Hormone (LH) | Serum LH | Triggers ovulation approximately 24-48 hours after its surge [36]. | Predicts imminent ovulation. |
| Estrone-3-glucuronide (E3G) | Serum Estradiol (E2) | A major urinary metabolite of estradiol; its rise indicates follicular development and the opening of the fertile window [8] [60]. | Predicts the start of the fertile window (typically 4-6 days before ovulation). |
| Pregnanediol glucuronide (PdG) | Serum Progesterone (P4) | A urinary metabolite of progesterone; a sustained rise confirms that ovulation has successfully occurred [8] [63] [60]. | Confirms ovulation and assesses luteal phase function. |
| Follicle-Stimulating Hormone (FSH) | Serum FSH | Stimulates follicle growth; elevated baseline levels can indicate diminished ovarian reserve [60]. | Screens for ovarian reserve (e.g., on cycle day 3). |
The following diagram illustrates the typical workflow of these integrated systems, from sample collection to data insight.
Figure 1: Workflow of a Quantitative At-Home Hormone Monitoring System.
Experimental Validation & Performance Comparison
Validation Against Laboratory ELISA and Serum Standards
A critical step in establishing the credibility of these platforms is their validation against established laboratory methods. Independent and manufacturer-led studies have demonstrated strong correlations.
- Validation against Urine ELISA: A 2023 study validating the Inito Fertility Monitor (IFM) reported a high correlation between its measurements of E3G, PdG, and LH and laboratory-based ELISA results. The system showed low assay variability, with average coefficients of variation (CV) of 4.95% for E3G, 5.05% for PdG, and 5.57% for LH [8].
- Correlation with Serum Hormones: Perhaps more significantly, a 2022 study demonstrated that hormone values from the IFM could serve as a proxy for serum concentrations. The research found that urinary E3G, PdG, and LH measurements correlated with serum estradiol (E2), progesterone (P4), and LH with R² values of 0.96, 0.95, and 0.98, respectively. The study concluded that this correlation allows the device to be used for remote monitoring of serum hormone trends [63].
Table 2: Performance Metrics of Select Multi-Hormone Monitoring Systems
| System | Technology | Hormones Measured | Key Validated Performance Metrics | Primary Research/Clinical Advantages |
|---|---|---|---|---|
| Inito Fertility Monitor [8] [63] | Smartphone-based quantitative LFA | E3G, PdG, LH | - CV: <5.6% across hormones- Correlation with serum hormones: R² = 0.95-0.98- Identified a novel PdG-rise criterion for ovulation (AUC 0.98) | High correlation with serum levels enables remote monitoring; confirms ovulation. |
| Mira [61] [59] | Dedicated analyzer with fluorescent LFA | LH, E3G, PdG, FSH (varies by kit) | - Uses lab-grade fluorescent technology- 7x more accurate, 3x more reliable than color-based tests (per mfg.)- Wide detection range for PCOS/irregular cycles | Lab-grade precision; tracks four hormones for a complete cycle map. |
| Proov Complete [60] | Smartphone-based quantitative LFA | FSH, E1G, LH, PdG | - Pilot study: Detected 5.3 fertile days on average- Confirmed ovulation in 38/40 cycles via PdG rise- Identified ovulatory dysfunction in 16/40 women via low PdG | All-in-one cycle mapping (ovarian reserve, fertile window, ovulation confirmation). |
| Oova [62] | Smartphone-based quantitative LFA | LH, E3G, PdG | - 99% lab-accurate correlation (per mfg.)- HIPAA-compliant data sharing with 400+ clinics- Mt. Sinai-developed technology | Focus on clinical integration and real-time data sharing with providers. |
Comparative Effectiveness in Ovulation Detection and Fertile Window Identification
Research directly comparing these systems to traditional methods highlights their enhanced capabilities.
- Superiority to LH-Only Testing: A pivotal study established that the ideal LH threshold for predicting ovulation within 24 hours is 25-30 mIU/ml. However, it also cautioned that LH testing alone is insufficient for defining the end of the fertile window, as LH can remain elevated post-ovulation, and recommended combining LH with other markers like cervical mucus [36]. Multi-hormone systems address this by integrating E3G to open and PdG to close the fertile window.
- Detection of the Full Fertile Window: A pilot study of the Proov Complete system demonstrated its ability to detect an average of 5.3 fertile days—defined as the period from the E3G rise to the PdG rise. Notably, the E3G rise occurred an average of 2.7 days before the LH surge, capturing additional fertile days that would be missed by LH-only tests [60].
- Confirmation of Ovulation and Luteal Function: The same study showed that these systems do more than just predict ovulation; they confirm it. By tracking PdG levels in the luteal phase, Proov Complete identified that while 38 of 40 women ovulated, 16 had suboptimal PdG levels during the implantation window, indicating ovulatory dysfunction [60]. The Inito system also identified a novel criterion involving the PdG rise that distinguished ovulatory from anovulatory cycles with 100% specificity [8].
Essential Research Reagents and Materials
The experimental protocols validated in the cited studies rely on a core set of reagents and materials. The following table details these key components, providing a resource for scientists designing validation or clinical studies in this field.
Table 3: Key Research Reagent Solutions for Hormone Monitoring Validation
| Reagent / Material | Function / Description | Example Use in Validation |
|---|---|---|
| Purified Hormone Metabolites (E3G, PdG, LH) [8] | Used as standards for spiking experiments to create calibration curves and assess accuracy (recovery percentage). | Spiked into male urine with negligible native hormone levels to generate standard curves and perform interference studies [8]. |
| Laboratory ELISA Kits (e.g., Arbor Assays, DRG) [8] | Reference method for quantifying urinary E3G, PdG, and LH concentrations to benchmark the performance of the new platform. | Used to measure the same urine samples tested with the home monitor; results were correlated to establish agreement [8]. |
| Chemiluminescent Immunoassays (e.g., Abbott ARCHITECT) [63] | Gold-standard method for measuring serum hormone levels (E2, P4, LH) to validate the correlation between urinary and serum hormones. | Used to analyze serum blood draws taken concurrently with at-home urine tests to establish the urine-serum correlation [63]. |
| Potential Interfering Substances [8] | Compounds like hCG, acetaminophen, ascorbic acid, caffeine, and albumin are tested to evaluate assay specificity. | Added to test samples to ensure they do not cause false-positive or false-negative results, confirming assay robustness [8]. |
| Lateral Flow Assay Test Strips | The core consumable of the system; contains immobilized antibodies specific to E3G, PdG, and LH in competitive or sandwich formats. | Characterized for sensitivity, specificity, and reproducibility against reference standards before use in clinical studies [8] [60]. |
Discussion and Research Implications
The emergence of quantitative, multi-hormone platforms represents a paradigm shift in reproductive endocrinology, moving from isolated snapshot assessments to continuous, cycle-long hormonal mapping.
The robust validation of these systems against serum standards [63] opens new avenues for remote patient monitoring in clinical trials and fertility treatment. Researchers can now track hormonal response to interventions with a frequency previously impossible outside a clinical setting. Furthermore, the ability to easily confirm ovulation and assess luteal phase sufficiency with PdG [8] [60] provides a practical tool for screening and monitoring conditions like ovulatory dysfunction and luteal phase defect on a large scale.
For the research community, the primary advantages are data density and scalability. These platforms generate rich, longitudinal quantitative datasets on hormone dynamics from a large number of cycles in a real-world setting. This data can fuel discovery, as seen with the identification of novel hormone trends and ovulation confirmation criteria [8]. However, challenges remain, including the need for standardization across platforms and ensuring algorithm transparency.
Future directions should focus on the application of these technologies in diverse populations, including those with conditions like PCOS, and their integration with other biomarkers to create even more comprehensive models of female health.
Comparative Validation Metrics: Analytical Performance Against Reference Methods
The validation of urinary luteinizing hormone (LH) measurements against serum benchmarks represents a critical advancement in reproductive endocrinology. For researchers and drug development professionals, establishing non-invasive methods that maintain analytical rigor is paramount for both clinical applications and field research. The correlation coefficients in the range of R=0.83-0.99 reported in recent studies demonstrate remarkable consistency between these methodologies, supporting the use of urinary LH as a reliable surrogate for serum measurements [8] [5]. This validation is particularly significant given the complex molecular heterogeneity of LH in urine, which includes intact LH, LH beta-subunit (LHβ), and LHβ core fragment (LHβcf) [5]. Understanding these correlations enables more accessible study designs without compromising scientific validity, opening new possibilities for large-scale population studies and personalized fertility tracking technologies.
Comparative Data: Urinary vs. Serum LH Correlation Studies
Table 1: Summary of Key Studies on Correlation Between Urinary and Serum LH Measures
| Study Reference | Subject Population | Methodology | Correlation Coefficient | Key Findings |
|---|---|---|---|---|
| Scientific Reports (2023) [8] | 100 women (21-45 years) with regular cycles | Inito Fertility Monitor (IFM) vs. laboratory ELISA | High correlation reported | Validated quantitative home-based measurement of urinary LH alongside E3G and PdG |
| Frontiers in Endocrinology (2022) [5] | 10 reproductive-aged women with regular cycles | Immunofluorometric assays (IFMA) on daily serum and urine samples | High correlation at similar absolute concentrations | Total urinary LH immunoreactivity remains elevated longer than serum LH |
| Archives of Gynecology and Obstetrics (2015) [1] | 227 women (254 ovulatory cycles) | AutoDELFIA immunoassays on daily first-morning urine | N/A (methodology comparison) | Identified optimal retrospective method for LH surge detection in research datasets |
Table 2: Analytical Performance of Featured Urinary LH Assessment Platform
| Performance Metric | LH Measurement | E3G Measurement | PdG Measurement |
|---|---|---|---|
| Average Coefficient of Variation (CV) | 5.57% | 4.95% | 5.05% |
| Assay Format | Sandwich ELISA | Competitive ELISA | Competitive ELISA |
| Correlation with Reference Methods | High correlation with ELISA [8] | High correlation with ELISA [8] | High correlation with ELISA [8] |
Experimental Protocols in Urinary LH Validation
Protocol 1: Comprehensive Validation of a Novel Smartphone-Connected Reader
A 2023 study published in Scientific Reports detailed a rigorous validation protocol for the Inito Fertility Monitor (IFM), a mobile-connected home-based device [8]. The study recruited 100 women aged 21-45 years with regular menstrual cycles, collecting daily first-morning urine samples throughout their cycles. The analytical validation included:
- Precision Studies: Using spiked male urine samples with target metabolite concentrations to determine coefficient of variation (CV)
- Recovery Percentage Assessment: Evaluating the accuracy of hormone recovery from the IFM system
- Correlation Analysis: Comparing IFM measurements with laboratory-based ELISA results for E3G, PdG, and LH
- Interference Testing: Examining potential cross-reactivity with substances including hCG, progesterone, acetaminophen, ascorbic acid, caffeine, and various pharmaceuticals
The research demonstrated that the IFM accurately measured urinary LH with an average CV of 5.57%, supporting its reliability for quantitative hormone assessment [8].
Protocol 2: Molecular Forms of LH in Serum and Urine
A sophisticated 2022 study in Frontiers in Endocrinology explored the correlation between serum and urinary LH while accounting for molecular heterogeneity [5]. The experimental design involved:
- Subject Cohort: 10 healthy reproductive-aged women with confirmed regular menstrual cycles
- Sample Collection: Daily blood and urine samples collected every morning at 8:00 AM for 32 consecutive days
- Assay Methodology: Immunofluorometric assays (IFMA) utilizing monoclonal antibodies specific to LH subunits
- Molecular Specificity: The serum LH assay measured only intact LH, while the urinary LH assay detected total LH immunoreactivity (intact LH, LHβ, and LHβcf)
- Statistical Analysis: Paired-samples t-test to analyze differences in LH concentrations between urine and serum from the same subjects on the same day
This study revealed that total urinary LH immunoreactivity increased along with the LH surge and remained statistically significantly higher than serum levels for 5 consecutive days after the surge in serum LH [5].
Diagram 1: Metabolic Pathway from Serum LH to Urinary LH Components. This diagram illustrates the pathway from hypothalamic stimulation to the various molecular forms of LH detected in urine, explaining the biochemical basis for correlation studies.
The Scientist's Toolkit: Essential Research Reagents and Materials
Table 3: Key Research Reagent Solutions for Urinary LH Validation Studies
| Reagent/Equipment | Specific Examples | Research Function | Considerations |
|---|---|---|---|
| Immunoassay Systems | AutoDELFIA hLH, ELISA kits (DRG, Arbor) | Quantitative LH measurement in urine and serum | Select assays detecting appropriate LH molecular forms |
| Urine Preservation | Sodium azide, refrigeration/frozen storage | Preserves hormone integrity in urine samples | Maintain consistent storage conditions (-80°C recommended) |
| Reference Standards | WHO International Standards (80/552, 78/549) | Assay calibration and cross-method comparison | Essential for harmonizing results across laboratories |
| Quality Controls | Spiked urine samples at known concentrations | Precision and accuracy monitoring | Should cover entire assay measurement range |
| Home Testing Platforms | Inito Fertility Monitor, ClearBlue Easy Fertility Monitor | Field deployment and real-world validation | Assess correlation with laboratory methods first |
Implications for Research and Drug Development
The strong correlation between urinary and serum LH measurements has transformative implications for study design across multiple domains. For pharmaceutical development, validated urinary LH monitoring enables more practical assessment of therapeutic impacts on ovulatory function in clinical trials, potentially increasing participant compliance and reducing clinic visits. In environmental epidemiology, this correlation facilitates large-scale population studies investigating endocrine disruptors and their effects on reproductive function [64]. The extended detection window for urinary LH immunoreactivity—remaining elevated for several days longer than serum LH—may provide a broader timeframe for detecting ovulatory events in research settings [5]. Furthermore, the integration of urinary LH with other urinary metabolites like pregnanediol glucuronide (PdG) and estrone-3-glucuronide (E3G) enables comprehensive cycle monitoring without serial phlebotomy [8] [65]. As technology advances, novel detection platforms including microfluidic biosensors and smartphone-based readers are emerging, offering enhanced sensitivity and accessibility while maintaining strong correlation with established laboratory methods [8] [48]. These developments collectively support a paradigm shift toward more decentralized, participant-friendly research methodologies without compromising scientific rigor.
In the field of clinical chemistry and biomedical research, the validation of new measurement methods against established standards is a fundamental requirement. For researchers and drug development professionals evaluating diagnostic tests, such as validating urine luteinizing hormone (LH) tests against serum hormone measures, selecting appropriate statistical analyses is crucial for generating scientifically sound and clinically relevant evidence. Two distinct statistical frameworks serve different but complementary purposes in test validation: Bland-Altman analysis assesses agreement between two continuous measurement methods, while predictive values characterize the clinical diagnostic performance of a categorical test. Understanding the application, interpretation, and limitations of each approach ensures that conclusions drawn from validation studies accurately reflect the capabilities of new diagnostic tools.
This guide provides a comparative overview of these methodologies, their implementation, and their specific relevance to hormone assay validation, providing researchers with a structured framework for evaluating method comparability and diagnostic performance.
Bland-Altman Analysis: Assessing Agreement Between Continuous Measurements
Conceptual Foundation and Applications
The Bland-Altman plot, also known as the difference plot, is a statistical method used to assess the agreement between two quantitative measurement techniques that aim to measure the same variable [66] [67]. Unlike correlation, which measures the strength of a relationship between two variables, Bland-Altman analysis specifically quantifies the agreement by examining the differences between paired measurements [67]. This method was popularized in medical statistics by J. Martin Bland and Douglas G. Altman and is now widely used across various fields, including clinical chemistry, radiology, and laboratory medicine [66] [68].
In the context of validating urine LH tests against serum measures (the gold standard), Bland-Altman analysis would be the appropriate technique to determine how well the two methods agree across their measurement range. It is particularly valuable when both methods produce continuous numerical results (e.g., hormone concentration in IU/L), and the researcher needs to understand the magnitude and pattern of discrepancies between them [67] [69].
Methodological Implementation
Construction of the Bland-Altman Plot: The analysis begins with a scatter plot where the Y-axis represents the differences between the two measurement methods (Method A - Method B), and the X-axis represents the average of the two measurements ((Method A + Method B)/2) for each subject [66] [67]. This graphical representation allows researchers to visualize patterns that might indicate systematic bias or changing variability across the measurement range.
Key Calculations: The analysis involves calculating three central reference lines:
- Mean difference (Bias): The average of all differences between paired measurements indicates systematic bias between methods [70] [69].
- Limits of Agreement (LoA): Defined as the mean difference ± 1.96 times the standard deviation of the differences. These limits define the range within which 95% of the differences between the two measurement methods are expected to fall [67] [69].
The formulas for these calculations are:
- Mean difference (d̄) = Σ(Method A - Method B)/n
- Standard deviation of differences (s) = √[Σ(d - d̄)²/(n-1)]
- Upper LoA = d̄ + 1.96 × s
- Lower LoA = d̄ - 1.96 × s
Table 1: Key Components of Bland-Altman Analysis
| Component | Calculation | Interpretation |
|---|---|---|
| Mean Difference (Bias) | Average of (Method A - Method B) | Systematic difference between methods; positive value indicates Method A > Method B |
| Limits of Agreement | Mean difference ± 1.96 × SD of differences | Range containing ~95% of differences between methods |
| 95% Confidence Intervals | Calculated for mean difference and limits of agreement | Precision of the estimates; narrower with larger sample sizes |
Interpretation Guidelines
Interpreting a Bland-Altman plot involves assessing several key elements [70] [69]:
- Magnitude of Bias: The clinical relevance of the average difference between methods must be evaluated. A bias significantly different from zero indicates a consistent overestimation or underestimation by one method.
- Width of Limits of Agreement: The range between the upper and lower limits of agreement indicates the expected variability between methods. Wider limits suggest poorer agreement.
- Patterns in the Plot: The distribution of points should be randomly scattered around the mean difference line without apparent trends. If differences increase or decrease as the magnitude of measurement increases (proportional bias), the assumption of constant variability may be violated.
- Outliers: Points falling far outside the limits of agreement may represent measurement errors or special cases requiring investigation.
For method comparison studies, such as comparing urine to serum LH measurements, the limits of agreement must be compared to a pre-defined clinical acceptability threshold [67] [69]. This threshold represents the maximum difference that would be clinically irrelevant, based on biological variation or clinical requirements.
Experimental Design Considerations
Sample Size Requirements: Determining an adequate sample size is critical for reliable Bland-Altman analysis. Historically, sample size recommendations were informal, but more rigorous approaches have been developed [66] [71]. Lu et al. (2016) introduced a statistical framework that explicitly controls Type I and Type II error, typically targeting 80% power [66] [71]. MedCalc software implements this method, requiring researchers to specify:
- Type I error (α, typically 0.05)
- Type II error (β, typically 0.20 for 80% power)
- Expected mean of differences
- Expected standard deviation of differences
- Maximum allowed difference between methods (clinical agreement limit)
For example, if preliminary data show a mean difference of 0.001167 with standard deviation of 0.001129, and the clinical agreement limit is 0.004, a sample size of 83 would be required for α=0.05 and β=0.20 [71].
Addressing Violations of Assumptions: The standard Bland-Altman approach assumes normally distributed differences and consistent variability (homoscedasticity). When these assumptions are violated, variations can be employed [66] [69]:
- Log Transformation: Useful when variability increases with measurement magnitude (heteroscedasticity) or when assessing ratio agreement rather than absolute differences.
- Percentage Differences: Expressing differences as percentages of the average measurement when relative rather than absolute differences are more relevant.
- Regression-Based Limits: Modeling the limits of agreement as functions of measurement magnitude when proportional bias is present.
Diagram 1: Bland-Altman Analysis Workflow. This diagram illustrates the sequential process for conducting and interpreting a Bland-Altman analysis, from data collection to final conclusions about method agreement.
Predictive Values: Evaluating Diagnostic Test Performance
Conceptual Foundation and Applications
Positive Predictive Value (PPV) and Negative Predictive Value (NPV) are statistical measures that quantify the clinical diagnostic performance of a test by indicating the probability that a positive or negative test result correctly identifies the presence or absence of a condition [72] [73]. Unlike sensitivity and specificity, which are characteristics of the test itself, predictive values are influenced by the prevalence of the condition in the population being tested [72] [74].
In the context of validating a urine LH test against serum measures, predictive values would answer clinically relevant questions such as: "If a woman's urine LH test is positive (suggesting an LH surge), what is the probability that her serum LH level (gold standard) is truly elevated?" This framework is particularly useful when test results are categorical (positive/negative) rather than continuous.
Calculation and Interpretation
Fundamental Formulas: Predictive values are derived from a 2×2 contingency table comparing a new test against a gold standard:
Table 2: Calculation of Predictive Values from a 2×2 Contingency Table
| Gold Standard Positive | Gold Standard Negative | ||
|---|---|---|---|
| Test Positive | True Positive (TP) | False Positive (FP) | PPV = TP/(TP+FP) |
| Test Negative | False Negative (FN) | True Negative (TN) | NPV = TN/(TN+FN) |
The formulas for calculating predictive values are:
- Positive Predictive Value (PPV) = True Positives / (True Positives + False Positives)
- Negative Predictive Value (NPV) = True Negatives / (True Negatives + False Negatives) [72] [73]
Predictive values can also be calculated using sensitivity, specificity, and prevalence:
- PPV = (Sensitivity × Prevalence) / [(Sensitivity × Prevalence) + (1 - Specificity) × (1 - Prevalence)]
- NPV = [Specificity × (1 - Prevalence)] / [(Specificity × (1 - Prevalence)) + ((1 - Sensitivity) × Prevalence)] [72]
Clinical Interpretation:
- A PPV of 90% means that 90% of patients with a positive test result truly have the condition.
- An NPV of 90% means that 90% of patients with a negative test result truly do not have the condition [75].
The Critical Role of Prevalence
The distinctive feature of predictive values is their dependence on disease prevalence in the tested population [72] [74] [75]. This relationship has profound implications for test interpretation:
- As prevalence decreases, PPV decreases while NPV increases
- As prevalence increases, PPV increases while NPV decreases
Table 3: Example of How Prevalence Affects Predictive Values (Assuming 90% Sensitivity and Specificity)
| Prevalence | PPV | NPV |
|---|---|---|
| 1% | 8.3% | 99.9% |
| 10% | 50% | 99% |
| 20% | 69.2% | 97.2% |
| 50% | 90% | 90% |
This prevalence dependence explains why the same diagnostic test performs differently in various clinical settings. A urine LH test might have high PPV in a fertility clinic population (high prevalence of peri-ovulatory LH surges) but much lower PPV in a general population screening context (lower prevalence of testing during the precise LH surge window) [74] [75].
Experimental Design for Predictive Value Studies
Study Design Considerations: When designing a study to evaluate predictive values of a urine LH test compared to serum testing:
- Clear Dichotomization: Establish definitive cut-off values to categorize continuous hormone measurements as "positive" or "negative" for LH surge.
- Gold Standard Reference: Use serum LH measurement as the reference standard, acknowledging its own limitations.
- Population Selection: Include a representative spectrum of patients (various ages, cycles, fertility status) to ensure generalizable results.
- Blinding: Ensure that interpreters of both urine and serum tests are blinded to the other method's results to prevent bias.
Sample Size Requirements: Sample size calculation for predictive value studies depends on:
- Expected sensitivity and specificity of the test
- Desired precision (width of confidence intervals)
- Expected prevalence of the condition
- Required statistical power
Larger sample sizes are needed for conditions with low prevalence to obtain precise estimates of PPV, as false positives can substantially impact the PPV calculation when prevalence is low.
Diagram 2: Relationship Between Prevalence, Test Characteristics, and Predictive Values. This diagram illustrates how disease prevalence and intrinsic test characteristics (sensitivity and specificity) jointly determine the positive and negative predictive values of a diagnostic test.
Comparative Analysis: Application to LH Test Validation
Side-by-Side Methodology Comparison
Table 4: Direct Comparison of Bland-Altman Analysis vs. Predictive Values for LH Test Validation
| Characteristic | Bland-Altman Analysis | Predictive Values |
|---|---|---|
| Data Type | Continuous measurements | Dichotomous (positive/negative) outcomes |
| Primary Question | "How well do the two methods agree across their measurement range?" | "How reliable is a positive or negative test result in predicting the true condition?" |
| Key Outputs | Mean difference (bias), limits of agreement | PPV, NPV |
| Dependence on Prevalence | Independent | Highly dependent |
| Application in LH Test Validation | Compare quantitative urine vs. serum LH concentrations | Evaluate clinical utility of a positive/negative urine LH test for detecting serum LH surge |
| Sample Size Considerations | 80-100+ pairs for reliable limits of agreement [71] | Depends on prevalence; larger samples needed for rare conditions |
| Strengths | Quantifies magnitude and pattern of disagreement; identifies systematic and proportional biases | Direct clinical relevance; answers patient-specific questions about test results |
| Limitations | Does not directly address clinical decision thresholds | Requires arbitrary dichotomization of continuous measures; values population-specific |
Complementary Use in Comprehensive Test Validation
A robust validation of urine LH tests against serum measures would typically incorporate both analytical approaches at different stages:
Initial Method Comparison: Use Bland-Altman analysis to assess the quantitative agreement between urine and serum LH concentrations across their measurable range. This helps identify systematic biases and determine whether urine measurements consistently underestimate or overestimate serum levels.
Clinical Performance Evaluation: Once a clinically relevant threshold for "LH surge" is established, calculate predictive values to understand how well a positive urine test predicts a serum-defined LH surge. This provides directly actionable information for clinical use.
Population-Specific Validation: Since predictive values vary with prevalence, consider evaluating performance across subpopulations with different pre-test probabilities of being in their peri-ovulatory phase.
Essential Research Reagents and Materials
Table 5: Key Research Reagent Solutions for LH Test Validation Studies
| Reagent/Material | Function in Validation Study |
|---|---|
| Reference Standard Serum LH Assay | Gold standard measurement (e.g., immunofluorometric or chemiluminescent assay) for establishing "true" LH status |
| Urine LH Test Kits | Investigational device; multiple lots should be tested to assess variability |
| Quality Control Materials | Both urine and serum matrices with known LH concentrations to monitor assay performance |
| Calibrators | Standardized reference materials for establishing calibration curves |
| Sample Collection Tubes | Appropriate containers for serum and urine specimens to maintain analyte stability |
| Matrix Effects Reagents | Additives to evaluate potential interference in urine compared to serum |
| Data Analysis Software | Statistical packages capable of Bland-Altman analysis and diagnostic test evaluation (e.g., MedCalc, R) |
The choice between Bland-Altman analysis and predictive values for validating urine LH tests against serum measures depends fundamentally on the research question and data type. Bland-Altman analysis is the appropriate technique for assessing the quantitative agreement between continuous measurements, identifying systematic biases, and understanding the magnitude of disagreement across the measurement range. In contrast, predictive values provide clinically relevant information about the diagnostic performance of a dichotomized test, answering how likely a positive or negative urine test result is to correctly identify the serum-defined LH surge.
A comprehensive validation strategy for urine LH tests should recognize that these are complementary rather than competing approaches. Bland-Altman analysis establishes the fundamental measurement agreement, while predictive values translate this agreement into clinically actionable information. Both methodologies provide essential but distinct insights into test performance, enabling researchers and drug development professionals to make evidence-based decisions about the validity and appropriate application of new diagnostic tools in clinical practice and research settings.
The accurate prediction and confirmation of ovulation are critical in reproductive health, fertility treatment, and drug development studies. For decades, luteinizing hormone (LH) detection in urine has served as a cornerstone for ovulation prediction. However, the landscape of commercially available ovulation testing devices has evolved significantly, now incorporating multiple hormones and advanced digital readouts. This presents both opportunities and challenges for researchers and clinicians who require validated, reliable tools for scientific and clinical applications.
This guide provides an objective comparison of four commercial ovulation testing devices—Clearblue, Mira, Premom, and Inito—with a specific focus on published validation data against established laboratory methods. The analysis emphasizes experimental protocols, quantitative performance metrics, and device suitability for research applications.
The following table summarizes the core characteristics and technological approaches of the devices examined.
Table 1: Commercial Ovulation Test Device Specifications
| Device | Hormones Measured | Technology/Readout | Key Claimed Advantage |
|---|---|---|---|
| Clearblue Advanced Digital | LH, Estrone-3-glucuronide (E3G) | Optical intensity; Qualitative Digital Result ("Low," "High," "Peak") | Identifies up to 4 fertile days prior to ovulation [76] |
| Mira Monitor | LH, E3G, Pregnanediol glucuronide (PdG) | Fluorescence Immunoassay; Quantitative Numerical Values (mIU/mL) | "Lab-at-home" providing numerical hormone concentrations [77] |
| Inito Fertility Monitor | LH, E3G, PdG, FSH | Smartphone Image Analysis; Quantitative Values & Qualitative Fertility Status | Measures 4 hormones on a single strip; confirms ovulation [8] |
| Premom | LH | Line-based Lateral Flow Assay; Semi-Quantitative via App | Uses app to analyze test line intensity against control line |
Independent and manufacturer-led studies have evaluated the analytical and clinical performance of these devices. The findings are summarized in the table below.
Table 2: Summary of Key Validation Findings
| Device | Correlation with Reference Method | Key Performance Metrics | Study Context & Limitations |
|---|---|---|---|
| Clearblue Fertility Monitor (CBFM) | Strong correlation (R=0.83-0.94) with Mira LH surge for ovulation day identification [6]. Validated against serum hormones and ultrasound [6]. | N/A | Study focused on postpartum and perimenopause populations [6]. |
| Mira Monitor | LH surge strongly correlated with CBFM (R=0.83-0.94, p<0.001) in postpartum and perimenopausal cycles [6]. E3G and LH levels significantly aligned with CBFM "High" and "Peak" readings (p<0.001) [6]. | Uses an LH threshold of >11 mIU/mL to define surge [6]. | Comparison was against another consumer device (CBFM), not direct serum correlation [6]. |
| Inito Fertility Monitor | High correlation with laboratory ELISA for urinary E3G, PdG, and LH [8]. A separate study found urine metabolite measurements correlated with serum hormones [8]. | Average CV: E3G (4.95%), PdG (5.05%), LH (5.57%) [8]. 100% specificity for a novel ovulation confirmation criterion (AUC=0.98) [8]. | Manufacturer-sponsored study [8]. |
| Premom | No specific validation data was identified in the searched literature. | Information not available in searched sources. | Validation data against gold standards is lacking in the reviewed results. |
Analysis of Validation Findings
The available data reveals a tiered validation landscape. Inito has published data in a peer-reviewed journal showing strong analytical agreement with ELISA, providing confidence in its quantitative accuracy [8]. Mira has been validated against another consumer monitor (CBFM) in specific physiological transitions, showing excellent agreement in LH surge detection, though direct correlation to serum is not detailed in the results provided [6]. The Clearblue system is established in the literature, with citations noting its prior validation against serum and ultrasound [6]. For Premom, the search results did not yield independent or manufacturer-led validation studies against gold-standard methods, indicating a significant gap in the public scientific record.
Detailed Experimental Protocols
Understanding the methodology of validation studies is crucial for assessing their rigor.
Protocol: Validation of Quantitative Hormone Monitors (e.g., Inito, Mira)
- Objective: To evaluate the accuracy and precision of a quantitative at-home hormone monitor compared to laboratory-based ELISA.
- Sample Collection: First-morning urine samples are collected daily from participants (e.g., women aged 21-45 with regular cycles) throughout one or more menstrual cycles [8].
- Testing Procedure:
- Each sample is tested with the commercial device following manufacturer instructions (e.g., dipping strip for 15 seconds, inserting into reader) [77] [8].
- The same sample is aliquoted and frozen for subsequent batch analysis with laboratory ELISA kits.
- For precision, standard solutions with known hormone concentrations are tested repeatedly with the device to calculate intra-assay Coefficient of Variation (CV) [8].
- Data Analysis:
- Correlation: Hormone concentrations obtained from the device are plotted against ELISA results, and a correlation coefficient (e.g., R-value) is calculated [8].
- Accuracy (Recovery %): The percentage of a known, spiked hormone concentration that is accurately measured by the device [8].
- Precision (CV %): The variation in repeated measurements of the same sample [8].
Protocol: Comparison of Ovulation Prediction Performance
- Objective: To compare the day of ovulation identified by two different ovulation testing devices.
- Participants: Specific populations, such as postpartum or perimenopausal women, can be recruited [6].
- Testing Procedure: Participants use two different ovulation tests (e.g., Mira and Clearblue Fertility Monitor) concurrently throughout their cycle, following instructions for each [6].
- Outcome Measures:
- The day of the LH surge is identified for each device (e.g., first "Peak" day for CBFM, highest LH over a threshold for Mira) [6].
- Bland-Altman Analysis: A statistical method used to assess the agreement between the two assays for determining the ovulation day. This plots the difference between the two measures against their mean and identifies any systematic bias [6].
Signaling Pathways and Workflows
Hormonal Signaling Pathway in Ovulation
The hypothalamic-pituitary-ovarian (HPO) axis regulates the menstrual cycle. Urinary hormone tests measure metabolites of these hormones to infer systemic activity.
Diagram Title: Hormone Pathway to Urinary Biomarkers
Experimental Validation Workflow
A typical protocol for validating a commercial device against a gold standard involves parallel testing and statistical comparison.
Diagram Title: Device Validation Study Flow
The Scientist's Toolkit: Research Reagent Solutions
For researchers designing validation studies or interpreting data from commercial devices, the following reagents and materials are essential.
Table 3: Essential Reagents for Ovulation Test Validation Research
| Reagent/Material | Function in Validation | Example in Context |
|---|---|---|
| First Morning Urine (FMU) Samples | Primary test matrix; contains concentrated hormone metabolites. | Used as the core sample for testing both the commercial device and the reference method [8]. |
| ELISA Kits | Gold-standard reference method for quantifying specific hormone concentrations in urine. | Used to validate the quantitative results of devices like Inito and Mira (e.g., Arbor Assays kits for E3G and PdG) [8]. |
| Standard Solutions (Spiked Metabolites) | Used for precision and recovery studies to determine assay accuracy and coefficient of variation (CV). | Spiked male urine with purified E3G, PdG, and LH from Sigma-Aldrich to characterize Inito monitor performance [8]. |
| Luteinizing Hormone (LH) | The primary target for predicting the imminent onset of ovulation. | Studies determine the ideal urinary LH threshold for ovulation prediction (e.g., 25-30 mIU/mL) [36]. |
| Transvaginal Ultrasound | Clinical gold standard for visually confirming follicle rupture and ovulation. | Cited as a gold standard against which devices like the Clearblue Fertility Monitor have been validated [6]. |
Conclusion
Validation of urinary LH tests against serum measures demonstrates strong correlation for ovulation prediction, with optimal thresholds identified between 25-30 mIU/mL providing the best balance of sensitivity and specificity. Current evidence supports urinary LH testing as a reliable non-invasive alternative to serum monitoring in most clinical and research scenarios, particularly when accounting for the extended detection window provided by LH metabolites. Future research should prioritize standardization of threshold reporting across manufacturers, development of multi-hormone algorithms incorporating E3G and PdG for enhanced fertility window detection, and exploration of urinary gonadotropin applications in specialized populations including pediatric endocrinology and assisted reproduction. The integration of quantitative digital platforms represents a promising direction for improving accessibility and precision in fertility monitoring and clinical research applications.
References
- 1. Comparison between the different methods developed for ... [https://link.springer.com/article/10.1007/s00404-015-3732-z]
- 2. Prediction of ovulation: new insight into an old challenge [https://www.nature.com/articles/s41598-023-47241-2]
- 3. Identification of the LH surge by measuring intact and total ... [https://pmc.ncbi.nlm.nih.gov/articles/PMC9464748/]
- 4. Quantification of urinary total luteinizing hormone ... [https://www.frontiersin.org/journals/endocrinology/articles/10.3389/fendo.2022.903831/full]
- 5. Quantification of urinary total luteinizing hormone ... [https://pmc.ncbi.nlm.nih.gov/articles/PMC9581300/]
- 6. Validating At-Home Urinary Hormone Measurements in ... [https://pmc.ncbi.nlm.nih.gov/articles/PMC12040536/]
- 7. Self-Detection of the LH Surge in Urine After GnRH Agonist ... [https://www.frontiersin.org/journals/endocrinology/articles/10.3389/fendo.2020.00221/full]
- 8. Validation of urinary reproductive hormone measurements ... [https://www.nature.com/articles/s41598-023-36539-w]
- 9. Characteristics of the urinary luteinizing hormone surge in ... [https://www.sciencedirect.com/science/article/pii/S0015028207001604]
- 10. Analysis of Commercial Immunoassays for the... Comparative [https://pmc.ncbi.nlm.nih.gov/articles/PMC11484739/]
- 11. Identification of the LH surge by measuring intact and total... [https://link.springer.com/article/10.1007/s42000-022-00368-9]
- 12. Test Code LH Luteinizing Hormone [https://uchicagomedlabs.testcatalog.org/show/LH-1]
- 13. Luteinizing hormone (LH) test: Uses, ranges, and results [https://www.medicalnewstoday.com/articles/324122]
- 14. Luteinizing Hormone (LH) Blood Test: Procedure and Results [https://www.healthline.com/health/lh-blood-test]
- 15. The expression of the urinary forms of human luteinizing ... [https://pubmed.ncbi.nlm.nih.gov/9619532/]
- 16. Detecting LH Surge: Timing Peak Fertility with OPKs [https://rmanetwork.com/blog/lh-surge-when-detect-peak-fertility-opk/]
- 17. LH Surge for Fertility: Length, Testing, and Timing [https://www.healthline.com/health/pregnancy/lh-surge]
- 18. How Long After an LH Surge Do You Ovulate? (TTC Guide) [https://shop.miracare.com/blogs/resources/how-long-after-your-lh-surge-do-you-ovulate?srsltid=AfmBOoqiEZoys9mw7ZroLZtedyFoFdl5bY43OHAAhHgJ0l_BP-UMAH0H]
- 19. The accuracy of urinary luteinizing hormone testing in ... [https://pubmed.ncbi.nlm.nih.gov/2660566/]
- 20. How Long Does LH Stay Elevated After Ovulation? Tracking ... [https://www.hormona.io/blog/blog-how-long-does-lh-stay-elevated-after-ovulation/]
- 21. Comparison of several one-step home urinary luteinizing ... [https://www.sciencedirect.com/science/article/pii/S0015028201018817]
- 22. Luteinizing Hormone (LH) Levels Test [https://medlineplus.gov/lab-tests/luteinizing-hormone-lh-levels-test/]
- 23. Urine Tests vs Blood Tests for Hormone Analysis [https://shop.miracare.com/blogs/resources/urine-tests-vs-blood-tests?srsltid=AfmBOoqlU72iertTOpJcgDX6OCgM5BiaEG3Yo10Y31A6H8UtiJ7V-qa2]
- 24. Comparison of Day-Specific Serum LH, Estradiol, and ... [https://pubmed.ncbi.nlm.nih.gov/39202489/]
- 25. Reliability of urinary LH testing for planning of endometrial ... [https://pubmed.ncbi.nlm.nih.gov/1563561/]
- 26. Postmortem tissue biomarkers of menopausal transition [https://www.nature.com/articles/s41380-025-03177-9]
- 27. Postmortem tissue biomarkers of menopausal transition - PMC [https://pmc.ncbi.nlm.nih.gov/articles/PMC11230159/]
- 28. Timing is crucial: Some critical thoughts on using LH tests ... [https://www.sciencedirect.com/science/article/abs/pii/S0018506X18301661]
- 29. Luteinizing Hormone: Levels, Function & Testing [https://my.clevelandclinic.org/health/body/22255-luteinizing-hormone]
- 30. Evaluation of a simple and fast self-test for urine luteinizing ... [https://www.sciencedirect.com/science/article/pii/S0015028216535195]
- 31. Development of a rapid and sensitive magnetic ... [https://www.sciencedirect.com/science/article/abs/pii/S0009912009002719]
- 32. Comparison of Day-Specific Serum LH, Estradiol, and ... [https://www.mdpi.com/1648-9144/60/8/1207]
- 33. The Ultrasensitive Luteinizing Hormone (LH) ELISA Gets a ... [https://pmc.ncbi.nlm.nih.gov/articles/PMC9419681/]
- 34. Analytical and clinical performance of a fluorescence ... [https://pmc.ncbi.nlm.nih.gov/articles/PMC9597340/]
- 35. Serum LH levels before progesterone administration ... [https://ovarianresearch.biomedcentral.com/articles/10.1186/s13048-025-01743-x]
- 36. Urinary Luteinizing Hormone Tests: Which Concentration ... [https://pmc.ncbi.nlm.nih.gov/articles/PMC5712333/]
- 37. Urinary Luteinizing Hormone Tests: Which Concentration ... [https://www.frontiersin.org/journals/public-health/articles/10.3389/fpubh.2017.00320/full]
- 38. Intrauterine insemination timing models—LH can only take ... [https://pmc.ncbi.nlm.nih.gov/articles/PMC11263514/]
- 39. Ovarian response determines the luteinizing hormone ... [https://www.sciencedirect.com/science/article/pii/S2405844023111418]
- 40. Comparison of two ovulation tests to predict timing of the ... [https://pmc.ncbi.nlm.nih.gov/articles/PMC12012743/]
- 41. Moderate Day‐To‐Day Variation in First‐Morning Urine Total ... [https://pmc.ncbi.nlm.nih.gov/articles/PMC11962348/]
- 42. Increase in first morning voided urinary luteinizing ... [https://pubmed.ncbi.nlm.nih.gov/8768859/]
- 43. Urine Sampling Protocol Recommendations for Reliable ... [https://www.mdpi.com/2227-9067/10/12/1919]
- 44. Urine for LH monitoring can be collected at any time of day ... [https://www.droracle.ai/articles/259491/is-morning-urine-collection-necessary-for-monitoring-luteinizing-hormone]
- 45. Comparison of urinary and serum reproductive hormones ... [https://pubmed.ncbi.nlm.nih.gov/26018113/]
- 46. Exploring self-detection of the endogenous LH surge using ... [https://pmc.ncbi.nlm.nih.gov/articles/PMC10712820/]
- 47. Diagnostic value of urinary luteinizing hormone levels in the ... [https://pmc.ncbi.nlm.nih.gov/articles/PMC10118943/]
- 48. Quantitative detection of pre-ovulatory luteinizing hormone ... [https://www.sciencedirect.com/science/article/pii/S0039914024009469]
- 49. Which Concentration Threshold Best Predicts Ovulation? [https://www.frontiersin.org/journals/public-health/articles/10.3389/fpubh.2018.00345/full]
- 50. of Validation reproductive urinary using... hormone measurements [https://pmc.ncbi.nlm.nih.gov/articles/PMC10247788/]
- 51. 101: Hormone Blood Testing for Urine ... Tests vs Tests Hormone [https://shop.miracare.com/blogs/resources/urine-tests-vs-blood-tests]
- 52. The 5 best ovulation tests for help determining peak fertility [https://www.ccrmivf.com/news/5-best-ovulation-tests-for-help-determining-peak-fertility-march-16-2021/]
- 53. Evaluation of ovulation by urinary LH surge kits versus ... [https://ijogr.org/archive/volume/11/issue/3/article/13695]
- 54. Negative Ovulation Test | Causes and What to Do [https://fertilitymadrid.com/en/blog/negative-ovulation-test-everything-you-need-to-know-4/]
- 55. Blood vs Urine Hormone Test for Fertility [https://blog.inito.com/urine-vs-blood-tests/]
- 56. Can Dehydration Cause False Negative Pregnancy Test? ... [https://mommed.com/blogs/breastfeeding-pregnancy/can-dehydration-cause-false-negative-pregnancy-test-exploring-the-connection?srsltid=AfmBOoqN8PeRP6Nt17e8pa66vDvs-nqVUKoCfjysSX2m5kZdr3kDSg9G]
- 57. Ovulation Test Mistakes to Avoid [https://www.prisesbio.com/ig/news/ovulation-test-mistakes-to-avoid.html]
- 58. Comparison of Day-Specific Serum LH, Estradiol, and ... [https://pmc.ncbi.nlm.nih.gov/articles/PMC11356644/]
- 59. Urine Tests vs Blood Tests for Hormone Analysis [https://shop.miracare.com/blogs/resources/urine-tests-vs-blood-tests?srsltid=AfmBOornYSEaWAXlco1OMP54IhKCdrxiCsEvmvD8faHZxYvfd3KOS89m]
- 60. Complete Cycle Mapping Using a Quantitative At-Home ... [https://www.mdpi.com/1648-9144/58/12/1853]
- 61. Mira Fertility Tracker - Accurate Fertility Tracking and ... [https://shop.miracare.com/?srsltid=AfmBOoptONo1f_dl9uS_PLX_Ta9ds0fuQyMZWSRF8-uaqb_NI6EAF0Cu]
- 62. Oova Hormone Monitoring Kits - Fertility & Perimenopause ... [https://www.oova.life/?srsltid=AfmBOooUNJWD3nm_CPCM0bn3a-lUKLfUelEA-Z0187HwXTguqxkBB2UJ]
- 63. Predicting serum hormone concentration by estimation of ... [https://pmc.ncbi.nlm.nih.gov/articles/PMC9838318/]
- 64. Pilot test and validation of the Peak Day method of prospective ... [https://bmcwomenshealth.biomedcentral.com/articles/10.1186/1472-6874-14-4]
- 65. Detection of ovulation, a review of currently available ... [https://pmc.ncbi.nlm.nih.gov/articles/PMC5689497/]
- 66. Bland–Altman plot - Wikipedia [https://en.wikipedia.org/wiki/Bland%E2%80%93Altman_plot]
- 67. Understanding Bland Altman analysis - PMC [https://pmc.ncbi.nlm.nih.gov/articles/PMC4470095/]
- 68. Bland-Altman analysis: A paradigm to understand correlation and agreement - ScienceDirect [https://www.sciencedirect.com/science/article/pii/S2452247318302462]
- 69. Bland-Altman plot - MedCalc Statistical Software Manual [https://www.medcalc.org/en/manual/bland-altman-plot.php]
- 70. Interpreting results: Bland-Altman [https://www.graphpad.com/guides/prism/latest/statistics/bland-altman_results.htm]
- 71. Sample size calculation: Bland-Altman plot [https://www.medcalc.org/manual/sample-size-bland-altman.php]
- 72. Positive and negative predictive values [https://en.wikipedia.org/wiki/Positive_and_negative_predictive_values]
- 73. Sensitivity, Specificity, Positive Predictive Value, and ... [https://pmc.ncbi.nlm.nih.gov/articles/PMC8156826/]
- 74. Statistics | Sensitivity, Specificity, PPV and NPV [https://geekymedics.com/sensitivity-specificity-ppv-and-npv/]
- 75. Positive Predictive Value: Meaning, Formula, and ... [https://statisticsbyjim.com/basics/positive-predictive-value/]
- 76. 5 Best Ovulation Tests of 2025, Based on Our Testing [https://www.thebump.com/a/best-ovulation-predictor-kits]
- 77. Inito vs Mira: I Tried Both Monitors - Which Is Best? [https://pcosnutritionistalyssa.com/inito-vs-mira/]