Validating Emergency Department Checklists Across Age Groups: Methodologies, Applications, and Impact on Patient Safety
This article provides a comprehensive framework for the development and validation of Emergency Department (ED) checklists tailored for distinct age populations, including pediatric, adult, and geriatric patients.
Validating Emergency Department Checklists Across Age Groups: Methodologies, Applications, and Impact on Patient Safety
Abstract
This article provides a comprehensive framework for the development and validation of Emergency Department (ED) checklists tailored for distinct age populations, including pediatric, adult, and geriatric patients. It explores the foundational need for age-specific tools to address unique clinical presentations and risks, details rigorous methodological approaches for checklist creation and implementation, addresses common challenges in optimization, and examines validation strategies for assessing real-world efficacy. Aimed at researchers and clinical developers, this review synthesizes current evidence and best practices to enhance patient safety and improve outcomes in high-risk ED environments through reliable, validated checklists.
The Critical Need for Age-Specific Emergency Department Checklists
Understanding High-Risk ED Environments and the Imperative for Standardization
Emergency Departments (EDs) globally face increasing patient volumes and resource demands, creating crowded environments where accurate risk stratification becomes both critical and challenging [1]. The core problem lies in the absence of standardized operational definitions and validated assessment tools across ED settings, particularly for vulnerable populations like behavioral health patients [2]. This standardization crisis impacts every facet of emergency care—from predicting patient outcomes to benchmarking departmental performance. Without common vocabulary and metrics, ED leaders cannot effectively manage, report, or compare care across institutions, undermining data-driven leadership and ultimately patient care [2]. The COVID-19 pandemic has further exacerbated these challenges, intensifying the strain on hospital infrastructure and making clinical triage increasingly difficult [1]. Within this context, the imperative for standardization extends beyond operational efficiency to encompass the reliable validation of data collection instruments, including questionnaires, across diverse ED environments and age groups. This article examines the current state of high-risk ED environments, explores benchmarking and prediction model initiatives, and establishes why standardization is fundamental to advancing ED research and quality improvement, particularly in the validation of research tools.
The High-Risk ED Landscape: Behavioral Health and Operational Strain
The ED environment is uniquely characterized by high-acuity, high-uncertainty patient presentations, with behavioral health emergencies representing a particularly strained component of the system. The Behavioral Health Workgroup of the Fifth Emergency Department Benchmarking Alliance (EDBA) Summit highlighted the critical need for precise definitions and metrics to manage barriers for this patient population [2]. Their consensus recommendations provide a framework for quantifying this operational burden, as summarized in Table 1.
Table 1: Key Behavioral Health Operational Metrics for ED Benchmarking
| Metric | Definition | Operational Significance |
|---|---|---|
| Behavioral Health Patient Rate | Proportion of overall ED patients with a primary diagnosis of mental health illness and/or substance use disorder [2]. | Quantifies the volume burden of behavioral health on the ED system. |
| Pediatric Behavioral Health Patient Rate | Proportion of pediatric ED patients (age ≤18 years) dispositioned with a primary or secondary behavioral health diagnosis [2]. | Measures the specific burden of pediatric behavioral health presentations. |
| Behavioral Health Boarding Hours per Day | Average number of daily hours that behavioral health patients board in the ED, starting from the order to admit or transfer [2]. | A critical indicator of ED and hospital capacity constraints and patient flow inefficiency. |
| Behavioral Health Consultation Rate | Number of behavioral health consultations per 100 ED visits [2]. | A marker of the clinical burden and resource intensity required for behavioral health patients. |
| Average BH Sitter Hours per Day | Average number of hours daily that ED personnel must dedicate to one-on-one monitoring of behavioral health patients [2]. | Directly translates to staffing resource allocation and associated costs. |
The EDBA Summit also emphasized innovative care models to address these challenges, including ED patient navigators and substance use navigators who coordinate care and facilitate treatment linkages, as well as mobile crisis teams and sobering centers that offer community-based alternatives to ED intake [2]. Standardizing the metrics in Table 1 allows EDs to benchmark their performance, identify areas for improvement, and objectively evaluate the impact of implementing these new models of care.
Benchmarking and Prediction Models: The Power of Standardized Data
The movement toward standardization is perhaps most advanced in the field of ED prediction models, where public benchmarks are revolutionizing research reproducibility and model comparison. As clinical triage becomes more complex, prediction models offer the potential to identify high-risk patients and prioritize resources [1]. The widespread adoption of Electronic Health Records (EHRs) has provided the data necessary to develop these models.
A pivotal development is the creation of open-source benchmark datasets, such as the one derived from the MIMIC-IV-ED database, which includes over 400,000 ED visits [1]. This benchmark suite standardizes data preprocessing and defines three key clinical prediction tasks, outlined in Table 2 below. Such benchmarks eliminate cumbersome data preprocessing, provide a fixed test set for fair model comparisons, and significantly lower the entry barrier for new researchers [1].
Table 2: Standardized Clinical Prediction Benchmarks for ED Outcomes
| Prediction Task | Definition | Clinical and Operational Relevance |
|---|---|---|
| Hospitalization | Inpatient care site admission immediately following an ED visit; patients transitioning to ED observation are not considered hospitalized unless subsequently admitted [1]. | Indicates resource utilization (bed allocation) and patient acuity, facilitating resource allocation planning. |
| Critical Outcome | A composite outcome defined as either inpatient mortality or transfer to an ICU within 12 hours of presentation [1]. | Identifies critically ill patients requiring urgent ED resources and early intervention to mitigate poor health outcomes. |
| 72-Hour ED Reattendance | A patient's return visit to the ED within 72 hours after being discharged from a previous ED visit [1]. | A widely used indicator of the quality of care and patient safety, potentially identifying inadequate triage or treatment during the initial visit. |
These models are evaluated against established triage systems like the Emergency Severity Index (ESI) and scoring systems such as the Modified Early Warning Score (MEWS) and National Early Warning Score (NEWS) [1]. The existence of a public benchmark ensures that different machine learning models and traditional scoring systems can be compared fairly, accelerating progress in ED-based predictive analytics.
The Scientist's Toolkit: Essential Reagents for ED and Questionnaire Research
To conduct rigorous research in ED operations and questionnaire validation, specific "research reagents" and methodologies are essential. The table below details key tools and protocols derived from recent studies.
Table 3: Essential Research Reagents and Methodologies
| Tool or Protocol | Function & Application | Key Features & Considerations |
|---|---|---|
| MIMIC-IV-ED Benchmark Suite [1] | Provides a standardized, preprocessed public dataset for developing and comparing ED prediction models. | Includes master dataset, data processing scripts, and defined prediction tasks (hospitalization, critical outcome, reattendance). |
| EDBA Definitions Dictionary [2] | Provides a consensus-based, standardized vocabulary for ED operations metrics. | Essential for ensuring consistent data collection and valid benchmarking across different institutions and studies. |
| Health Belief Model (HBM) Framework [3] | A theoretical framework for developing and validating questionnaires assessing knowledge, perceptions, and health behaviors. | Structures items around constructs like perceived susceptibility, severity, benefits, and barriers to explain and predict behavior. |
| Cognitive Interviewing [4] | A pre-testing method for validating questionnaires by interviewing participants to understand their thought process when answering items. | Ensures questions are interpreted as intended, improving content validity and feasibility, especially in unique populations. |
| Discrete Choice Experiment (DCE) Development [4] | A method for quantitatively eliciting preferences for healthcare services or attributes. | Requires careful, culturally sensitive development involving literature review, stakeholder interviews, and attribute ranking. |
Experimental Protocol: Validating a Research Questionnaire
The development of a reliable and valid questionnaire is a multi-stage, methodical process. The following workflow, adapted from rigorous methodological studies, outlines the key steps for creating a tool to assess constructs like knowledge, perceptions, and avoidance behaviors in a specific population [4] [3].
Diagram 1: Questionnaire Validation Workflow
The process begins with Phase 1: Tool Development. This involves establishing a foundation through a comprehensive literature review and selecting a guiding theoretical framework, such as the Health Belief Model [3]. Subsequently, items are generated or adapted, a process greatly enriched by conducting semi-structured interviews with key stakeholders (e.g., patients, providers) to ensure cultural and contextual relevance [4]. The final step in this phase is a preliminary pretest, using methods like cognitive interviews, to refine the wording, format, and comprehensibility of the questionnaire [4].
This is followed by Phase 2: Psychometric Testing. The refined questionnaire is administered to a larger sample in a pilot survey [3]. The collected data is then subjected to rigorous statistical analysis. Reliability is tested, typically using Cronbach's alpha to assess the internal consistency of the constructs [3]. Validity is also assessed, which may involve techniques like Exploratory and Confirmatory Factor Analysis (EFA/CFA) to verify that the questionnaire's structure aligns with the intended theoretical constructs [5]. A questionnaire that meets reliability and validity standards through this process becomes a final, validated tool for research.
Visualization and Data Presentation in Scientific Communication
Effective communication of scientific findings, whether operational benchmarks or research results, relies heavily on clear data visualization. Adhering to established guidelines ensures that graphs and tables are accessible and interpretable for the target audience of researchers and professionals.
Guidelines for Effective Data Presentation
- Make Graphics Self-Explanatory: Charts should include clear titles, legends, and definitions on the same page. The "golden rule" is that if a graphic requires extensive explanation, there is a flaw in its design [6].
- Optimize Bar Charts: As the most common graphic in comparative reports, bar charts should be augmented with the actual numerical value, ordered from best to worst performance, and use a scale showing at least zero and 100 for orientation [6].
- Ensure Accessibility with Color: Color should be used thoughtfully. To accommodate color vision deficiencies, minimize the use of red/green combinations. Use a patterned bar or a lighter tone of the same color for comparators instead of a different color [6]. All elements must maintain sufficient contrast; Web Content Accessibility Guidelines (WCAG) AA requires a contrast ratio of at least 4.5:1 for normal text [7].
- Limit Table Size: Tables should display no more than seven providers or measures at a time, as the human short-term memory struggles with larger amounts of information. For bigger datasets, information should be broken into smaller, meaningful chunks [6].
The path toward improved patient outcomes and operational excellence in high-risk ED environments is inextricably linked to the rigorous standardization of definitions, metrics, and research tools. The initiatives led by the Emergency Department Benchmarking Alliance to create a shared operational vocabulary [2] and the development of public benchmarks for prediction models [1] represent significant strides forward. For researchers, this means that validating data collection instruments, such as questionnaires for different age groups, must be conducted with the same methodological rigor—employing theoretical frameworks, stakeholder engagement, and robust psychometric testing [4] [3]. By embracing these standardized approaches, the emergency care community can generate comparable, high-quality data, accelerate the pace of research, and ultimately translate findings into more effective and equitable patient care.
Unique Clinical Challenges in Pediatric Emergency Assessment and Triage
Pediatric emergency assessment and triage present a distinct set of clinical challenges that differentiate this field from adult emergency care. The physiological, developmental, and psychological uniqueness of children necessitates specialized approaches for accurate triage and intervention. Unlike adults, children often cannot articulate their symptoms clearly, requiring clinicians to rely on observational skills, caregiver reports, and age-appropriate assessment tools [8]. This complexity is compounded by the high-stakes environment of emergency departments where timely identification of critically ill children is paramount for improving outcomes and reducing mortality, particularly in low-resource settings where pediatric mortality within 24 hours of hospital presentation can reach 33% [9]. The task of distinguishing stable patients from critically ill children across a spectrum of age-dependent presentations, nonspecific symptoms, and overlapping clinical findings represents a fundamental challenge for emergency care providers [8].
Comparative Analysis of Pediatric Triage Systems
Various triage systems have been developed to address the unique needs of pediatric emergency assessment. The table below provides a structured comparison of three prominent systems used globally, highlighting their key features, strengths, and limitations.
Table 1: Comparison of Pediatric Emergency Triage Systems
| Triage System | Key Features & Methodology | Strengths | Limitations & Evidence |
|---|---|---|---|
| Emergency Triage, Assessment and Treatment (ETAT) | Uses clinical signs (e.g., respiratory distress, shock, severe dehydration) to identify life-threatening conditions without complex diagnostics [9]. | High sensitivity; designed for low-resource settings; linked to a 40% reduction in pediatric mortality in Malawi [9]. | Requires consistent refresher training (skills decline post-training); adherence challenges in busy settings [9]. |
| South African Triage Scale (SATS) for Pediatrics | Combines a Triage Early Warning Score (TEWS) with a list of clinical discriminators for emergency symptoms [9]. | Good sensitivity and negative predictive value; more effective than using clinical discriminators or TEWS alone [9]. | Requires basic diagnostic tools (e.g., pulse oximeters) often unavailable in very low-resource settings [9]. |
| Pediatric Early Warning Score (PEWS) | Utilizes age-specific pediatric vital signs and behavioral observations to track clinical deterioration [8] [9]. | Associated with lower mortality and fewer clinical deterioration events [9]. | Limited validation studies in low-resource settings; effectiveness depends on staff training and resource availability [9]. |
Methodological Considerations for Research and Validation
Study Design and Data Collection Protocols
Robust research in this field requires methodologies that account for pediatric-specific challenges. Cross-sectional studies and randomized controlled trials represent common approaches, with data collection often involving standardized questionnaires, clinical assessments, and biomarker analysis [10] [11]. Research focusing on pediatric populations must incorporate age-stratified recruitment to capture developmental variations, such as studies targeting specific groups from infants to adolescents [8]. For tool validation, researchers should employ rigorous psychometric testing, including assessment of internal consistency using Cronbach's alpha, to ensure reliability across different age groups [3]. Furthermore, longitudinal designs with pre- and post-intervention surveys are valuable for measuring changes in knowledge, readiness to change behaviors, and clinical outcomes following implementation of new triage protocols or educational interventions [11].
Quantitative Data Presentation and Analysis
Effective presentation of quantitative data is crucial for interpreting pediatric emergency research findings. Categorical variables, such as triage acuity levels or presence of specific symptoms, should be presented using absolute and relative frequencies in clearly formatted tables to facilitate comparison across studies [12]. For numerical variables like vital signs or laboratory values, researchers should organize data into frequency distribution tables with appropriate class intervals, typically between 6-16 categories with equal amplitudes [13]. Visual presentation through histograms, frequency polygons, or line diagrams can effectively demonstrate trends and distributions, though all graphics must be self-explanatory with clear titles, legends, and scales [12] [6] [13]. Statistical analysis should employ appropriate methods for comparing triage accuracy across systems, often using multiple logistic regression to investigate associations while controlling for confounding variables [14].
Table 2: Essential Methodological Components for Pediatric Triage Research
| Research Component | Application in Pediatric Emergency Triage | Specific Considerations |
|---|---|---|
| Sample Size Determination | Based on prevalence of target conditions and desired statistical power [3]. | Account for age stratification and subgroup analyses; collaborative multi-center studies may be needed for rare conditions. |
| Data Collection Instruments | Validated questionnaires, clinical assessment forms, laboratory test results [3]. | Adapt tools for different developmental stages; use age-appropriate pain scales and assessment protocols. |
| Outcome Measures | Triage accuracy, time to treatment, mortality, hospital admission rates [9] [15]. | Include both clinical outcomes and process measures; track mistriage rates (over- and under-triage) [15]. |
| Statistical Methods | Multiple logistic regression, mixture analysis (WQS, Qgcomp, BKMR), structural equation modeling [14] [10]. | Adjust for clustering effects in multi-site studies; use bootstrapping for indirect effects testing [10]. |
Technological Innovations and Research Tools
Emerging technologies are transforming pediatric emergency triage with artificial intelligence and machine learning models demonstrating promising sensitivity and specificity in triage prediction and septic shock recognition [8]. Point-of-care testing and ultrasound have shown significant value in accelerating diagnosis and reducing emergency department length of stay [8]. Digital tools, including mobile health applications, enable real-time measurement of biosignals and environmental risk factors, creating opportunities for personalized risk assessment [10]. For research applications, the following tools and reagents facilitate comprehensive investigation into pediatric emergency assessment.
Table 3: Research Reagent Solutions for Pediatric Emergency Assessment Studies
| Research Tool/Reagent | Function/Application | Specific Use in Pediatric Studies |
|---|---|---|
| Point-of-Care Testing (POCT) Platforms | Rapid diagnostic testing for biomarkers (CRP, blood gases, glucose, lactate) [8] [9]. | Reduces turnaround time; enables quick decision-making for febrile infants and children with undifferentiated illness [8]. |
| Biomarker Panels | Analysis of inflammatory markers (e.g., SII), uric acid, and other clinical biomarkers [14] [11]. | Identifies mediators between exposures and outcomes; tracks intervention effectiveness [14]. |
| Wearable Biosensors | Continuous monitoring of vital signs (heart rate, electrocardiogram, oxygen saturation) [10]. | Provides real-time physiological data for triage algorithms; enables pre-hospital assessment. |
| Environmental Exposure Assays | Biomonitoring of endocrine-disrupting chemicals (BPA, phthalates, parabens) in urine [14] [11]. | Investigates environmental contributors to respiratory and other emergency conditions [14]. |
| AI-Based Triage Algorithms | Machine learning models for risk stratification and prediction of clinical deterioration [8] [9]. | Enhances triage accuracy; identifies subtle patterns in vital signs and symptoms [8]. |
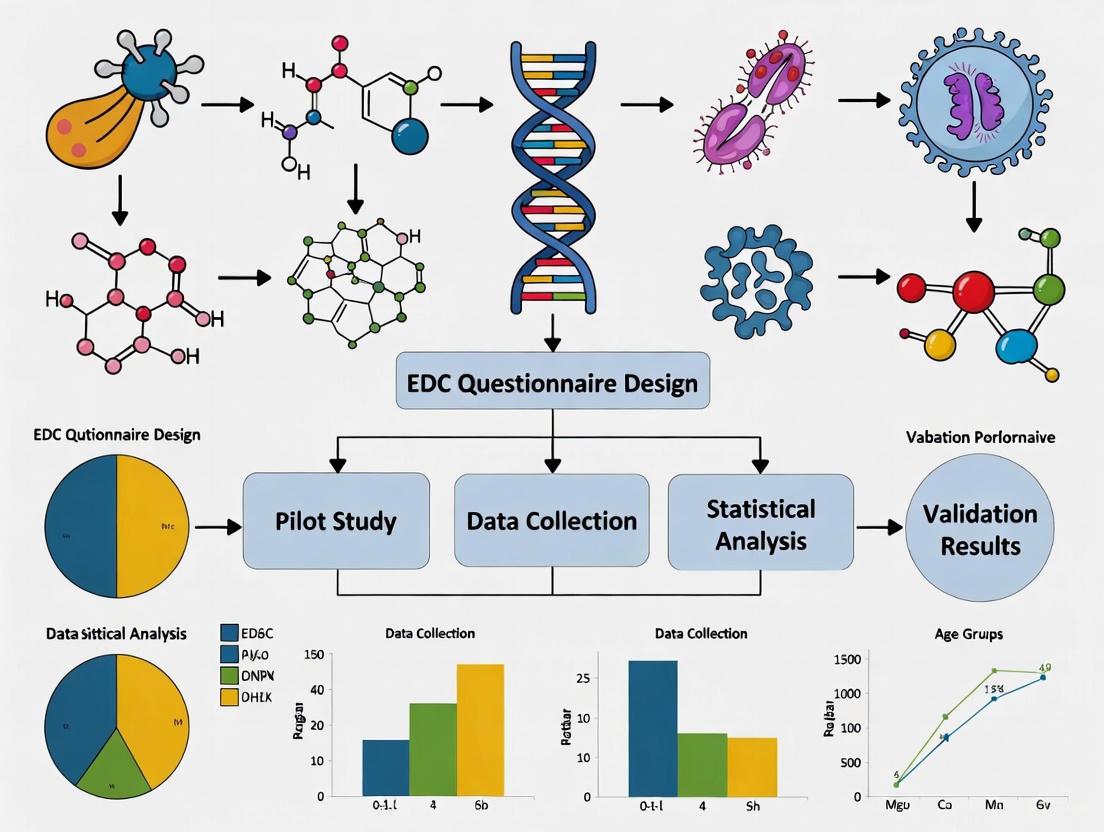
Integration with EDC Questionnaire Validation Across Age Groups
The validation of endocrine-disrupting chemical (EDC) questionnaires across different age groups shares important methodological parallels with pediatric triage assessment tool development. Both fields require age-appropriate validation strategies that account for developmental differences in symptom reporting, comprehension, and behavioral patterns [3]. Research has demonstrated that EDC exposure assessments must consider age-specific exposure pathways and metabolic differences, similar to how pediatric triage must accommodate age-dependent variations in normal vital signs and symptom presentation [8] [11].
The connection between EDC exposure and respiratory conditions highlights another intersection between these fields. Studies using NHANES data have revealed that certain EDCs, including bisphenol A and most phthalates, show positive correlations with preserved ratio impaired spirometry (PRISm), a precursor to chronic obstructive pulmonary disease [14]. This relationship underscores the importance of environmental exposure assessment in comprehensive pediatric emergency evaluation, particularly for children presenting with respiratory symptoms.
Diagram 1: Pediatric Triage with EDC Considerations. This workflow integrates age-specific assessment with potential environmental exposure evaluation, highlighting parallel validation needs across development stages.
Pediatric emergency assessment and triage present unique challenges that demand specialized approaches, tools, and research methodologies. The comparison of triage systems reveals that context-appropriate implementation is crucial, with systems like ETAT showing significant mortality reduction in low-resource settings while facing sustainability challenges. The methodological considerations outlined provide researchers with frameworks for developing and validating assessment tools that account for developmental variations across pediatric age groups. The integration of technological innovations, including artificial intelligence and point-of-care testing, offers promising avenues for enhancing triage accuracy and efficiency. Furthermore, the parallel validation needs between pediatric triage tools and EDC questionnaires across age groups suggest opportunities for methodological cross-fertilization. Future research should focus on adapting these systems for specific healthcare contexts while maintaining rigorous validation standards to ensure optimal emergency care for pediatric populations across the developmental spectrum.
Emergency Departments (EDs) globally are experiencing a surge in visits from older adults, a population with unique and complex medical needs [16]. Geriatric syndromes—including frailty, polypharmacy, and atypical disease presentations—represent a significant challenge for ED clinicians, as these conditions are frequently interrelated and can dramatically impact patient outcomes [17] [18]. The presence of these syndromes often complicates diagnosis and treatment, requiring specialized approaches that differ from standard ED protocols designed for younger, healthier populations [16]. Understanding the prevalence, interrelationships, and clinical implications of these syndromes is crucial for improving emergency care for older adults, guiding the development of targeted assessments, and informing future research, including the validation of diagnostic tools like the Endocrine-Disrupting Chemical (EDC) questionnaire across diverse age groups [19].
The table below summarizes key quantitative findings from recent studies on geriatric syndromes in the emergency department setting, providing a clear comparison of their prevalence and impact.
Table 1: Prevalence and Impact of Key Geriatric Syndromes in the ED
| Geriatric Syndrome | Reported Prevalence | Key Associated Factors/Outcomes | Data Source |
|---|---|---|---|
| Atypical Presentation | 28.6% (181/633 cases) [20] | Most common presentation: absence of fever in diseases known to cause fever (34.42%). Independent risk factors: complicated UTI (OR 4.66) and dementia (OR 3.48) [20]. | Retrospective audit of ED patients ≥65 years [20] |
| Frailty | 70.2% of patients in a Mexican study [18]; 43.5% classified as frail (CFS 5-9) in a multicenter study [21] | Independent predictor of hospital admission (OR 1.414), ICU admission (OR 1.254), and in-hospital mortality (OR 1.434) [21]. | Prospective cohort study [18]; Multicenter retrospective study [21] |
| Polypharmacy | Prevalence of 59% in frail older adults [17] | Associated with adverse drug events, falls, hospitalizations, and mortality. Increases the risk of potentially inappropriate medications (PIMs) [17]. | Umbrella review [17] |
| Co-existing Geriatric Syndromes | Average of 4.65 (±2.76) syndromes per individual [18] | Cognitive impairment (adjusted OR 6.88) and dependence (adjusted OR 7.52) were independent predictors of in-hospital mortality [18]. | Prospective study of OAs admitted to the ED [18] |
Experimental Protocols and Assessment Methodologies
To ensure consistency and reliability in research and clinical practice, standardized protocols are used to identify and assess geriatric syndromes. The following section details the key methodologies cited in the literature.
Protocol for Assessing Atypical Presentations
A retrospective medical record audit is a common method for investigating atypical presentations [20].
- Study Population: Patients aged ≥65 years who visited the ED. A typical sample size can be over 600 patients, selected randomly from annual visits [20].
- Data Collection: Demographic data and clinical information are collected from patient records. The operational definition of an "atypical presentation" must be explicitly stated, for example: "the absence of typical signs and symptoms usually associated with a final medical diagnosis," such as lack of fever in a disease known to cause fever, lack of pain, or presentation as a geriatric syndrome (e.g., functional decline, delirium) [20].
- Data Analysis: Descriptive statistics calculate the prevalence of atypical presentations. Regression analysis is then used to identify variables independently associated with these presentations, such as specific infections or cognitive impairments [20].
Protocol for Frailty Assessment Using the Clinical Frailty Scale (CFS)
The Clinical Frailty Scale (CFS) is a validated, rapid tool for assessing frailty in the ED [21].
- Tool Description: The CFS is a 9-point scale ranging from 1 (very fit) to 9 (terminally ill). Scores of 5-9 indicate varying degrees of frailty [21].
- Implementation: Clinicians assign a CFS score based on a comprehensive clinical assessment of the patient's fitness, comorbidity, and functional status. This can be done at triage or during the initial evaluation [21].
- Outcome Correlation: The CFS score is used for risk stratification. Studies correlate CFS scores with primary outcomes such as hospital admission, intensive care unit (ICU) admission, and in-hospital mortality. Its predictive performance is often compared to other scores like qSOFA, NEWS2, and REMS using logistic regression analysis and Area Under the Receiver Operating Characteristic (AUROC) curves [21].
Protocol for Evaluating Polypharmacy and Deprescribing
The process of evaluating medication regimens for polypharmacy and deprescribing opportunities involves structured criteria and, increasingly, technological assistance.
- Definition and Identification: Polypharmacy is typically defined as the use of five or more medications. A patient's active medication list is reviewed to identify polypharmacy [17] [22].
- Application of Explicit Criteria: Screening tools are applied to the medication list to identify Potentially Inappropriate Medications (PIMs). Common tools include:
- Novel Approaches: Large Language Models (LLMs) for Deprescribing: A recent study utilized a two-step LLM (GPT-4o) pipeline [22]:
- Filtering: The LLM first filters a full list of deprescribing criteria (e.g., Beers, STOPP) based solely on the patient's medication list.
- Contextual Application: The LLM then applies the filtered criteria using both structured (e.g., demographics, lab values) and unstructured (e.g., clinical notes) patient data from the Electronic Health Record (EHR) to generate a deprescribing recommendation [22].
- Validation: LLM recommendations are validated against recommendations made by trained medical students, with discrepancies adjudicated by board-certified physicians [22].
Visualizing the Interrelationships: The Geriatric Triangle
The concepts of frailty, multimorbidity (multiple chronic conditions), and polypharmacy are deeply interconnected, forming a bidirectional relationship that can be conceptualized as the "geriatric triangle" [17]. The following diagram illustrates these complex interactions.
Visualizing Research and Clinical Workflows
Implementing research protocols and clinical assessments for geriatric syndromes requires structured workflows. The diagram below outlines a generalizable research workflow for validating assessment tools, such as a questionnaire, in a specific population.
The following table details essential materials and tools used in the experimental protocols featured in this field, providing researchers with a starting point for methodology development.
Table 2: Essential Reagents and Tools for Geriatric Syndrome Research
| Tool/Resource | Type | Primary Function in Research | Example Use Case |
|---|---|---|---|
| Clinical Frailty Scale (CFS) [21] | Clinical Assessment Tool | A rapid, validated scale to categorize an older adult's level of frailty. | Predicting hospital admission, ICU admission, and in-hospital mortality in ED patients [21]. |
| Beers Criteria & STOPP Criteria [22] | Explicit Pharmacological Criteria | Standardized lists to identify Potentially Inappropriate Medications (PIMs) in older adults. | Screening medication lists for deprescribing opportunities in polypharmacy research [22]. |
| Large Language Models (e.g., GPT-4o) [22] | Computational Tool | To automate the filtering and application of complex deprescribing criteria using structured and unstructured EHR data. | Identifying potential deprescribing opportunities in retrospective cohort studies [22]. |
| Structured Data Collection Instruments (e.g., SIS, PHQ-9, CAM) [18] | Battery of Standardized Questionnaires & Tests | To perform a Comprehensive Geriatric Assessment (CGA) covering cognition, mood, function, and other geriatric syndromes. | Determining the prevalence and co-occurrence of multiple geriatric syndromes in a study population [18]. |
| Electronic Health Record (EHR) Data [22] | Data Source | Provides real-world, longitudinal patient data including demographics, diagnoses, medications, lab results, and clinical notes. | Retrospective analysis of patient outcomes and as an input source for LLM-driven deprescribing algorithms [22]. |
The evidence overwhelmingly confirms that geriatric syndromes like frailty, polypharmacy, and atypical presentations are highly prevalent, interconnected, and strong predictors of adverse outcomes in older ED patients [20] [18] [21]. Addressing these challenges requires a shift from traditional, disease-centered ED models to more holistic, patient-centered approaches [16]. This includes the routine implementation of validated assessments like the Clinical Frailty Scale and Comprehensive Geriatric Assessment, as recommended by the Geriatric Emergency Department Guidelines 2.0 [16] [18]. Furthermore, emerging tools like LLMs show promise in managing complexity, such as assisting with deprescribing, though they require further refinement and integration into clinical workflows [22]. Future research must continue to develop and validate robust tools—including questionnaires for various risk factors—tailored to the unique physiological and pharmacological profiles of an aging global population.
The Impact of Age-Specific Checklists on Error Reduction and Patient Safety Metrics
A detailed comparison of specialized tools enhancing safety across the patient age spectrum.
Checklists are a cornerstone of patient safety, but their effectiveness is significantly enhanced when tailored to the specific needs of different age groups. This guide compares the objectives, methodologies, and impacts of age-specific checklists against general patient safety checklists, providing researchers and drug development professionals with a data-driven analysis of their performance in reducing errors and improving safety metrics.
Comparative Analysis of Checklist Types
The table below summarizes the core characteristics and documented outcomes of general versus age-specific checklists based on current research and validation studies.
| Feature | General Patient Safety Checklists | Age-Specific Checklists (Pediatric ADLs) | Age-Specific Checklists (Infarction Code) |
|---|---|---|---|
| Primary Objective | Reduce medical errors and enhance safety through standardized processes [23]. | Measure age-related performance in Activities of Daily Living (ADLs) to establish normative references [24]. | Standardize and systematize care for time-dependent conditions (e.g., AMI) in primary care [25]. |
| Target Population | Broad, hospital-wide patients [23]. | Normal developing children (NDC) under 18 years, stratified by age [24]. | Patients presenting with suspected acute myocardial infarction, typically adults [25]. |
| Key Metrics | Medication errors, surgical complications, adverse events [23]. | Level of independence in 14 domains (e.g., dressing, eating, mobility) across 30 latent variables [24]. | Adherence to gold-standard guidelines, electrocardiogram-to-PCI time, relationship with patient safety indicators [25]. |
| Development Sample Size | Not Specified (Literature Review) [23]. | 3,079 children (1,478 females, 1,601 males), median age 10.7 years [24]. | 615 responses to online checklist [25]. |
| Validation Method | Narrative review of studies from 2013-2023 [23]. | Cross-sectional survey; factor analysis to identify latent variables; creation of age-based reference charts [24]. | Prospective validation using clinical scenarios; assessment of internal consistency and temporal robustness [25]. |
| Reported Impact | Positive impact on reducing errors; success depends on organizational culture and resources [23]. | Provides the first comprehensive reference charts for ADL performance in an Italian pediatric population [24]. | (Protocol Stage) Aims to demonstrate that checklist use increases patient safety and standardizes care [25]. |
Experimental Protocols and Methodologies
Protocol for Developing Pediatric Age-Specific Checklists
The creation of the Activities of Daily Living (ADL) checklist for children exemplifies a rigorous, data-driven methodology [24].
- Item Identification and Selection: Researchers identified 268 relevant items covering a wide range of daily life activities. A correlation analysis integrated with clinical judgment was used to refine this set, resulting in a final 154-item pool [24].
- Survey Administration: A cross-sectional survey was conducted using the finalized questionnaire. Data was collected from 3,079 normal developing children under 18 years of age [24].
- Factor Analysis: Exploratory factor analysis was employed to identify latent variables, which allowed researchers to group the 154 selected items into 14 domains and 30 specific skill-related areas [24].
- Modeling and Reference Chart Creation: For each latent variable, a model was developed to represent the progression of ADL performance as a function of the child's age. This process generated the age-related reference charts that serve as a normative standard [24].
Protocol for Validating a Clinical Checklist
The validation of the infarction code care checklist demonstrates how to test a tool's reliability and robustness in a clinical context [25].
- Scenario Development: Two clinical scenarios of varying difficulty were defined, with correct answers established according to gold-standard clinical guidelines [25].
- Training and Initial Response: Following annual training on the infarction code, healthcare professionals completed the online checklist for the first time based on the clinical scenarios [25].
- Temporal Robustness Assessment: The same checklist was sent to participants a second time at 30, 45, and 90-day intervals. This design assesses the checklist's internal reliability and temporal robustness by comparing the number of correct responses against the gold standard over time [25].
- Correlation with Safety Indicators: The results from the checklist responses are evaluated against other available patient safety indicators in the region, such as indicators for pharmaceutical prescription quality and care quality [25].
The Scientist's Toolkit: Research Reagent Solutions
The following table details key resources and methodologies essential for research in checklist development and validation.
| Item/Tool | Function in Research | Exemplar Use Case |
|---|---|---|
| Factor Analysis | Identifies underlying, unobservable constructs (latent variables) that explain patterns in observed data. | Grouping 154 specific questions into 14 core domains of pediatric Activities of Daily Living (ADLs) [24]. |
| Cross-Sectional Survey Design | Collects data from a population at a single point in time to identify prevalence and relationships. | Establishing normative reference data for ADL performance across different age groups in a pediatric population [24]. |
| Clinical Scenarios (Gold Standard) | Provides a controlled, benchmarked method to test the accuracy and adherence of a checklist against established protocols. | Validating the infarction code checklist by measuring how well professional responses align with guideline-based correct answers [25]. |
| Internal Consistency (Cronbach's Alpha) | A psychometric measure that assesses the reliability of a questionnaire by determining how closely related a set of items are as a group. | Demonstrating strong reliability across all constructs (knowledge, risk perceptions, beliefs, avoidance behavior) in a tool measuring attitudes toward endocrine-disrupting chemicals [3]. |
| Health Belief Model (HBM) | A theoretical framework for understanding health-related behaviors; guides questionnaire design by structuring items around perceived susceptibility, severity, benefits, and barriers. | Developing a reliable tool to assess women's perceptions and avoidance behaviors regarding endocrine-disrupting chemicals in products [3]. |
Research Workflow: From Development to Validation
The diagram below illustrates the logical workflow for developing and validating a checklist, integrating methodologies from the cited studies.
Key Insights for Research and Development
The evidence demonstrates that while general checklists provide a foundational safety net [23], their utility is maximized when specialized. The development of the pediatric ADL checklist highlights the necessity of large, normative datasets and statistical modeling to create age-stratified tools that can accurately identify developmental delays or impairments [24]. Furthermore, the protocol for the infarction code checklist underscores that validation requires more than expert consensus; it demands rigorous testing for internal consistency and temporal robustness to ensure reliability in high-stakes clinical environments [25]. For researchers validating tools like EDC questionnaires across age groups, these methodologies are directly applicable. Employing a theoretical framework (e.g., the Health Belief Model [3]), establishing internal consistency, and creating age-specific reference curves are critical steps for generating valid, impactful research instruments.
Building and Implementing Robust Age-Specific ED Checklists
The validation of Electronic Data Capture (EDC) questionnaires for clinical research represents a critical methodological challenge, particularly when these instruments must be adapted for different age groups. A systematic development framework is essential to ensure that resulting data are reliable, comparable, and scientifically valid. This guide objectively compares two predominant methodological frameworks used in this process: the Delphi consensus technique, which systematizes expert opinion, and patient-centered feedback approaches, such as Discrete Choice Experiments (DCEs), which directly incorporate patient preferences and lived experience [26] [4]. The integration of these frameworks is especially crucial for EDC systems, which must not only capture clinical data efficiently but also integrate seamlessly with Electronic Health Records (EHRs) to streamline research processes and reduce site burden [27]. This article provides a comparative analysis of these frameworks, supported by experimental data and detailed protocols, to guide researchers and drug development professionals in validating EDC questionnaires across diverse populations.
Framework Comparison: Delphi Consensus vs. Patient Feedback
The selection of a development framework significantly influences the structure, content, and ultimate validity of a research instrument. The table below provides a high-level comparison of the two primary approaches.
Table 1: High-Level Comparison of Development Frameworks
| Aspect | Delphi Consensus Technique | Patient-Centered Feedback (e.g., DCE) |
|---|---|---|
| Core Purpose | To gain consensus among experts on complex issues characterized by uncertainty [26] [28]. | To elicit and understand patient preferences and priorities for healthcare services or instruments [4]. |
| Primary Input | Collective intelligence and judgment of a panel of selected experts [26] [29]. | Lived experience, values, and choice behaviors of patients or end-users [4]. |
| Typical Output | A set of consensus-based guidelines, criteria, or a structured instrument [30]. | A ranked set of attributes defining patient priorities, informing a tailored instrument or service design [4]. |
| Key Strength | Reduces bias from dominant individuals and systematizes expert knowledge [29]. | Ensures content and face validity from the end-user perspective, crucial for adoption [4]. |
| Context of Use | Ideal for problems where objective data is lacking and expert judgment is paramount [26]. | Essential for designing services or tools that must align with cultural, social, or personal user needs [4]. |
The Delphi Consensus Technique
The Delphi technique is a structured communication process that aims to achieve convergence of opinion on a specific topic through multiple rounds of anonymous, controlled feedback [26] [29].
- Process and Workflow: A classic Delphi study follows a defined iterative cycle. It begins with the facilitator distributing an initial, often open-ended questionnaire. After each round, the facilitator provides a controlled feedback report summarizing the group's responses, often with statistical aggregation and anonymous comments, prompting experts to refine their judgments [30] [29]. This process continues for a pre-defined number of rounds or until a pre-specified consensus level is reached [26].
- Key Experimental Parameters: The practical application of the Delphi method involves several critical design choices. A recent scoping review of 287 health science Delphi studies found that 81% defined consensus as a percentage agreement, though the specific threshold (e.g., 70%, 75%, 80%) varies [30]. Panel sizes are typically in the double-digits, often between 10 to 100 members, balancing diversity with manageability [26]. The same review noted that about a quarter of studies included affected parties like patients in the expert panel, and 43% of studies reported using a modified Delphi approach [30].
Patient-Centered Feedback Frameworks
Patient-centered frameworks, such as Discrete Choice Experiments (DCEs), provide a quantitative method to elicit preferences by presenting participants with a series of choices between hypothetical scenarios with varying attributes [4].
- Process and Workflow: The development of a DCE is a multi-stage, mixed-methods process. It starts with qualitative identification of the key attributes and levels that define a service or product, often through literature reviews and stakeholder interviews. These attributes are then refined through quantitative exercises like ranking surveys with the target population. Finally, the draft DCE questionnaire is validated through cognitive interviews to ensure it is understood as intended [4].
- Application in Closed Communities: This approach is particularly valuable for research involving unique populations. A 2025 study on developing a DCE for ultra-Orthodox Jewish women regarding video consultations demonstrated the necessity of deep cultural adaptation. The study engaged multiple stakeholders (women, men, rabbis, healthcare providers), used community-matched interviewers, and obtained religious leadership approval. A key finding was the community's requirement for a dedicated device, closed to the open internet, for communication with healthcare providers—a critical attribute that would be unlikely to emerge in a standard expert-driven Delphi panel [4].
Experimental Protocols for EDC Questionnaire Validation
Validating an EDC questionnaire for use across different age groups requires a hybrid approach that integrates both expert consensus and patient feedback. The following protocols provide a roadmap for this process.
Protocol 1: Modified Delphi for Item Generation and Prioritization
This protocol is adapted for creating age-appropriate item banks for EDC systems [26] [30].
- Formulate the Problem and Assemble Steering Group: Define the specific construct (e.g., medication adherence, pain intensity) and target age groups. Assemble a steering group of 5-7 experts to oversee the process.
- Panel Selection: Recruit a heterogeneous panel of 15-30 experts. For pediatric EDC validation, this should include clinical researchers, methodologists, and healthcare providers from relevant disciplines, as well as patient advocates or caregivers who can speak to the experiences of the age group [30].
- Round 1 - Idea Generation: Distribute an initial survey based on a literature review, asking panelists to suggest items or constructs relevant to the target domain and age group. Use open-ended questions.
- Analysis and Round 2 - Rating: The steering group synthesizes responses into a list of items. In Round 2, panelists rate each item on predefined criteria (e.g., relevance, clarity, age-appropriateness) using a Likert scale (e.g., 1-9). Data to collect: mean score, percentage agreement for each item.
- Round 3 - Feedback and Re-rating: Provide controlled feedback, showing each panelist their previous rating alongside the group's statistical summary. Panelists are given the opportunity to revise their ratings. Consensus can be defined a priori as >70% of panelists rating the item within the 7-9 range [30].
- Final Analysis: The steering group finalizes the item bank based on the consensus ratings and qualitative comments.
Protocol 2: Integrated Patient Feedback and Cognitive Testing
This protocol tests the face validity and comprehensibility of the Delphi-generated items with the target age groups [4] [5].
- Attribute and Level Identification (if DCE is used): Conduct semi-structured interviews or focus groups with individuals from the target age groups to understand the key attributes of the construct from their perspective. For example, for a "user-friendly EDC app," attributes for teens might include "ease of use," "privacy," and "fun design."
- Questionnaire Drafting: Incorporate the findings into the draft EDC questionnaire.
- Cognitive Interviewing: Recruit 10-15 participants from each key age group. A trained interviewer administers the draft questionnaire and uses "think-aloud" techniques and targeted probes to understand the participant's thought process. Key questions: "What does this question mean to you?" "Can you repeat that in your own words?" "How did you arrive at that answer?"
- Data Analysis and Iteration: Analyze interview transcripts for recurring issues like misinterpretation of terms, confusing response options, or sensitive topics. Revise the questionnaire iteratively until no new critical issues emerge. A study on digital maturity, for instance, used a pretest with 20 participants to assess content validity and item difficulty before finalizing its survey [5].
Data Integration and Workflow: From Framework to Validated EDC
The ultimate goal of applying these frameworks is to produce a validated EDC instrument that can be efficiently integrated into clinical research workflows. The logical relationship between the different methodological components and the final outcome can be visualized as an iterative, multi-stage process.
Diagram 1: Integrated EDC Questionnaire Development Workflow
Quantitative Data from Integration Pilots
The integration of EDC with EHR systems is a key step in reducing redundancy and improving data quality. A pilot evaluation study, the "Munich Pilot," provided quantitative data on the impact of an integrated EHR-EDC solution compared to a traditional paper-based process [27].
Table 2: Process Efficiency Gains from Integrated EHR-EDC Solution (Munich Pilot Data)
| Metric | Traditional Paper-Based Process | Integrated EHR-EDC Process | Change |
|---|---|---|---|
| Time per Chemotherapy Visit | 14.8 minutes | 4.7 minutes | -68% |
| Time per Screening Visit | 31.6 minutes | 14.2 minutes | -55% |
| Data Entry Process Steps | 13 steps | 5 steps | -62% |
| Automated eCRF Data Population | 0% | 48% - 69% (depending on visit type) | +48% to +69% |
| Source: Adapted from "EHR and EDC Integration in Reality" evaluation study [27] |
The Scientist's Toolkit: Essential Research Reagents and Materials
The following table details key methodological components and their functions in the systematic development and validation of EDC questionnaires.
Table 3: Essential Components for EDC Questionnaire Validation Research
| Item | Function in Research Process |
|---|---|
| Expert Panel | Provides specialized knowledge and clinical judgment to generate and prioritize items, ensuring scientific rigor and relevance [26] [29]. |
| Structured Interview/Focus Group Guide | Facilitates the systematic collection of qualitative data from patients or end-users to identify key concepts, attributes, and appropriate language [4]. |
| Online Survey Platform (e.g., LimeSurvey) | Administers Delphi rounds or patient surveys, enabling anonymous participation, efficient data collection, and complex branching logic [5] [29]. |
| Consensus Definition Criteria | Pre-specified, objective metrics (e.g., percent agreement, interquartile range) used to determine when consensus is achieved, ensuring transparency and reproducibility [26] [30]. |
| Cognitive Interview Protocol | A structured guide for "think-aloud" interviews and probing questions to assess patient comprehension, retrieval process, and judgment formation when answering the draft questionnaire [4]. |
| EDC-EHR Integration Engine | Technical infrastructure that maps and transfers relevant clinical data from electronic health record systems directly to the EDC, reducing manual entry and transcription errors [27]. |
| Statistical Analysis Software (e.g., R, SPSS) | Used to analyze quantitative data from Delphi rounds (central tendency, dispersion) and patient surveys (factor analysis, reliability testing) to support validation [5]. |
The validation of EDC questionnaires for diverse age groups is not a choice between expert consensus and patient feedback but requires their strategic integration. The Delphi technique provides a structured, defensible method for distilling expert opinion into a coherent instrument, while patient-centered frameworks like DCEs and cognitive interviewing ensure the tool is relevant, comprehensible, and respectful of the end-user's context and capabilities. Quantitative data from integration pilots demonstrate that bridging the gap between research tools like EDCs and clinical care systems like EHRs yields significant efficiency gains and data quality improvements [27]. For researchers and drug development professionals, adopting these systematic frameworks is paramount for generating reliable, generalizable evidence across all age groups in clinical research.
Emergency Departments (EDs) represent high-stakes environments where diagnostic errors can lead to severe patient harm. Within the broader research on validating questionnaires for Endocrine-Disrupting Chemicals (EDCs) across different age groups, understanding and improving clinical decision-making processes is paramount. The development of a general ED safety checklist, focused on diagnostic, reassessment, and disposition phases, is a critical intervention to mitigate diagnostic error. This guide objectively compares the core components of such checklists, analyzes their efficacy based on experimental data, and details the methodologies required for their validation and implementation, providing a framework that can inspire robust methodological approaches in EDC questionnaire research.
Comparative Analysis of Checklist Components and Efficacy
A systematic review of 25 unique clinical diagnostic checklists, characterized using the human factors framework Systems Engineering Initiative for Patient Safety (SEIPS) 2.0, provides a basis for comparing core components and their associated impact on reducing diagnostic errors [31].
Table 1: Characterization and Efficacy of Diagnostic Checklist Components by SEIPS 2.0 Framework
| SEIPS 2.0 Component | Subcomponent | Description & Examples | Number of Checklists | Association with Error Reduction |
|---|---|---|---|---|
| Work System | Tasks | Checklists prompting specific actions (e.g., "obtain a repeat history," "order a specific test") [31]. | 13 | 5 out of 7 checklists demonstrating error reduction addressed this subcomponent [31]. |
| Persons | Elements addressing clinician or patient factors (e.g., knowledge, demeanor, health status) [31]. | 2 | Efficacy not prominently reported [31]. | |
| Internal Environment | Factors related to the immediate care setting (e.g., workspace design, noise) [31]. | 3 | Efficacy not prominently reported [31]. | |
| Processes | Cognitive | Elements targeting clinical reasoning (e.g., "list differential diagnoses," "consider cognitive biases") [31]. | 20 | 4 out of 10 checklists demonstrated improvement [31]. |
| Social & Behavioural | Components advocating communication with team members or patients [31]. | 2 | Efficacy not prominently reported [31]. | |
| Outcomes | Professional | Addressing outcomes like clinician burnout or fatigue [31]. | 2 | Efficacy not prominently reported [31]. |
The data indicates that checklists oriented toward the Tasks subcomponent are more frequently associated with a reduction in diagnostic errors compared to those focusing primarily on Cognitive processes [31]. This suggests that checklists prompting concrete actions are a high-yield component for improving diagnostic safety.
Experimental Protocols for Checklist Development and Validation
The development and validation of a reliable tool, whether a clinical checklist or a research questionnaire, require a rigorous methodological approach. The following protocols, drawn from checklist research and EDC questionnaire validation studies, provide a template for robust scientific development.
Systematic Review and Human Factors Analysis
The foundational protocol for evaluating existing checklists involves a systematic review and characterization using a structured framework.
- Objective: To identify, characterize, and evaluate the efficacy of checklists aimed at reducing diagnostic error [31].
- Search Strategy: A medical librarian performs serial literature searches across multiple databases (e.g., PubMed, EMBASE, Scopus, Web of Science) using controlled vocabulary and keywords related to "checklist," "differential diagnosis," and "diagnostic errors" with no restrictions on publication date or language [31].
- Study Selection: Articles are included if they contain one or more checklists aimed at improving the diagnostic process. Screening and eligibility determination are performed independently by two authors [31].
- Data Extraction & Synthesis: A standardized template is used to extract data on study design, population, and checklist content. Each unique checklist is independently characterized according to the SEIPS 2.0 framework [31].
- Quality Assessment: The risk of bias in individual studies is evaluated using standardized tools such as Cochrane's RoB 2.0 for randomized studies and the Newcastle-Ottawa Scale for cohort studies [31].
Tool Development and Psychometric Validation
This protocol outlines the process for creating a new assessment tool and establishing its reliability and validity, a process directly applicable to both ED safety checklists and EDC exposure questionnaires.
- Objective: To develop a self-administered questionnaire and verify its reliability and validity for measuring specific health behaviors [19].
- Initial Item Generation: An initial item pool is developed through a comprehensive review of existing literature and questionnaires. For a reproductive health behavior questionnaire, this resulted in 52 initial items [19].
- Content Validity Verification: A panel of experts (e.g., clinical specialists, subject matter experts, language experts) assesses the content validity of each item. The Item-level Content Validity Index (I-CVI) is calculated, and items failing to meet a predetermined threshold (e.g., above 0.80) are removed or revised [19].
- Pilot Study: A pilot test is conducted with a small sample from the target population to identify unclear items, assess response time, and refine the questionnaire layout [19].
- Psychometric Testing:
- Sample Size: Recruitment of a sample size sufficient for stable factor analysis, often aiming for 5-10 participants per item or a minimum of several hundred participants [19].
- Reliability: Internal consistency is tested using Cronbach's alpha, with a minimum threshold of 0.70 for new tools and 0.80 for established ones [3] [19].
- Validity:
- Exploratory Factor Analysis (EFA): Conducted to uncover the underlying factor structure. The Kaiser-Meyer-Olkin (KMO) measure and Bartlett's test of sphericity confirm data adequacy. Factors are selected based on eigenvalues greater than 1 and a scree plot [19].
- Confirmatory Factor Analysis (CFA): Performed to verify the model derived from the EFA. Model fit is assessed using absolute fit indices like χ2, SRMR, and RMSEA [19].
Implementation and Workflow Integration
For an ED safety checklist to be effective, its implementation must be carefully designed.
- Integration into Clinical Workflow: The checklist must be embedded into the existing electronic health record (EHR) or clinical workflow to ensure it is used at the point of care without causing significant disruption [31].
- Structured Guide for Critical Decisions: An example is the consensus guide for caring for adult patients with suicide risk, which includes a discharge planning checklist to assist ED professionals in making safe discharge decisions and setting up follow-up care [32].
Diagram 1: Tool Development and Validation Workflow. This diagram outlines the key phases and steps involved in the systematic development, validation, and implementation of a reliable checklist or questionnaire.
The Scientist's Toolkit: Key Research Reagent Solutions
The following reagents and materials are essential for executing the experimental protocols described above, particularly for the development and validation of EDC questionnaires, which share methodological principles with clinical checklist research.
Table 2: Essential Research Reagents and Materials for Tool Development and Validation
| Item Name | Function & Application | Example Use Case |
|---|---|---|
| Health Belief Model (HBM) | A theoretical framework for guiding questionnaire design; structures items to assess perceived susceptibility, severity, benefits, barriers, and self-efficacy [3]. | Serves as the conceptual foundation for a questionnaire on women's perceptions and avoidance of EDCs in personal care products [3]. |
| Content Validity Index (CVI) | A quantitative metric for evaluating how well individual items (I-CVI) and the entire scale (S-CVI) represent the defined construct, as rated by a panel of subject matter experts [19]. | Used to refine a 52-item pool for a reproductive health behavior survey, removing items failing to meet the 0.80 validity threshold [19]. |
| Cronbach's Alpha (α) | A statistical measure of internal consistency reliability, indicating the extent to which all items in a tool measure the same underlying construct [3] [19]. | Used to demonstrate strong reliability (α ≥ 0.80) across constructs (knowledge, risk perceptions, beliefs, avoidance) in a questionnaire about EDCs [3]. |
| Exploratory Factor Analysis (EFA) | A statistical method used to identify the underlying relationships between measured variables and to group items into distinct factors or constructs [19]. | Applied to survey responses from 288 participants to derive the final four-factor structure (e.g., health behaviors through food, skin) for a 19-item questionnaire [19]. |
| Confirmatory Factor Analysis (CFA) | A hypothesis-testing statistical technique used to confirm the pre-specified factor structure identified by EFA, assessing the model's goodness-of-fit to the data [19]. | Used to verify the structural validity of the four-factor model for reproductive health behaviors, using fit indices like SRMR and RMSEA [19]. |
| Structured Clinical Guide with Checklist | A consensus-based clinical tool that incorporates checklists to standardize decision-making for specific high-risk presentations in the ED [32]. | Provides a decision support tool and discharge planning checklist for emergency departments caring for adult patients at risk for suicide [32]. |
Diagram 2: Core Components for Tool Validation. This diagram visualizes the logical relationship between the core components, processes, and key metrics involved in validating a robust research tool.
The core components of a general ED safety checklist are most effective when they are action-oriented, integrated into clinical workflow, and developed through a rigorous, multi-stage validation process. The empirical finding that Task-oriented checklists more effectively reduce errors than those focused solely on Cognitive processes provides a critical insight for future checklist design [31]. The experimental protocols for systematic review and psychometric validation, supported by a toolkit of key research reagents, offer a robust scientific methodology. This comprehensive approach to improving diagnostic safety through structured checklists provides a powerful exemplar for researchers engaged in the complex task of developing and validating reliable assessment tools, such as those required for EDC questionnaire validation across diverse age populations.
This guide objectively compares the performance of the Pediatric Assessment Triangle (PAT) with other triage tools, presenting supporting experimental data within the broader context of validation science, a methodology directly applicable to EDC questionnaire research.
The Pediatric Assessment Triangle (PAT) is a rapid, equipment-free assessment tool used to identify critically ill or injured children. Its core function is to generate a quick, accurate general impression by visually and audibly assessing three key components: Appearance, Work of Breathing, and Circulation to the skin [33]. This 30-60 second assessment is designed for use in both prehospital and hospital emergency settings [33] [34].
Established triage systems like the Canadian Triage and Acuity Scale (CTAS), Emergency Severity Index (ESI), and Manchester Triage System (MTS) show "moderate to good" validity for identifying high and low-urgency patients, though their performance is "highly variable" [35]. The PAT is often integrated as the foundational "general impression" step in other scales, such as the Paediatric Canadian Triage and Acuity Scale (PaedCTAS) [33].
The following table summarizes key performance metrics from recent studies.
Table 1: Performance Metrics of the Pediatric Assessment Triangle (PAT)
| Study Context | Sensitivity (Range) | Specificity (Range) | Key Predictive Findings | Study Details |
|---|---|---|---|---|
| General Emergency Triage [33] | 77.4% - 97.3% | 22.9% - 99.15% | N/A | Scoping review of multiple studies (1999-2022). |
| Prehospital EMS Assessment [36] | N/A | N/A | PAT score ≥1 associated with 67.9x odds of ALS transport. PAT score ≥2 associated with 4.9x odds of ICU admission/surgery. | Retrospective cohort (n=2,929). |
| Predicting Hospitalization [34] | N/A | N/A | Area Under the ROC Curve (AUROC) of 0.966. | Single-center retrospective analysis (n=799). |
Experimental Protocols and Methodologies
A critical step in tool validation is understanding the experimental designs that generate performance data. The following workflows outline common methodologies for evaluating triage tools like the PAT and for validating research instruments like EDC questionnaires, highlighting their parallel structures.
Diagram 1: PAT Clinical Validation Workflow
Diagram 2: Questionnaire Validation Workflow
Key Clinical Validation Protocol
A 2025 retrospective study by Zhu et al. provides a clear protocol for PAT validation [34]:
- Population & Setting: 799 pediatric patients (0-18 years) at a single pediatric emergency department (PED).
- Tool Administration: A trained triage nurse performed the PAT assessment upon patient arrival. Nurses required at least 6 months of uninterrupted PED experience and formal PAT training.
- Outcome Measures: The primary outcome was the identification of critical cases (levels 1 & 2). PAT findings were correlated with specific outcomes including patient disposition (hospital admission), waiting time, and medical expenses.
- Data Analysis: The Area Under the Receiver Operating Characteristic (ROC) Curve (AUROC) was calculated to determine the PAT's accuracy in predicting hospitalization. An AUROC of 0.966 indicates excellent predictive ability [34].
Connecting to EDC Questionnaire Validation
The methodology for validating a clinical tool like the PAT shares core principles with validating a research questionnaire, such as one measuring knowledge and avoidance of Endocrine-Disrupting Chemicals (EDCs) [3]. Both processes require rigorous testing of reliability and validity.
- Tool Development: The PAT was developed based on clinical pathophysiology, whereas an EDC questionnaire would be developed through a literature review and structured by a theoretical framework like the Health Belief Model (HBM) to define constructs (knowledge, risk perceptions, behaviors) [3].
- Reliability Testing: In PAT studies, inter-rater reliability is key. For questionnaires, internal consistency is measured using statistics like Cronbach's alpha to ensure all items within a construct (e.g., "risk perception") reliably measure the same idea [3].
- Pilot Testing: PAT training is piloted with healthcare workers, parallel to piloting a questionnaire on a target sample (e.g., n=200 women for an EDC survey) to refine items and ensure clarity [3].
The Scientist's Toolkit: Research Reagent Solutions
This table details essential "research reagents" – the core components and methodologies – required for experiments in pediatric triage tool validation and related fields like EDC questionnaire development.
Table 2: Essential Reagents for Triage and Questionnaire Validation Research
| Item/Solution | Function in Research | Application Example |
|---|---|---|
| Trained Triage Nurse | Executes the tool (PAT) consistently according to protocol. | A nurse with >6 months PED experience and formal PAT training performs patient assessments [34]. |
| Standardized Data Abstraction Form | Ensures consistent, unbiased collection of outcome data from electronic health records (EHR). | Used to extract PAT scores, EMS/ED interventions, and final disposition for analysis [36]. |
| Statistical Analysis Software (e.g., SPSS, Python) | Performs statistical tests to calculate reliability, validity, and predictive value. | Used to compute sensitivity/specificity, AUROC, odds ratios, and Cronbach's alpha [34] [3]. |
| Validated Reference Standard | Serves as a proxy for "true" patient urgency or chemical exposure against which the new tool is measured. | Hospital admission/ICU transfer used as a proxy for true patient acuity [36] [34]. Urinary biomonitoring for EDCs validates exposure scores [37]. |
| Theoretical Framework (e.g., HBM) | Provides the conceptual structure for developing questionnaire items and interpreting results. | The Health Belief Model guides the creation of items measuring knowledge, risk perceptions, and behaviors regarding EDCs [3]. |
| Internal Consistency Metric (Cronbach's α) | Quantifies the reliability of a multi-item scale by measuring how closely related the items are as a group. | A Cronbach's alpha >0.7 indicates strong reliability for questionnaire constructs like "knowledge" or "avoidance behavior" [3]. |
The Geriatrics 5Ms framework is a person-centered model for providing comprehensive care to older adults. Originally developed by geriatricians in 2017, this framework offers a concise yet holistic approach that addresses the core domains of geriatric care: Mind, Mobility, Medications, Multicomplexity, and What Matters Most [38]. The 5Ms align with the Age-Friendly Health Systems initiative (which utilizes similar 4Ms, substituting Mentation for Mind and excluding Multicomplexity) and provide a structured methodology for clinicians to address the complex, multimorbid conditions common among older adult populations [38]. The framework supports a holistic, evidence-based approach to the medical, functional, and psychosocial complexities of aging, making it particularly valuable in clinical practice and research settings focused on older adults [39].
For researchers and drug development professionals, the 5Ms framework offers a standardized structure for evaluating interventions in aging populations. Its systematic approach ensures that critical geriatric domains are consistently assessed, enabling more meaningful comparisons across studies and populations. The integration of this framework into Electronic Data Capture (EDC) systems can significantly enhance the quality and relevance of data collected in clinical trials involving older adults, ensuring that outcomes measured align with the core priorities of geriatric care [39] [38].
The 5Ms Framework: Core Components and Clinical Applications
Detailed Framework Components
The five components of the 5Ms framework represent interconnected domains essential to geriatric assessment:
Mind: This domain encompasses the assessment and management of dementia, depression, and delirium. In clinical practice, this involves screening for cognitive impairment using validated tools, evaluating mood disorders, identifying delirium triggers, and implementing appropriate management strategies [39] [40]. The Mind domain recognizes that cognitive and mental health significantly influences treatment adherence, self-care capacity, and overall quality of life in older adults.
Mobility: This component focuses on preserving physical function and independence while reducing fall risk. Assessment includes evaluating intrinsic risk factors (such as orthostatic hypotension, balance issues) and extrinsic risk factors (unsafe home environments), identifying rehabilitation needs, and recommending adaptive equipment or assistance [39] [41]. Maintaining mobility is crucial for functional independence and directly impacts an older adult's ability to perform activities of daily living.
Medications: This domain emphasizes medication optimization, appropriate prescribing, and deprescribing of potentially inappropriate medications, particularly in the context of polypharmacy [39] [38]. It involves reviewing medication regimens for safety, evaluating for prescribing cascades, assessing adherence barriers, and aligning medications with overall goals of care, especially through deprescribing when appropriate.
Multicomplexity: This component addresses the reality that older adults often present with multiple chronic conditions, atypical disease presentations, frailty, complex biopsychosocial situations, and end-of-life considerations [39] [40]. It requires clinicians to navigate interacting comorbidities, consider prognosis in the context of frailty, and manage complex social circumstances that impact health outcomes.
Matters Most: This foundational domain focuses on identifying and incorporating the patient's personal goals, values, and preferences into care planning [39] [38]. This includes establishing goals of care, determining treatment priorities, addressing safety concerns (such as driving or living alone), and ensuring care aligns with what is most meaningful to the patient, including end-of-life preferences.
Interrelationship of the 5Ms
The 5Ms framework emphasizes the interconnectedness of its domains, where each component influences and is influenced by the others [38]. For example, medications prescribed for chronic conditions (Multicomplexity) may cause orthostatic hypotension, increasing fall risk (Mobility) and potentially leading to injury that further compromises independence (Matters Most). Similarly, cognitive impairment (Mind) can affect medication adherence (Medications) and the ability to manage multiple chronic conditions (Multicomplexity). This interconnectedness necessitates a holistic approach to assessment and intervention rather than addressing each domain in isolation.
The following diagram illustrates the dynamic relationships between the 5Ms components, with "Matters Most" appropriately positioned as the central, guiding principle:
Validation of the 5Ms Framework in Clinical and Educational Settings
Experimental Evidence for Framework Efficacy
Recent research has demonstrated the validity and feasibility of implementing the 5Ms framework across various healthcare settings. A 2023 study developed a case-based assessment using the geriatric 5Ms framework to evaluate internal medicine residents' geriatric medical expertise [39]. The assessment was aligned with undergraduate medical objectives and North American internal medicine milestones, providing a structured approach to assessing competency in geriatric care.
In this study, 68 first- to third-year internal medicine residents were randomly assigned to complete assessment and management plans for three of six geriatric cases within one hour during a mandatory academic session [39]. Two blinded educators rated performances on 5Ms dimensions and non-geriatric medical expertise using a 3-level rating scale. The results from 201 total cases demonstrated that all cases successfully integrated all 5Ms dimensions, with scores across these dimensions ranging from 0.8 to 1.3 (on a 0-2 scale), indicating partial assessment and management capabilities [39].
Critically, the study found that all 5Ms dimensions (mean=1.1, SD=0.3) scored significantly lower than non-geriatric medical expertise (mean=1.5; SD=0.3; t(64)=9.58; P<.001), highlighting specific gaps in geriatric-focused care competencies despite overall medical proficiency [39]. The assessment demonstrated moderate to strong interrater reliability (ICC=0.67-0.85, P<.001) and high face validity, with most residents rating the cases (88%) and the assessment itself (84%) as representative of clinical practice [39].
Quantitative Outcomes from 5Ms Implementation
Table 1: Experimental Outcomes of 5Ms Framework Implementation
| Study Focus | Population | Key Outcomes | Statistical Significance |
|---|---|---|---|
| Competency Assessment [39] | 68 Internal Medicine Residents | Significantly lower scores in 5Ms dimensions (mean=1.1) vs. non-geriatric medical expertise (mean=1.5) | t(64)=9.58; P<.001 |
| Interrater Reliability [39] | 2 Blinded Educators | Moderate to strong agreement across 5Ms dimensions | ICC=0.67-0.85, P<.001 |
| Educational Intervention [38] | Primary Care Residents | Increased confidence in applying 5Ms; interest in utilizing medication resources increased from 19% to 83% | N/A |
| Clinical Application [40] | Older Adults with HFrEF | Comprehensive management of multicomplexity including >85% with ≥2 chronic conditions | N/A |
Additional studies have shown promising implementation outcomes across diverse clinical settings. Educational initiatives using the 5Ms framework have demonstrated improved learner satisfaction and self-efficacy in managing geriatric patients [39]. One longitudinal pilot of an interactive case-based workshop for primary care residents found high satisfaction among participants and improved confidence in applying the elements of the 5Ms in older adult care, with interest in utilizing medication and pharmacy resources increasing from 19% prior to the workshop to 83% afterward [38].
In specialty care contexts, the 5Ms framework has been successfully applied to complex patient populations, including those with heart failure with reduced ejection fraction (HFrEF) [40]. This application has been particularly valuable for addressing multicomplexity, where more than 85% of patients present with two or more additional chronic conditions that complicate management and require careful prioritization of interventions [40].
Integration of the 5Ms Framework into EDC Systems
EDC System Requirements for 5Ms Implementation
The effective integration of the 5Ms framework into Electronic Data Capture (EDC) systems requires specific functionality to capture the multidimensional nature of geriatric assessment. Modern EDC systems must move beyond simple data collection to incorporate structured assessments across all five domains with appropriate validation checks to ensure data completeness and quality [42].
EDC systems optimized for geriatric research should include built-in checks for common geriatric scenarios, such as ensuring cognitive assessment when Mind domain abnormalities are noted, fall risk screening when Mobility issues are identified, and medication reconciliation processes for the Medications domain [42]. These systems should also facilitate the capture of patient-reported outcomes and goals, particularly for the Matters Most domain, which requires nuanced data collection that reflects individual patient preferences and values [38] [40].
The following workflow illustrates how the 5Ms framework can be integrated into EDC systems for comprehensive geriatric assessment:
Comparative Performance of EDC vs. Traditional Methods
Research has demonstrated significant advantages of EDC systems over paper-based methods for data collection in clinical research. A 2017 randomized controlled parallel group study conducted at a clinical research facility directly compared electronic case report forms (eCRF) with paper case report forms (pCRF) [43]. The study collected 90 records from 27 patients and 2 study nurses, reporting on the time required to report 2025 and 2037 field values respectively [43].
The results demonstrated that eCRF data collection was associated with significant time savings across all conditions (8.29 ± 5.15 minutes vs. 10.54 ± 6.98 minutes, p = .047) compared to paper-based methods [43]. Additionally, an average of 5.16 ± 2.83 minutes per CRF was saved due to data transcription redundancy when patients answered questionnaires directly in eCRFs [43]. Beyond time efficiency, the study found superior data integrity in the eCRF condition, with zero data entry errors compared to three errors in the paper-based group [43].
Table 2: EDC System Performance Comparison for Geriatric Data Collection
| Performance Metric | Electronic Data Capture (EDC) | Paper-Based Methods | Significance/Notes |
|---|---|---|---|
| Data Collection Time | 8.29 ± 5.15 minutes [43] | 10.54 ± 6.98 minutes [43] | p = .047 |
| Time Saved from Direct Data Entry | 5.16 ± 2.83 minutes per CRF [43] | N/A | Reduces transcription redundancy |
| Data Entry Errors | 0 errors [43] | 3 errors [43] | Improved data integrity |
| Implementation in Phase I Trials | 90% of trials by end of 2024 [42] | Declining use | Industry trend |
| Automated Validation Checks | Built-in range and logic checks [42] | Manual checks required | Reduces human error |
| Remote Access and Monitoring | Supported [42] | Physical access required | Particularly beneficial during COVID-19 |
Modern EDC systems offer additional advantages for geriatric research, including automated validation checks that can flag potentially inappropriate medication combinations common in older adults, range checks for physiological parameters that may differ in geriatric populations, and structured workflows that ensure comprehensive assessment across all 5Ms domains [42]. These systems also facilitate remote monitoring and data access, which was particularly valuable during the COVID-19 pandemic when in-person research activities were limited [42].
Research Reagent Solutions for Geriatric Assessment
Implementing the 5Ms framework in clinical research requires specific assessment tools and methodologies tailored to geriatric populations. The following table outlines essential resources and their applications in 5Ms-focused research:
Table 3: Essential Research Resources for 5Ms Framework Implementation
| Resource Category | Specific Tools/Assessments | Research Application | 5Ms Domain Addressed |
|---|---|---|---|
| Cognitive Assessment | Mini-Mental State Examination (MMSE), Montreal Cognitive Assessment (MoCA) [40] | Screening for cognitive impairment, dementia severity | Mind |
| Mood Assessment | Patient Health Questionnaire-9 (PHQ-9), Geriatric Depression Scale (GDS) [40] | Identifying depression in older adults | Mind |
| Functional Assessment | Activities of Daily Living (ADL), Instrumental ADL (IADL) scales [40] | Evaluating functional independence and mobility | Mobility |
| Fall Risk Screening | Timed Up and Go Test, fall history assessment [38] [41] | Identifying mobility limitations and fall risk | Mobility |
| Medication Review | Beers Criteria, STOPP/START criteria [38] | Identifying potentially inappropriate medications | Medications |
| Comorbidity Assessment | Charlson Comorbidity Index, Cumulative Illness Rating Scale [40] | Quantifying multicomplexity burden | Multicomplexity |
| Frailty Assessment | Fried Frailty Phenotype, Clinical Frailty Scale [40] | Evaluating biological age and vulnerability | Multicomplexity |
| Goals Assessment | Patient Priorities Care framework, advance care planning tools [38] | Eliciting and documenting health priorities | Matters Most |
| EDC System Features | Automated validation checks, audit trails, remote access [42] | Ensuring data quality and research efficiency | All domains |
Methodological Protocols for 5Ms Integration
Successful implementation of the 5Ms framework in research settings requires standardized methodological approaches. Based on validation studies, the following protocols are recommended:
For assessment design, researchers should develop case-based evaluations that simultaneously integrate all 5Ms dimensions, as demonstrated in the validation study where 201 cases each incorporated all five domains [39]. The assessment methodology should utilize a 3-level rating scale (0-2) for each domain, with blinded evaluation by multiple raters to ensure objectivity [39]. For EDC integration, systems should employ automated data quality checks that highlight errors or abnormalities in real-time, replacing manual checks that are prone to human error [42].
Data collection protocols should leverage the time efficiency of electronic data capture, recognizing that eCRF implementation saves approximately 2.25 minutes per form compared to paper methods, with additional time savings when patients enter data directly [43]. Research designs should also incorporate post-assessment evaluations to measure face validity and perceived clinical relevance among clinician researchers [39].
The Geriatric 5Ms framework provides a comprehensive, validated structure for assessing and managing the complex healthcare needs of older adults. The framework demonstrates strong feasibility and preliminary validity for evaluating geriatric medical expertise, with structured assessment revealing specific competency gaps in geriatric care despite overall medical proficiency [39]. Integration of the 5Ms into EDC systems enhances data quality, improves time efficiency compared to paper-based methods, and enables more comprehensive capture of patient-centered outcomes [43] [42].
For researchers and drug development professionals, the 5Ms framework offers a standardized methodology for evaluating interventions in geriatric populations, ensuring that critical domains relevant to older adults are systematically assessed. The structured approach facilitates more meaningful comparisons across studies and populations while maintaining focus on patient-centered outcomes, particularly through the Matters Most domain. As clinical research increasingly focuses on older adults with multiple chronic conditions, the integration of the 5Ms framework into EDC systems represents a methodological advance that aligns research practices with geriatric care priorities.
The integration of checklists into Emergency Department (ED) workflows represents a critical application of implementation science, particularly when framed within the context of Endocrine-Disrupting Chemical (EDC) questionnaire validation research. This guide compares implementation strategies for two distinct checklist types: a general ED Safety Checklist and a targeted EHR-based communication checklist for diagnostic uncertainty. The implementation efficacy of these tools is measured through their impact on patient safety, communication quality, and adherence to clinical protocols across diverse age groups—a methodological consideration paramount to EDC questionnaire validation studies that must account for age-specific physiological responses and exposure pathways [44] [45] [46].
Theoretical frameworks from implementation science provide essential guidance for integrating these tools. Normalization Process Theory (NPT) offers a structured approach to embedding new practices, emphasizing the importance of coherent implementation, cognitive participation, collective action, and reflexive monitoring [47]. Simultaneously, the distinction between implementation efficacy (performance under ideal conditions) and effectiveness (performance in real-world settings) provides a crucial continuum for evaluating checklist integration, with context being a fundamental determinant of success [48].
Comparative Analysis of ED Checklist Implementation
Table 1: Comparison of ED Checklist Implementation Approaches
| Feature | General ED Safety Checklist | Targeted EHR-Based Checklist for Diagnostic Uncertainty |
|---|---|---|
| Development Process | 3-round modified Delphi with 80 experts from 34 countries [44] | Protocol for pre-post effectiveness-implementation trial [45] |
| Scope & Application | 86 items across general safety and 5 domain-specific areas (handoff, procedures, triage, etc.) [44] | Uncertainty Communication Checklist + Uncertainty Discharge Document [45] |
| Implementation Strategy | Focused on leadership, information, empowerment, and service user involvement [47] | EHR-integrated via Best Practice Advisory (BPA) in Epic system [45] |
| Primary Outcomes Measured | Prevention of medical errors; improved team communication [44] | Patient uncertainty reduction; return ED visits [45] |
| Theoretical Foundation | Informed by NPT constructs [47] | Hybrid effectiveness-implementation design [45] |
| Contextual Adaptation | Designed for global applicability across LMICs and HICs [44] | Focuses on transitions of care for patients discharged without definitive diagnosis [45] |
| Validation Population | Multinational, multidisciplinary panel [44] | Planned 300 participants in pre-post trial [45] |
Implementation Protocols and Methodologies
Protocol 1: Delphi Consensus Development for General ED Safety Checklist
The development of the general ED Safety Checklist employed a rigorous three-round modified Delphi process to establish international expert consensus [44]:
Round 1 (Web-based Survey): 80 emergency medicine and patient safety experts from 34 countries rated proposed checklist items using a 5-point Likert scale. Consensus for inclusion required ≥80% combined agreement ("agree" or "strongly agree"). Participant demographics and hospital characteristics were collected to ensure diverse representation.
Round 2 (Web-based Survey): Items not reaching consensus in Round 1 were modified and re-rated using a 4-point Likert scale, maintaining the 80% agreement threshold. New items emerging from qualitative analysis of expert comments were also evaluated.
Round 3 (Online Consensus Meeting): Panel members finalized the checklist through structured discussion of remaining items, with asynchronous participation options to ensure global inclusion. The final checklist contained 86 items divided into general safety and domain-specific components.
This methodology achieved balanced representation between low- and middle-income countries (46%) and high-income countries (54%), with most panelists (85%) practicing in academic medical centers [44].
Protocol 2: Hybrid Effectiveness-Implementation Trial for Diagnostic Uncertainty Checklist
The Targeted EHR-based Communication about Uncertainty (TECU) strategy employs a pre-post trial design to evaluate both implementation success and intervention effectiveness [45]:
Study Population: 300 ED patients discharged with diagnostic uncertainty (approximately 37% of all ED discharges).
Intervention Components:
- Uncertainty Communication Checklist: Guides clinicians in addressing topics of chief concern for patients discharged with diagnostic uncertainty.
- Uncertainty Discharge Document: Patient-facing material explaining the concept of diagnostic uncertainty and providing guidance for ongoing symptom management.
Implementation Approach: The intervention is integrated into routine ED discharge workflows through the Epic EHR system using a Best Practice Advisory (BPA), ensuring systematic application rather than reliance on individual clinician initiative.
Outcome Measures:
- Effectiveness Outcomes: Patient-reported uncertainty levels and 30-day return ED visits.
- Implementation Outcomes: Adoption rates, fidelity to the intervention, and identification of barriers and facilitators to sustainable implementation.
This hybrid design simultaneously assesses clinical effectiveness and implementation strategy, providing insights for broader scalability [45].
Integration with EDC Questionnaire Validation Research
The implementation of checklists in ED settings shares methodological parallels with EDC questionnaire validation across different age groups. Both require:
Age-Stratified Validation: EDC research must account for age-specific metabolic pathways and exposure sources [46]. Similarly, ED checklist implementation must consider age-related differences in communication needs and health literacy, particularly when discharging patients with diagnostic uncertainty [45].
Biomarker Correlation: EDC questionnaire validation requires correlation with biological samples (e.g., urinary paraben concentrations) [46]. ED checklist validation correlates process measures (checklist completion) with patient outcomes (return visits, uncertainty reduction) [45].
Socioeconomic Considerations: EDC exposure studies reveal significant variations by income and education levels [46]. ED checklist implementation must address how socioeconomic factors affect patient comprehension of discharge instructions and ability to adhere to follow-up recommendations.
The integration of EHR systems provides a technological bridge between these domains, enabling structured data capture for both clinical checklist implementation and EDC exposure assessment [45] [49].
Implementation Pathways and Workflows
Implementation Pathway for ED Checklists
The implementation pathway illustrates the transition from ideal (efficacy) to real-world (effectiveness) conditions, acknowledging that most implementations operate somewhere along this continuum rather than at either extreme [48].
Normalization Process Theory Application
Normalization Process Theory provides a framework for understanding how checklist practices become embedded in routine workflow. The theory emphasizes four core constructs: coherence (making sense of the intervention), cognitive participation (engaging with the intervention), collective action (implementing the work), and reflexive monitoring (appraising the outcomes) [47].
The Scientist's Toolkit: Research Reagents and Essential Materials
Table 2: Essential Research Materials for Implementation Science in Clinical Settings
| Tool/Resource | Function/Purpose | Application in ED Checklist Research |
|---|---|---|
| Electronic Health Record (EHR) System | Platform for integrating checklist tools into clinical workflow | Hosts Best Practice Advisories (BPAs) for diagnostic uncertainty protocols [45] |
| System Usability Scale (SUS) | Validated questionnaire measuring usability of systems or tools | Assesses usability of EHR-integrated checklists and patient-facing materials [50] |
| Delphi Method Protocol | Structured communication technique for achieving expert consensus | Develops checklist content through iterative rating and feedback rounds [44] |
| Normalization Process Theory (NPT) Coding Manual | Qualitative framework for analyzing implementation processes | Identifies barriers and facilitators to checklist normalization in practice [47] |
| Implementation PRECIS Tool | Continuum indicator for efficacy-effectiveness positioning | Helps design implementation strategies appropriate for real-world ED settings [48] |
| Mixed Methods Data Collection | Combined quantitative and qualitative assessment | Provides comprehensive evaluation of implementation outcomes and clinical effectiveness [45] [50] |
| Biomarker Assay Kits | Laboratory analysis of biological samples | Validates EDC exposure questionnaires in parallel age-stratified studies [46] [51] |
| REDCap/Electronic Data Capture (EDC) | Web-based application for research data management | Captures and manages implementation fidelity data and patient outcomes [49] |
The successful integration of checklists into ED workflows requires careful attention to both the technical aspects of the tools themselves and the implementation strategies employed to embed them in practice. The comparative analysis presented in this guide demonstrates that while general safety checklists and targeted communication checklists serve different purposes, both benefit from rigorous development methodologies and theoretically-informed implementation approaches.
The connection to EDC questionnaire validation research highlights the importance of age-stratified validation and socioeconomic consideration in both domains. Implementation frameworks like Normalization Process Theory and the efficacy-effectiveness continuum provide essential guidance for navigating the complex interplay between intervention design, contextual factors, and sustainable integration into routine care [47] [48].
Future directions should explore how emerging technologies, including artificial intelligence and advanced EHR functionalities, can support adaptive implementation that responds to real-time workflow demands while maintaining fidelity to evidence-based practices [52].
Overcoming Practical Challenges in Checklist Deployment and Adherence
Identifying and Mitigating Barriers to Staff Adoption and Engagement
Validated questionnaires are fundamental tools in environmental health research for assessing exposure to endocrine-disrupting chemicals (EDCs) across different age groups. The reliability of this research depends critically on the consistent and accurate engagement of research staff who administer these instruments. However, significant barriers often impede staff adoption of new protocols and technologies, potentially compromising data quality in studies investigating the links between EDCs and health outcomes such as impaired spirometry, neurocognitive function, and reproductive health [14] [53] [54]. This guide examines these barriers through the lens of EDC questionnaire validation research, providing comparative data on implementation strategies and their outcomes to help research teams optimize staff engagement and protocol adherence.
Comparative Analysis of Implementation Challenges and Solutions
The integration of new research protocols and digital tools faces predictable yet often underestimated hurdles. The table below synthesizes key barriers and validated remediation strategies drawn from clinical research and public health fieldwork.
Table 1: Barriers to Staff Adoption and Engagement in Research Settings
| Barrier Category | Specific Challenge | Recommended Remediation Strategy | Evidence of Effectiveness |
|---|---|---|---|
| Technical Proficiency | Lack of personnel with knowledge about EHR data and credentials to test new systems [55]. | Cross-train research coordinators or data managers with EHR expertise in new systems [55]. | Reduced setup times and improved data accuracy in implemented sites. |
| Workflow Integration | Competing clinical priorities for Health Information Technology effort [55]. | Secure extramural funding with a local PI or informatician to champion implementation [55]. | Median implementation time of 8 months for CDIS integration, versus over 4 years without [55]. |
| Regulatory Compliance | Institutional Review Board requiring blocked access to data not specified in research application [55]. | Emphasize that users only access data they already have in EHR; implement training on accountable data use [55]. | Successful implementation at 77 institutions worldwide using this accountability framework [55]. |
| Data Management | Perception that all study data must be obtainable from the EHR for all participants for a system to be useful [55]. | Demonstrate accuracy and efficiency improvements for data subsets through published comparison studies [55]. | Increased adoption following evidence-based demonstrations of utility. |
| Participant Engagement | Researchers may not properly use data pulled from source systems nor know how to map data properly [55]. | Implement training or paid consultations for users by informatics professionals [55]. | Improved protocol adherence and data quality in research cohorts [3]. |
Experimental Protocols for Questionnaire Validation and Engagement Metrics
Methodological rigor in assessing both research instruments and implementation success is critical. Below are detailed protocols from recent studies on EDC exposure and staff-mediated data collection.
Protocol 1: Tool Development and Reliability Testing for EDC Exposure Assessment
This methodology was used to develop a questionnaire assessing women's perceptions and avoidance of EDCs in personal and household products [3].
- Questionnaire Development: Conduct a comprehensive literature review to identify commonly studied EDCs, vulnerable populations, and relevant survey items. Structure the questionnaire using a theoretical framework (e.g., Health Belief Model) to assess knowledge, health risk perceptions, beliefs, and avoidance behaviors for six target EDCs (lead, parabens, BPA, phthalates, triclosan, and perchloroethylene) [3].
- Instrument Design: Employ Likert scales (e.g., 6-point for perceptions, 5-point for behaviors) including neutral midpoint and 'unsure' options to improve response accuracy and discourage guessing [3].
- Participant Recruitment: Focus on the target demographic for the research question (e.g., women aged 18-35 for a study on prenatal exposure). Distribute the questionnaire to 200 participants via in-person events and online channels [3].
- Reliability Testing: Assess the internal consistency of each construct (knowledge, perceptions, beliefs, behaviors) using Cronbach's alpha. A value >0.7 indicates strong reliability for the construct [3].
Protocol 2: Assessing Associations Between PCP Use and EDC Exposure
This protocol from the Taiwan Maternal and Infant Cohort Study (TMICS) measures the association between product use and biological exposure levels [54].
- Cohort Recruitment: Enroll participants during routine clinical visits (e.g., third-trimester antenatal examinations). Apply exclusion criteria for systemic diseases or chronic medication use [54].
- Data Collection: Administer a detailed questionnaire on the frequency of use for rinse-off (shampoo, body wash) and leave-on (lotion, makeup) personal care products. Standardize responses to uses per week [54].
- Biological Sampling: Collect urine samples for analysis of EDC metabolites (e.g., BPA, methylparaben, ethylparaben). Treat concentrations below the limit of detection as LOD/√2 [54].
- Statistical Analysis: Use linear regression with ln-transformed EDC concentrations as the dependent variable. Adjust for confounders like age, income, education, BMI, and region. Express results as the percentage change in concentration per additional product use per week [54].
Implementation Fidelity Metrics
To gauge staff adoption success, research leads should track:
- Time to Competency: The median time for research staff to achieve proficiency with a new protocol or system (e.g., 8 months for full CDIS implementation in successful cases) [55].
- Adoption Rate: The percentage of intended end-users actively utilizing a new system (e.g., 77 institutions out of 7202 using REDCap CDIS) [55].
- Data Quality Indicators: The frequency of data entry errors, protocol deviations, and missing data points before and after implementing new training or tools.
Visualization of Workflows and Relationships
The following diagrams illustrate the key processes and relationships involved in questionnaire validation and implementation.
Questionnaire Validation and Analysis Workflow
Factors Influencing Staff Adoption
The Scientist's Toolkit: Essential Research Reagents and Materials
Successful EDC questionnaire validation and biological correlation studies require specific materials and protocols. The table below details essential components for field and lab work.
Table 2: Essential Research Materials for EDC Questionnaire Validation Studies
| Item Name | Function/Application | Implementation Example |
|---|---|---|
| Validated Questionnaire Instrument | Assesses knowledge, risk perceptions, beliefs, and avoidance behaviors related to target EDCs. | A 24-item tool based on the Health Belief Model, tested for internal consistency (Cronbach's alpha >0.7) across constructs [3]. |
| Biological Sample Collection Kits | Standardized collection of urine samples for EDC metabolite analysis. | Kits including sterile cups, cold storage, and protocols for midstream clean-catch urine collection [53] [54]. |
| Liquid Chromatography-Mass Spectrometry (LC-MS/MS) | Quantifies urinary concentrations of EDC metabolites (e.g., phthalates, parabens, BPA). | Used to measure mono-(2-ethylhexyl) phthalate (MEHP) levels associated with cognitive impairment (8.511 vs. 6.432 µg/g creatinine, p=0.038) [53]. |
| Electronic Data Capture (EDC) System | Streamlines data collection, manages multi-site studies, and ensures regulatory compliance. | Platforms like REDCap, OpenClinica, or Viedoc used for building surveys, managing databases, and pulling EHR data via FHIR [55] [56]. |
| Data Integration Tools (FHIR APIs) | Enable seamless extraction of EHR data into research databases, reducing manual entry errors. | REDCap's CDIS module pulling over 62 million data points for 168,051 records at VUMC, solving the "swivel-chair problem" [55]. |
Overcoming barriers to staff adoption and engagement in EDC questionnaire validation research requires a multifaceted approach that addresses technical, operational, and human factors. Evidence indicates that successful implementation hinges on strategic cross-training, dedicated championing of new tools, clear accountability frameworks, and demonstrable proofs of utility [55]. By applying the structured comparison data, experimental protocols, and implementation strategies outlined in this guide, research teams can enhance staff engagement, improve data quality, and strengthen the validity of findings in environmental health research across diverse age cohorts. The integration of robust validated questionnaires with biological exposure metrics creates a powerful framework for advancing our understanding of EDC impacts on human health.
Adapting Checklists for Resource-Limited and Diverse International Settings
The validation of Electronic Data Capture (EDC) questionnaires across different age groups in global clinical research presents unique methodological challenges. In resource-limited settings, where infrastructure constraints, cultural diversity, and varying literacy levels complicate standardized data collection, adapting research instruments becomes critical for data integrity. This guide examines the adaptation of checklists and EDC systems for diverse international environments, comparing implementation approaches and their relative effectiveness for researchers conducting multinational studies across age demographics.
Comparative Analysis of Checklist Implementation Strategies
The table below summarizes key findings from recent studies on checklist implementation in resource-limited settings, providing quantitative comparisons of effectiveness:
Table 1: Comparison of Checklist Implementation Outcomes in Resource-Limited Settings
| Implementation Aspect | Pre-Intervention Performance | Post-Intervention Performance | Key Success Factors |
|---|---|---|---|
| Overall Checklist Adherence | 37% of cases showed good adherence (>60%) [57] | 98.8% of cases showed good adherence [57] | Comprehensive training; cultural adaptation [57] |
| Mean Adherence Score | 51.6% (SD = 29.6) [57] | 94.1% (SD = 8.2) [57] | Tailored implementation strategies [57] |
| Team Communication | Variable and inconsistent [57] | Significantly improved (p < 0.001) [57] | Enhanced team dynamics through structured interaction [57] |
| Critical Safety Checks | Inconsistent performance across items [57] | Significant improvements in patient identity confirmation, site marking, anesthesia checks (p < 0.001) [57] | Standardized verification processes [57] |
| Implementation Approach | Training-Based Adaptation [57] | Cultural & Contextual Adaptation [58] | Technology-Facilitated Adaptation [59] |
| Required Resources | Moderate (training materials, personnel time) [57] | Low to moderate (community engagement, local customization) [58] | High (hardware, software, technical support) [59] |
| Key Advantage | Rapid improvement in adherence [57] | Enhanced sustainability and local buy-in [58] | Automated data quality checks; real-time monitoring [59] |
Experimental Protocols for Checklist Validation
Protocol 1: Pre- and Post-Intervention Training Model
A structured training intervention demonstrated significant improvements in surgical safety checklist adherence across 15 hospitals in Mogadishu, Somalia [57]. The methodology encompassed:
- Study Design: Pre- and post-intervention assessment with data collection over two phases (pre-intervention: April 12-May 4, 2024; post-intervention: May 12-June 3, 2024) [57]
- Participant Training: Comprehensive training program for surgical teams including practical demonstrations, interactive discussions, and instructional materials over one week, followed by a dissemination period where trained staff educated colleagues [57]
- Data Collection: Trained observers (regular surgical team members) documented adherence to checklist items across three phases: before anesthesia (sign-in), before incision (time-out), and before patient left operating room (sign-out) [57]
- Adherence Measurement: Percentage-based adherence scoring with >60% categorized as "good adherence" using descriptive statistics, McNemar's test, and binary logistic regression [57]
Protocol 2: Quality Improvement (PDSA) Framework
The Plan-Do-Study-Act (PDSA) model provides a systematic approach for adapting checklists in variable-resource settings [58]:
- Plan Phase: Identify critical process gaps through cause-and-effect process mapping (e.g., Ishikawa diagrams) to engage providers at all educational levels and ensure staff buy-in [58]
- Do Phase: Implement checklists designed to ensure standardized, high-quality care and team communication, with rigorous site-specific testing [58]
- Study Phase: Analyze data on checklist effectiveness across the six domains of healthcare quality: safety, effectiveness, efficiency, patient-centeredness, timeliness, and equity [58]
- Act Phase: Refine checklist implementation based on performance data, focusing on adaptability to unique medical and socio-cultural needs of each setting [58]
Visualization of Checklist Adaptation Workflow
Checklist Adaptation Workflow
The Researcher's Toolkit: Essential Solutions for International EDC Studies
Table 2: Essential Research Reagent Solutions for International EDC Studies
| Tool/Solution | Primary Function | Considerations for Resource-Limited Settings |
|---|---|---|
| REDCap (Research Electronic Data Capture) | Secure web-based platform for data collection [60] | Free for academic institutions; supports offline data collection; ideal for low-budget studies [60] |
| Mobile EDC Applications | Tablet/smartphone-based data collection [59] | Select rugged devices with long battery life; ensure offline synchronization capability [59] |
| Uninterruptible Power Supply (UPS) | Continuous conditioned power for equipment [59] | "On-line" UPS types provide best power conditioning in areas with unstable electricity [59] |
| Backup Systems | Data protection and emergency recovery [59] | Tape solutions remain most practical for backups in low-bandwidth environments [59] |
| FHIR-Based Integration | Standardized EHR-to-EDC data transfer [61] | Requires FHIR-compliant EHR systems; enables real-time data visibility [61] |
| Local Area Network Management | Network performance optimization [59] | Cloud-managed routers allow traffic prioritization for research applications [59] |
| Multilingual Interface Support | Participant-facing data collection [60] | Essential for global trials; must support non-Latin scripts and right-to-left languages [60] |
Successful adaptation of checklists and EDC questionnaires for resource-limited and diverse international settings requires a multifaceted approach that balances standardization with necessary localization. Evidence indicates that comprehensive training interventions can dramatically improve checklist adherence, from 37% to 98.8% as demonstrated in recent studies [57]. The integration of appropriate technology solutions with robust cultural adaptation processes enables researchers to maintain data integrity while accommodating infrastructure limitations. Future efforts should focus on developing standardized yet flexible validation frameworks that can be systematically applied across diverse age groups and cultural contexts, particularly as EHR-to-EDC automation becomes increasingly prevalent in global clinical trials [61].
Ensuring Usability and Preventing Checklist Fatigue in High-Acuity Environments
In clinical research, Electronic Data Capture (EDC) systems have become indispensable tools for data collection and management. However, their implementation in high-acuity environments—settings where researchers face intense time pressure, complex protocols, and cognitive overload—introduces a critical challenge: balancing comprehensive data collection with user-centered design to prevent checklist fatigue. This phenomenon, characterized by desensitization and reduced responsiveness due to overwhelming or poorly designed interfaces, poses a significant threat to data quality and research integrity [62] [63].
The validation of EDC questionnaires across different age groups adds further complexity, as usability requirements can vary significantly between older clinicians, adult researchers, and younger study coordinators. This guide objectively compares the performance of various EDC approaches and technologies, providing experimental data to help research professionals select optimal solutions for their specific high-stakes environments.
Comparative Analysis of EDC Usability and Performance
The table below summarizes key experimental findings from studies comparing different EDC technologies and methodologies, highlighting their performance in usability, efficiency, and error reduction.
Table 1: Experimental Performance Comparison of Data Capture Methods
| Technology/Method | Usability Score (SUS) | Data Entry Speed | Error Reduction | Key Findings |
|---|---|---|---|---|
| REDCap Mobile App | 74 ("Good") [64] | Not Specified | Not Specified | Lay user group handled the app well; positive technology acceptance [64] |
| EHR-to-EDC Integration | 4.6/5 (Ease of Use) [65] | 58% more data points entered [65] | 99% reduction (vs. manual) [65] | Strong user satisfaction; preferred over manual entry [65] |
| Manual Data Entry | Not Specified | Baseline (3023 data points/hour) [65] | Baseline (100 errors) [65] | Time-consuming and error-prone [65] |
Experimental Protocols and Validation Methodologies
Validating EDC Systems for Lay User Groups
Objective: To evaluate the usability of the REDCap mobile app as an offline EDC option for a lay user group and examine the necessary technology acceptance for using mobile devices for data collection [64].
Methodology:
- Design: An exploratory mixed-method design was employed.
- Usability Testing: An on-site usability test was conducted using the "Thinking Aloud" method, where participants verbalize their thought processes while interacting with the system. This was combined with an online questionnaire including the standardized System Usability Scale (SUS) [64].
- Technology Acceptance: Surveyed based on five categories of the technology acceptance model (TAM) to assess openness to using mobile devices as interview tools [64].
- Procedure: Participants were provided with a tablet (Apple iPad Air 2) with the REDCap app pre-installed. A dummy registry project with a test questionnaire was used, which included a subset of questions from the original research questionnaire and utilized all relevant field types (textbox, drop-down list, radio buttons, etc.) [64].
Quantifying the Workflow Advantages of EHR-to-EDC
Objective: To compare the speed and accuracy of EHR-to-EDC enabled data entry versus traditional, manual data entry in a time-controlled setting [65].
Methodology:
- Design: A within-subjects study where each data manager performed both manual and EHR-to-EDC data entry.
- Participants: Five data managers with 9 months to over 2 years of experience were assigned to clinical trials within their disease area of expertise [65].
- Procedure: Each participant performed one hour of manual data entry, and a week later, one hour of data entry using IgniteData's EHR-to-EDC solution (Archer). The sessions were virtual and used a predetermined set of patients, timepoints, and data domains (labs, vitals) [65].
- Data Analysis: The data entered into the EDC were exported and compared side-by-side to evaluate the total number of data points and the number of errors. A user satisfaction survey using a 5-point Likert scale collected feedback on learnability, ease of use, perceived time savings, perceived efficiency, and preference [65].
The following table details key solutions and their functions for developing and validating effective EDC systems.
Table 2: Essential Research Reagents and Solutions for EDC Implementation
| Tool/Solution | Function | Relevance to Usability & Fatigue |
|---|---|---|
| System Usability Scale (SUS) | A reliable, standardized questionnaire for measuring the perceived usability of a system. | Provides a quick, quantitative measure of overall usability, allowing for benchmarking against established norms [64]. |
| "Thinking Aloud" Protocol | A qualitative usability testing method where users verbalize their thoughts and feelings while interacting with an interface. | Directly reveals usability issues, confusion points, and potential sources of frustration or fatigue that may not be captured by surveys alone [64]. |
| Technology Acceptance Model (TAM) | A theoretical model for understanding how users come to accept and use a technology. | Assesses users' openness to new tools, helping to anticipate and address adoption barriers [64]. |
| MEDCF Usability Checklist | A validated set of 30 evaluation questions for designing Mobile Electronic Data Capturing Forms. | Provides actionable design criteria across form content, layout, input process, error handling, and submission to preemptively reduce user burden [66]. |
| EHR-to-EDC Middleware | Technology that enables electronic transfer of participant data from the EHR to an EDC system. | Dramatically reduces manual transcription tasks, a major source of workload, errors, and fatigue [65]. |
A Framework for Preventing Checklist Fatigue in EDC Design
Checklist fatigue in high-acuity environments shares similarities with alarm fatigue in clinical settings, where excessive exposure to non-actionable alarms leads to desensitization and delayed responses [62] [63]. The following diagram illustrates the negative cycle of checklist fatigue and the mitigating role of user-centered design, informed by the principles of effective alarm management [63].
The framework above shows how poor EDC design leads to a negative cycle of checklist fatigue, which can be mitigated by targeted, user-centered strategies. These strategies are supported by experimental evidence:
- Simplify Form Content: The MEDCF Usability Checklist emphasizes using appropriate language and distinguishing between mandatory and optional fields to reduce cognitive load [66].
- Optimize Form Layout: A validated design principle is to create an intuitive layout that maps to the user's mental model, for instance, by designing electronic forms that are analogous to familiar paper forms to quicken understanding [66].
- Streamline Input and Validation: Integration technologies like EHR-to-EDC drastically reduce manual input, which is a primary source of errors and frustration. One study showed a 99% reduction in data entry errors with this method [65].
Ensuring usability and preventing checklist fatigue in high-acuity environments is a critical factor for the success of modern clinical research. The experimental data and comparisons presented in this guide demonstrate that solutions like the REDCap mobile app for offline lay-user data collection and advanced EHR-to-EDC integrations for operational efficiency offer significant, quantifiable advantages over traditional manual entry.
Future trends point toward greater integration of Artificial Intelligence (AI) to further streamline data analysis and patient recruitment, the proliferation of mobile EDC solutions to enhance patient engagement and data quality at the source, and the rise of decentralized clinical trials facilitated by these robust digital tools [67]. For researchers, scientists, and drug development professionals, prioritizing user-centered design and leveraging these technological advancements is not merely an operational improvement but a fundamental component in safeguarding data integrity and the overall validity of research outcomes across all age groups.
The Plan-Do-Study-Act (PDSA) cycle serves as a fundamental framework for conducting iterative, data-driven improvement in clinical research settings. As a core component of the Model for Improvement developed by Associates in Process Improvement, this structured approach enables research teams to test changes on a small scale before full implementation, thereby reducing risk and optimizing processes efficiently [68]. The application of PDSA is particularly valuable in the precise field of Electronic Data Capture (EDC) questionnaire validation, where ensuring data integrity, participant comprehension, and methodological rigor across diverse age groups is paramount.
For researchers, scientists, and drug development professionals, the PDSA cycle provides a disciplined mechanism to enhance the quality and reliability of validation studies. When validating EDC questionnaires across different age cohorts—such as older adults who may have different technology acceptance patterns compared to younger users—iterative testing allows researchers to refine instrument delivery, improve user interface design, and validate comprehension in real-time [69]. This article examines how PDSA methodologies integrate with experimental protocols for questionnaire validation, providing a structured pathway for continuous quality enhancement in clinical research operations.
The PDSA Framework: Core Components and Workflow
The PDSA cycle consists of four distinct stages that form a iterative improvement loop. When properly executed, this framework enables research teams to systematically investigate and implement changes while maintaining scientific rigor.
The Four Stages of PDSA
Plan: In this initial phase, teams clearly define the objective of the change and develop a plan for testing it. This includes formulating predictions of expected outcomes, developing a data collection plan, and outlining the specific steps for the test. For EDC questionnaire validation, this might involve planning a small-scale test of a new comprehension check for older adult participants [68] [70].
Do: During this stage, the team implements the plan on a small scale while carefully documenting the process, observing outcomes, and collecting data. This phase may reveal unforeseen problems or opportunities, which should be recorded for analysis. In research contexts, this might involve deploying a modified EDC questionnaire to a limited participant cohort while closely monitoring user interactions [70] [71].
Study: In this critical analysis phase, teams compare the collected data against predictions made during the planning stage, study the results for patterns and lessons learned, and summarize what was discovered. For validation studies, this typically involves statistical analysis of response patterns and comparison with pre-defined success metrics [68] [70].
Act: Based on the findings from the study phase, teams decide whether to adopt, adapt, or abandon the change. This may lead to standardizing the change if successful, modifying the approach for further testing, or abandoning the change if it proves ineffective. This decision point determines the direction of the next PDSA cycle [70] [72].
PDSA Workflow Visualization
The following diagram illustrates the continuous, iterative nature of the PDSA cycle within the context of EDC questionnaire validation:
Experimental Protocols for PDSA in EDC Validation
Implementing PDSA cycles within EDC questionnaire validation requires structured experimental protocols that maintain scientific integrity while allowing for iterative refinement. The following section outlines key methodological approaches with supporting experimental data.
Comparative Study Design for Age-Specific Validation
Research by Danielsen et al. (2018) demonstrates a protocol for validating the Exercise and Eating Disorder (EED) questionnaire across different demographic groups, providing a template for EDC validation studies [73]. Their methodology included:
Participant Stratification: The study included 258 male participants (55 eating disorder patients and 203 student controls) with clearly defined inclusion criteria. This controlled approach enables comparative analysis between clinical and non-clinical populations [73].
Cross-Sectional Assessment: Researchers administered the EED questionnaire alongside established instruments like the Eating Disorder Examination Questionnaire (EDE-Q) to assess convergent validity. This multi-method approach strengthens validation through triangulation [73].
Statistical Analysis: The team employed principal component analysis to examine factor structure, t-tests to compare group differences, and correlation analyses to establish psychometric properties. This comprehensive analytical plan provides robust validation metrics [73].
The experimental results demonstrated the EED questionnaire had adequate psychometric properties, with a four-factor solution identified through principal component analysis. The questionnaire successfully discriminated between patients and controls on the global score, subscales, and 16 out of 18 individual items (p < .01 - < .001). Convergent validity was established through high correlations between the EED questionnaire and the eating disorder examination questionnaire (r = .65) [73].
Age-Group Comparison Methodology
A 2020 study on technology acceptance across age groups provides another relevant protocol for EDC validation research [69]. The experimental design included:
Stratified Recruitment: The researchers recruited two distinct age groups (15 participants aged 18-24 years and 15 participants aged 65+ years) with prior experience using activity tracking devices for at least two months [69].
Semi-Structured Interviews: The team conducted in-depth interviews to explore participants' experiences with activity trackers, including acquisition, learning processes, usage patterns, and support resources [69].
Comparative Analysis: Interview transcripts were analyzed to identify thematic differences between age groups, particularly regarding technology acceptance factors and perceived ease of use [69].
The results revealed significant age-based differences in technology adoption. The phase of "perceived ease of learning" emerged as a significant factor only in the older participant group, while social influence affected older participants positively but younger participants negatively [69]. These findings highlight the critical importance of age-specific validation for EDC tools.
Electronic Data Capture Performance Assessment
A comprehensive study comparing EDC with conventional data collection methods provides quantitative performance data relevant to questionnaire validation [74]. The experimental protocol featured:
Graeco-Latin Square Design: This efficient study design allowed simultaneous adjustment for three confounding factors: interviewer, interviewee, and interview order. The design was replicated three times to ensure adequate statistical power [74].
Multiple Technology Platforms: The study compared four EDC methods (netbook, PDA, tablet PC, and telephone interview) against conventional paper-based data collection using a standardized questionnaire [74].
Accuracy Assessment: Researchers used pre-populated questionnaires with known answers as a gold standard to calculate error rates for each data capture method [74].
The resulting performance data, summarized in the table below, provides critical benchmarking information for researchers selecting EDC platforms for validation studies.
Table 1: EDC Method Performance Comparison [74]
| Data Capture Method | Error Rate % (Final Study Week) | 95% Confidence Interval | Time Efficiency |
|---|---|---|---|
| Conventional Paper-based | 3.6% | 2.2-5.5% | Baseline |
| Netbook EDC | 5.1% | 3.5-7.2% | Slightly longer interviews but faster database lock |
| Tablet PC EDC | 5.2% | 3.7-7.4% | Slightly longer interviews but faster database lock |
| PDA EDC | 7.9% | 6.0-10.5% | Slightly longer interviews but faster database lock |
| Telephone EDC | 6.3% | 4.6-8.6% | Slightly longer interviews but faster database lock |
Implementing PDSA for EDC Questionnaire Validation
The integration of PDSA methodology into EDC questionnaire validation requires strategic planning and execution. The following section outlines practical implementation strategies supported by case examples.
PDSA Implementation Framework for Research Settings
Successful implementation of PDSA cycles in research environments depends on several critical factors:
Small-Scale Testing: PDSA relies on properly executed, small-scale tests before scaling to larger trials. This belief stems from the understanding that small-scale projects create more controlled environments, allowing for more agile adjustments when observing favorable or unfavorable outcomes [70].
Structured Iteration: A common challenge in PDSA implementation is the oversimplification of the process, which can lead to projects not fully adhering to PDSA principles. Proper implementation requires adequate mobilization of resources and skills to maintain scientific rigor [70].
EHR Integration Maturity: Research by Tobias (2021) demonstrates that the maturity of Electronic Health Record (EHR) operations significantly impacts PDSA effectiveness. The Clinical Decision Support (CDS) Maturity Model identifies three key pillars that enhance PDSA cycles: Content Creation (ensuring evidence-based guidelines), Analytics & Reporting (evaluating performance), and Governance & Management (managing stakeholder involvement) [71].
Case Example: National PEWS Implementation
A 2025 study on implementing a national Dutch Paediatric Early Warning Score (PEWS) system across 12 hospitals provides a compelling real-world example of PDSA application in healthcare research [72]. The implementation followed a structured PDSA framework:
Plan Phase: The research collective formulated comprehensive implementation strategies across multiple levels: outer setting (macro level), inner setting (meso level), and individuals (micro level). This included collaboration with national care associations, establishing local project leaders, and developing training materials [72].
Do Phase: The Dutch PEWS was implemented across diverse hospital contexts, including general hospitals, large teaching hospitals, and University Medical Centers. Implementation included local adaptation of the system to fit specific clinical contexts while maintaining core components [72].
Study Phase: Researchers collected data through 1,127 questionnaires and 171 interviews with healthcare providers, plus additional interviews with project leaders. They calculated a Protocol Adherence Percentage (PAP) for each hospital as an implementation indicator [72].
Act Phase: The overall PAP was 81% (±25%), ranging from 47% to 140% across hospitals. Based on these findings, the team identified key facilitators including reduced workload, increased confidence in achieving objectives, and benefits related to nationwide utilization [72].
This implementation demonstrated that successful adoption of standardized assessment tools requires balancing structured frameworks with local adaptation—a crucial consideration for EDC questionnaire validation across diverse age populations.
Table 2: Essential Research Reagents and Resources for EDC Validation Studies
| Resource Category | Specific Tools/Solutions | Research Application | Key Considerations |
|---|---|---|---|
| EDC Platforms | OpenClinica, REDCap, Castor EDC, Medidata Rave | Electronic data capture for clinical research | Compliance with 21 CFR Part 11, support for multi-site studies, mobile compatibility [75] [74] |
| Validation Instruments | Eating Disorder Examination Questionnaire (EDE-Q), Vulnerable Elders Survey (VES-13), Technology Acceptance Models | Reference standards for validating new EDC instruments | Copyright restrictions, cross-cultural adaptation needs, age-appropriate formulations [73] [69] [76] |
| Quality Improvement Frameworks | Model for Improvement, Lean Six Sigma, CDS Maturity Model | Structuring iterative improvement cycles | Organizational buy-in, resource allocation, compatibility with existing workflows [68] [70] [71] |
| Statistical Analysis Tools | Principal Component Analysis, Correlation Analysis, c-statistic for discrimination | Psychometric validation and performance assessment | Sample size requirements, handling of missing data, adjustment for multiple comparisons [73] [77] |
The integration of PDSA cycles into EDC questionnaire validation represents a methodological advancement that enhances both the quality and efficiency of clinical research tools development. Through structured iteration and data-driven refinement, researchers can develop increasingly robust data collection instruments that account for the unique characteristics of different age populations.
The experimental protocols and comparative data presented provide a roadmap for implementing this approach across various research contexts. As EDC technologies continue to evolve, maintaining this disciplined approach to validation will be essential for generating reliable, clinically meaningful data across all participant age groups.
Measuring Efficacy: Validation Frameworks and Comparative Outcomes Across Age Groups
In the rigorous world of clinical research and diagnostic validation, the performance of an instrument is quantitatively assessed through a set of fundamental metrics. Sensitivity and specificity are the cornerstone parameters, mathematically describing a test's accuracy against a reference standard [78] [79]. These metrics are foundational to the broader thesis of validating Electronic Data Capture (EDC) questionnaires, where ensuring data integrity and accurately identifying clinical conditions are paramount. The reliability of any research conclusion, especially across diverse age cohorts, hinges on a precise understanding of these metrics, their interdependencies, and their correlation with tangible clinical outcomes. This guide provides an objective comparison of these key performance indicators, supported by experimental data and standardized methodologies.
Foundations of Diagnostic Accuracy
Diagnostic accuracy studies evaluate how well a test identifies a target condition of interest, with results typically summarized in a 2x2 contingency table against a reference standard [78]. The metrics derived from this table are intrinsic to the test's design and the clinical context in which it is used.
- Sensitivity, or the "true positive rate," is the probability of a positive test result given that the individual truly has the condition. It is calculated as the number of true positives divided by the total number of sick individuals (true positives + false negatives) [78] [79] [80]. A test with high sensitivity is ideal for "ruling out" a disease, as it rarely misclassifies those who have the condition [78].
- Specificity, or the "true negative rate," is the probability of a negative test result given that the individual is well. It is calculated as the number of true negatives divided by the total number of well individuals (true negatives + false positives) [78] [79] [80]. A test with high specificity is crucial for "ruling in" a disease, as it minimizes the false alarms that could lead to unnecessary anxiety and further testing [78].
- Predictive Values differ from sensitivity and specificity because they are influenced by the prevalence of the condition in the population being tested [78] [80]. The Positive Predictive Value (PPV) is the proportion of positive test results that are true positives, while the Negative Predictive Value (NPV) is the proportion of negative test results that are true negatives [78].
The following diagram illustrates the logical relationship between the components of the 2x2 table and the resulting validation metrics.
Comparative Analysis of Validation Metrics
The application of these metrics can be observed in the validation of various clinical and psychometric tools. The trade-off between sensitivity and specificity is a key consideration; modifying a test's cut-off score to increase sensitivity will typically decrease its specificity, and vice versa [78]. This relationship is graphically represented by a Receiver Operating Characteristic (ROC) curve, which plots sensitivity against (1-specificity) across a range of cut-offs [78]. The Area Under the ROC Curve (AUC) provides a single measure of overall test performance, where an area of 1 represents a perfect test and 0.5 represents a test with no discriminative power [81].
Table 1: Validation Metrics from Applied Screening Tool Studies
| Screening Tool / Context | Target Condition | Sensitivity (%) | Specificity (%) | PPV (%) | NPV (%) | AUC | Key Experimental Findings |
|---|---|---|---|---|---|---|---|
| EDE-QS (Cut-off ≥15) [81] | Probable Eating Disorder | 83 | 85 | 37 | 98 | Moderately Accurate | Score of 15 provided the best trade-off for screening in a community setting. |
| BNP (Cut-off 50 pg/mL) [78] | Congestive Heart Failure (ED) | High | Lower | Lower | High | Not Reported | Lower cut-off optimizes for "rule-out" test in an emergency department. |
| BNP (Higher Cut-off) [78] | Congestive Heart Failure (ED) | Lower | High | High | Lower | Not Reported | Higher cut-off optimizes for "rule-in" test, increasing diagnostic certainty. |
| CRAFFT 2.1 (Score ≥2) [82] | Substance Use Disorder (Adolescents) | High | High | Not Reported | Not Reported | Not Reported | A brief, efficient tool validated for universal screening in diverse adolescent populations. |
Beyond the core metrics, Likelihood Ratios (LRs) offer a powerful method for leveraging test results into post-test probabilities. The Positive Likelihood Ratio (LR+) is calculated as sensitivity / (1 - specificity), and the Negative Likelihood Ratio (LR-) as (1 - sensitivity) / specificity [78]. LRs can be combined with a pre-test probability (often based on disease prevalence) to estimate how much a test result will change the likelihood of disease. An LR+ >10 and an LR- <0.1 are considered to exert highly significant changes in probability [78].
Table 2: Advanced Validation Metrics and Their Interpretation
| Metric | Formula | Interpretation | Ideal Value |
|---|---|---|---|
| Positive Likelihood Ratio (LR+) | Sensitivity / (1 - Specificity) | How much the odds of disease increase with a positive test. | > 10 [78] |
| Negative Likelihood Ratio (LR-) | (1 - Sensitivity) / Specificity | How much the odds of disease decrease with a negative test. | < 0.1 [78] |
| Area Under the Curve (AUC) | Area under the ROC curve | Overall discriminative ability of the test across all cut-offs. | 1.0 (Perfect Test) [81] |
| Clinical Impairment | Independent assessment (e.g., CIA) [81] | Measures psychosocial impairment, supporting criterion validity. | Varies by instrument |
Experimental Protocols for Metric Validation
The process of establishing these metrics requires a rigorous and standardized methodological approach.
Core Workflow for Validation Studies
The following diagram outlines the generalized workflow for conducting a diagnostic validation study, from initial design to the final calculation of metrics.
Detailed Methodologies
Participant Recruitment and Blinding: A consecutive series of well-defined patients who are suspected of having the target condition should be recruited. Each participant undergoes both the index test (the tool being validated) and the reference standard test. Critically, the assessments should be blinded, meaning that the interpreter of the index test is unaware of the reference standard result, and vice versa, to prevent bias [78].
Reference Standard Application: The reference standard (or "gold standard") is the best available method for definitively diagnosing the target condition. Examples include a clinical diagnosis by a specialist [78], a structured interview like the Eating Disorder Examination (EDE) for eating disorders [83] [84], or an objective measure like echocardiography for heart failure [78]. The validity of the entire validation study hinges on the quality of the reference standard.
ROC Curve Analysis and Cut-off Selection: For tests that yield a continuous score (e.g., the EDE-QS score from 0-36), an ROC curve is constructed by plotting the sensitivity and (1-specificity) for every possible cut-off value [78] [81]. The optimal cut-off for clinical use is selected based on the intended purpose:
- High Sensitivity Cut-off: Chosen when the priority is to not miss any cases (e.g., for a initial screening test). This minimizes false negatives.
- High Specificity Cut-off: Chosen when confirming a diagnosis is critical and false positives are undesirable (e.g., before initiating an invasive treatment) [78]. The point on the ROC curve closest to the top-left corner often represents the best overall balance between sensitivity and specificity [81].
The Scientist's Toolkit: Research Reagent Solutions
The following table details key materials and methodological solutions essential for conducting robust validation studies.
Table 3: Essential Reagents and Resources for Validation Research
| Item / Solution | Function in Validation Research | Application Example |
|---|---|---|
| Reference Standard | Provides the definitive diagnosis against which the index test is compared. | EDE interview [83] [84], Cardiologist diagnosis [78], Echocardiography [78]. |
| Validated Index Test | The instrument or questionnaire whose diagnostic accuracy is being evaluated. | EDE-QS [81], CRAFFT 2.1 questionnaire [82], B-type natriuretic peptide (BNP) assay [78]. |
| Electronic Data Capture (EDC) System | Software to collect, manage, and securely store clinical trial data in real-time, improving data accuracy and integrity [85] [86]. | Capturing patient demographics, lab results, and questionnaire responses directly into electronic Case Report Forms (eCRFs). |
| Statistical Analysis Package | Software used to perform ROC curve analysis, calculate metrics, and determine confidence intervals. | R package "pROC" for computing AUC [81], other standard statistical software (e.g., SPSS, SAS). |
| Clinical Impairment Assessment | A tool to measure psychosocial impairment, providing evidence for criterion validity. | Clinical Impairment Assessment (CIA) questionnaire [81]. |
| Validation Compliance Materials | Documentation ensuring that electronic systems comply with regulatory standards (e.g., FDA 21 CFR Part 11). | Installation qualification reports, executed test suites, and standard operating procedures [87]. |
Sensitivity, specificity, and predictive values form an indispensable toolkit for the objective evaluation of clinical and research instruments. Their proper application, guided by rigorous experimental protocols and an understanding of their inherent trade-offs, is fundamental to the validation of EDC questionnaires. As research expands to consider performance across different age groups, these metrics will remain the universal language for quantifying diagnostic accuracy, ensuring that conclusions drawn from research data are both valid and reliable.
The effective triage of patients in emergency settings is a critical component of healthcare delivery, directly impacting resource allocation, clinical outcomes, and operational efficiency. While triage systems have been widely adopted, their validation across diverse patient populations and healthcare settings remains essential. This comparative guide examines the validation of the Pediatric Assessment Triangle (PAT) against other triage tools, with a specific focus on its correlation with hospitalization and critical illness outcomes. The validation methodologies and performance metrics discussed provide a framework applicable to the broader context of assessment tool validation, including instruments for evaluating exposure to endocrine-disrupting chemicals (EDCs) across different age groups.
The Pediatric Assessment Triangle (PAT) is a rapid, standardized assessment tool designed for pediatric emergency patients. Its structure encompasses three key components: appearance, work of breathing, and circulation. This tool enables healthcare providers to form a quick general impression of a child's clinical status without equipment in 30-60 seconds, identifying potentially critically ill children requiring immediate intervention [33].
For comparison, other established triage tools include:
- Emergency Triage Assessment and Treatment (ETAT): WHO-recommended guidelines for resource-limited settings
- Smart Triage: A logistic regression model predicting admission probability
- Interagency Integrated Triage Tool (IITT): WHO-developed tool for both routine and mass casualty situations [88] [89]
Each tool employs distinct approaches to risk stratification, from clinical sign-based assessment (PAT, ETAT) to predictive algorithmic models (Smart Triage), with varying implementation requirements and target settings.
Table 1: Fundamental Characteristics of Triage Tools
| Triage Tool | Assessment Method | Target Population | Assessment Time | Key Components |
|---|---|---|---|---|
| PAT | Visual/auditory assessment | Pediatric emergency patients | 30-60 seconds | Appearance, work of breathing, circulation |
| ETAT | Clinical signs assessment | Pediatric emergency patients | Variable | Emergency signs, priority signs, non-urgent |
| Smart Triage | Predictive algorithm | Pediatric emergency patients | Variable | 9 predictor variables from vital signs, demographics |
| IITT | Clinical signs assessment | All age groups (separate tools) | Variable | Color-coded system (red, yellow, green) |
Performance Metrics and Validation Data
Validation studies for the PAT demonstrate consistent correlations with hospitalization and critical illness outcomes across diverse settings. Recent evidence from a 2024 scoping review of 55 publications indicates that PAT sensitivity ranges from 77.4% to 97.3%, correctly identifying most critically ill pediatric patients. Specificity values show wider variation (22.9%-99.15%), reflecting contextual differences in application and patient populations [33].
A 2025 retrospective analysis of 799 children in a pediatric emergency department reported an area under the receiver operating characteristic curve (AUROC) of 0.966 for predicting hospitalization, indicating excellent discriminatory power [90]. This study further identified respiratory system diseases as the most common presentation (78.7%), with the highest critical case proportions in endocrine system diseases (100%), toxic exposure (50%), and circulatory system diseases (40%) [90].
Another investigation of 622 pediatric patients found significantly higher hospitalization rates among those with impaired PAT findings (91.46%) compared to those with normal PAT (26.06%). Multivariate analysis confirmed abnormal findings in more than one PAT component, appearance in the emergency department, and abnormal blood test results as significant factors associated with hospitalization [91].
Table 2: PAT Performance Metrics Across Validation Studies
| Study Context | Sample Size | Sensitivity (%) | Specificity (%) | AUROC | Key Correlations |
|---|---|---|---|---|---|
| General PAT evidence (Scoping Review) [33] | 55 publications | 77.4-97.3 | 22.9-99.15 | Not reported | Valid for prioritizing emergency pediatric patients |
| Pediatric Emergency Department (2025) [90] | 799 | Not reported | Not reported | 0.966 (hospitalization) | Critical cases highest in neonates (21.4%) |
| Pediatric Emergency Room (2023) [91] | 622 | Not reported | Not reported | Not reported | 91.46% hospitalization with impaired PAT vs 26.06% with normal PAT |
| PAT vs. ETAT in Kenya (2024) [89] | 5,618 | 79.6 (mortality) | Not reported | Not reported | Classified 79.6% deceased children as emergencies |
Comparative Tool Performance
When compared directly with other triage systems, the PAT demonstrates distinct performance characteristics. A 2024 study in Kenya comparing ETAT and Smart Triage across 5,618 children found that ETAT classified 9.2% of children into the emergency category compared to 20.7-20.8% by Smart Triage models. ETAT identified 51% of deceased children as emergencies, while Smart Triage models identified 79.6% [89].
For mortality prediction, ETAT demonstrated 51% sensitivity compared to 79.6% for Smart Triage models. For hospital admissions, ETAT's sensitivity was 48.4% versus 74.9% for Smart Triage, though this improved detection comes with a higher categorization of patients into emergency groups (approximately 21% vs 9%) [89].
The PAT's performance varies across specific clinical presentations. The 2025 study revealed its particular effectiveness in identifying respiratory emergencies, which comprised 78.7% of cases, with critical illness most prevalent in neonatal (21.4%) and 8-15 years age groups (2.1%) [90].
Experimental Protocols and Methodologies
PAT Validation Study Designs
Validation studies for the PAT employ distinct methodological approaches:
Retrospective Analysis Protocol [90] [91]:
- Patient population: Children aged 0-18 years presenting to pediatric emergency departments
- PAT assessment: Trained triage nurses evaluate appearance, work of breathing, and circulation
- Data collection: Demographic information, vital signs, chief complaint, disposition
- Outcome measures: Hospital admission, critical care admission, mortality
- Statistical analysis: Sensitivity, specificity, AUROC calculations, regression models for association
Comparative Study Protocol [89]:
- Prospective enrollment of children under 15 years with acute illness
- Simultaneous assessment using multiple triage tools (ETAT and Smart Triage)
- Clinical examination including vital signs (heart rate, SpO2, respiratory rate)
- Independent clinician assessment for disposition decision
- Outcome tracking: Admission, mortality, 7-day follow-up
- Analysis: Sankey diagrams for triage category distribution, performance metrics calculation
Scoping Review Methodology [33]:
- Systematic search across multiple databases (MEDLINE, Cochrane, CINAHL)
- Predefined eligibility criteria focusing on psychometric properties, impact, implementation
- Dual-independent screening and data extraction
- Thematic synthesis of findings across study designs
- Identification of research gaps and methodological limitations
PAT Validation Workflow and Outcomes
Implementation Considerations and Limitations
The successful implementation of the PAT requires specific conditions and training. Evidence indicates that PAT utilization demands trained healthcare professionals with at least 6 months of uninterrupted pediatric emergency experience and specialized training in PAT concepts and practices [90]. The triage environment should support rapid assessment, ideally with dedicated space and nursing assistance.
Key limitations identified across studies include:
Variability in Specificity: The wide specificity range (22.9%-99.15%) suggests contextual factors significantly influence performance, potentially leading to inconsistent resource allocation in different settings [33].
Training Dependency: Inter-rater reliability depends on comprehensive training protocols, with one study reporting data collection by a single trained observer to ensure consistency [33].
Age-Specific Performance: PAT effectiveness varies across developmental stages, with highest critical case prevalence in neonates (21.4%) compared to other pediatric age groups [90].
Comparative Limitations: While PAT demonstrates good performance, Smart Triage models showed higher sensitivity for mortality (79.6% vs 51%) in direct comparisons, though with increased emergency categorizations [89].
The Scientist's Toolkit: Research Reagent Solutions
Table 3: Essential Research Materials for Triage Tool Validation
| Research Tool | Function in Validation | Application Example |
|---|---|---|
| Pediatric Assessment Triangle (PAT) | Standardized assessment framework | Core tool for rapid pediatric evaluation [90] [91] [33] |
| Emergency Triage Assessment and Treatment (ETAT) | Comparison triage system | Benchmark for performance in resource-limited settings [89] |
| Smart Triage Algorithm | Predictive model comparison | Logistic regression model with 9 variables for admission probability [89] |
| ROC Curve Analysis | Discriminatory power quantification | AUROC of 0.966 for hospitalization prediction [90] |
| Sensitivity/Specificity Calculations | Diagnostic accuracy measurement | PAT sensitivity 77.4-97.3%, specificity 22.9-99.15% [33] |
| Multivariable Regression Models | Confounding factor adjustment | Identification of independent predictors beyond PAT findings [91] |
| Decision Curve Analysis | Clinical utility assessment | Net benefit across probability thresholds [92] |
The Pediatric Assessment Triangle demonstrates substantial evidence supporting its validity as a triage tool for correlating with hospitalization and critical illness outcomes in pediatric emergency settings. With sensitivity values up to 97.3% and strong discriminatory power for hospitalization (AUROC up to 0.966), it provides an effective rapid assessment method for identifying critically ill children. The validation methodologies and performance metrics established for PAT offer valuable frameworks for evaluating assessment tools across healthcare contexts, including the development and validation of EDC questionnaires across different age groups. Future research should address specificity consistency, age-stratified performance metrics, and direct comparisons with emerging algorithmic triage systems to further refine triage tool selection and implementation across diverse clinical settings.
The global population is aging at an unprecedented pace, presenting healthcare systems with the challenge of managing complex, multifactorial health conditions in older adults [93]. Traditional disease-centric models often fail to capture the heterogeneity of health status in geriatric populations, necessitating more sophisticated assessment tools. Comprehensive Geriatric Assessment (CGA) has emerged as a multidimensional, interdisciplinary approach that evaluates key domains of aging, including medical, functional, cognitive, nutritional, and psychosocial factors [93]. Within precision geriatrics, accurate prediction of critical outcomes like mortality and discharge disposition is essential for optimizing treatment plans, allocating resources efficiently, and improving overall patient care. This review synthesizes current evidence on the predictive value of various geriatric assessment tools for these outcomes, providing researchers and clinicians with a comparative analysis of their performance characteristics and methodological applications.
Predictive Value for Mortality
Geriatric assessment tools demonstrate significant prognostic value for mortality risk stratification in older adult populations. The predictive power of these instruments stems from their ability to capture multidimensional aspects of health status that extend beyond simple disease diagnoses or chronological age.
Key Predictors of Mortality
Research has identified several consistent predictors of all-cause mortality across multiple studies and methodological approaches. A 2025 study evaluating 1,974 older adults from a university hospital outpatient clinic found that during a median follow-up of 617 days, 430 participants (21.7%) died [93]. Lower Lawton instrumental activities of daily living (IADL) scores, unintentional weight loss, slower gait speed, and elevated C-reactive protein (CRP) levels emerged as consistent mortality predictors across all analytical models [93]. These findings suggest that functional decline and inflammation markers offer greater predictive power than chronological age alone in assessing overall health and survival probability.
A 2012 systematic review encompassing 51 publications from 37 studies further supported these findings, indicating that frailty, nutritional status, and comorbidity assessed by the Cumulative Illness Rating Scale for Geriatrics were predictive for all-cause mortality across diverse patient populations [94]. This review highlighted that a median of five geriatric conditions were assessed per study (interquartile range: 4-8), reflecting the multifactorial nature of mortality risk in older adults [94].
Assessment Tools and Methodologies
Recent advances in predictive modeling have incorporated both traditional statistical methods and machine learning approaches. The 2025 study employed Cox proportional hazards regression and six machine learning algorithms, including logistic regression, support vector machine, decision tree, random forest, extreme gradient boosting, and artificial neural networks [93]. The artificial neural network demonstrated the highest predictive performance (AUC = 0.970), followed by logistic regression (AUC = 0.851) [93]. SHapley Additive explanations (SHAP) analysis confirmed the relevance of key features identified through traditional methods, validating the robustness of these predictors across analytical techniques.
Table 1: Predictive Performance of Different Analytical Models for Mortality Risk in Older Adults
| Model Type | AUC | Key Predictors Identified | Study Population |
|---|---|---|---|
| Artificial Neural Network | 0.970 | Lower IADL scores, weight loss, slower gait speed, elevated CRP | 1,974 outpatient older adults [93] |
| Logistic Regression | 0.851 | Lower IADL scores, weight loss, slower gait speed, elevated CRP | 1,974 outpatient older adults [93] |
| Cox Proportional Hazards | Varies by study | Frailty, nutritional status, comorbidity | Systematic review of 37 studies [94] |
Table 2: Key Geriatric Domains and Their Association with Mortality Risk
| Geriatric Domain | Specific Assessment Tool | Predictive Value for Mortality | Supporting Evidence |
|---|---|---|---|
| Functional Status | Lawton IADL | Strong independent predictor | Lower scores consistently predictive [93] |
| Frailty | Fried Criteria | Predictive across multiple studies | Systematic review findings [94] |
| Nutritional Status | Unintentional Weight Loss | Consistent predictor | 2025 cohort study [93] |
| Mobility | Gait Speed | Strong independent predictor | Slower speed associated with increased risk [93] |
| Inflammation | CRP Levels | Consistent predictor | Elevated levels predictive [93] |
| Comorbidity | Cumulative Illness Rating Scale for Geriatrics | Predictive for all-cause mortality | Systematic review findings [94] |
Predictive Value for Discharge Disposition
Accurate prediction of discharge disposition is crucial for efficient care transition planning, resource allocation, and preventing unnecessary hospital readmissions. Geriatric assessment tools have demonstrated significant value in forecasting post-discharge needs and placement.
Key Predictors of Discharge Outcomes
Research has identified distinct assessment domains that predict different discharge pathways. A retrospective observational study of an interdisciplinary CGA team embedded in an Emergency Department (Home FIRsT) found that strong independent predictors for hospital admission included acute illness severity (OR 2.01, 95% CI 1.50-2.70, P<0.001) and cognitive impairment/delirium as measured by the 4AT (OR 1.26, 95% CI 1.13-1.42, P<0.001) [95]. Notably, discharge to the Geriatric Day Hospital was only predicted by frailty (OR 1.52, 95% CI 1.17-1.97, P=0.002), while age and sex were not predictive in any of the models [95].
In geriatric trauma populations, the Frailty Index (FI) has shown significant predictive value for unfavorable discharge disposition. A prospective study of 100 trauma patients aged 65 years or older found that after adjusting for age, Injury Severity Score, and Glasgow Coma Scale score in a multivariate regression model, FI remained a strong predictor for unfavorable discharge disposition (OR 1.3, 95% CI 1.1-1.8) [96]. This suggests that the concept of frailty can be successfully implemented in geriatric trauma patients with similar results as those in nontrauma and nonsurgical patients.
Assessment Frameworks for Discharge Planning
A 2017 systematic review protocol highlighted that prognostic models predicting discharge location typically incorporate factors such as advanced age, lower functional status at admission, cognitive impairment, length of stay, and depression [97]. The review emphasized that early prediction of a patient's required discharge support services could improve patient care and health system efficiency, particularly since 30-50% of elderly patients do not return to their functional baseline at 3 months after discharge [97].
Table 3: Predictive Capacity of Geriatric Assessments for Discharge Disposition
| Assessment Tool/Domain | Predictive Value | Population | Statistical Significance |
|---|---|---|---|
| Clinical Frailty Scale | Predicts discharge to Geriatric Day Hospital (OR 1.52) | Emergency Department older patients [95] | P=0.002 |
| Frailty Index (FI) | Predicts unfavorable discharge disposition (OR 1.3) | Geriatric trauma patients [96] | 95% CI 1.1-1.8 |
| Illness Acuity (Manchester Triage Score) | Predicts hospital admission (OR 2.01) | Emergency Department older patients [95] | P<0.001 |
| Cognitive Impairment/Delirium (4AT) | Predicts hospital admission (OR 1.26) | Emergency Department older patients [95] | P<0.001 |
| Musculoskeletal/Injuries/Trauma | Predicts discharge to specialist outpatients (OR 6.45) | Emergency Department older patients [95] | P=0.011 |
Comparative Analysis of Methodologies
Research Protocols and Experimental Designs
Studies evaluating geriatric assessment tools employ varied methodological approaches depending on their specific research questions and clinical contexts. The 2025 mortality prediction study utilized a retrospective cohort design with electronic health records from a university hospital, including patients who presented to the geriatrics outpatient clinic between January 2017 and December 2024 [93]. The methodology encompassed 96 CGA-related variables spanning functional and nutritional status, frailty, mobility, cognition, mood, chronic conditions, and laboratory findings [93]. Variables with more than 30% missing data were excluded, and for remaining variables, missing values were imputed using median imputation. To address class imbalance in mortality outcomes, the Synthetic Minority Oversampling Technique (SMOTE) was applied to the training dataset [93].
The Emergency Department disposition study employed a retrospective observational design, including all first patients seen by the Home FIRsT interdisciplinary CGA team between May and October 2018 [95]. Collected measures included sociodemographic factors, baseline frailty (Clinical Frailty Scale), major diagnostic categories, illness acuity (Manchester Triage Score), and cognitive impairment/delirium (4AT) [95]. Multivariate binary logistic regression models were computed to predict ED disposition outcomes, with model fit and predictive accuracy rigorously assessed.
Data Analysis Techniques
Across studies, survival analyses have been conducted using Kaplan-Meier methods to assess differences in survival across subgroups, with group differences statistically evaluated using the log-rank test [93]. Multivariable Cox proportional hazards regression has been employed to identify independent predictors of mortality, with discriminatory performance assessed using the concordance index (C-index) and the area under the ROC curve (AUC) [93].
Machine learning approaches have incorporated comprehensive model validation techniques, including random splitting of data into training (80%) and testing (20%) sets, 5-fold cross-validation on the training set for hyperparameter tuning, and regularization methods to reduce overfitting risk [93]. Model performance has been evaluated using multiple metrics including AUC, sensitivity, and F1-score to provide comprehensive assessment of predictive capabilities [93].
Essential Research Reagents and Assessment Tools
The field of geriatric assessment utilizes a standardized set of validated tools and measures to ensure consistent, reproducible evaluation across research and clinical settings. The following table outlines key assessment instruments and their applications in predictive modeling.
Table 4: Essential Research Assessment Tools for Geriatric Outcome Prediction
| Assessment Tool | Domain Measured | Application in Prediction | Key References |
|---|---|---|---|
| Lawton IADL Scale | Instrumental Activities of Daily Living | Consistent mortality predictor; functional status evaluation | [93] |
| Barthel Index | Basic Activities of Daily Living | Functional status assessment for discharge planning | [93] |
| Clinical Frailty Scale | Frailty status | Predicts discharge to geriatric day hospital | [95] |
| Fried Frailty Phenotype | Physical frailty components | Mortality risk stratification | [93] |
| 4AT | Cognitive impairment/delirium | Predicts hospital admission from ED | [95] |
| Mini Mental State Examination | Global cognitive function | Cognitive status evaluation in CGA | [93] |
| Geriatric Depression Scale | Mood symptoms | Psychosocial assessment in CGA | [93] |
| Mini Nutritional Assessment | Nutritional status | Nutritional status evaluation | [93] |
| Timed Up and Go Test | Mobility and fall risk | Functional mobility assessment | [93] |
| Tinetti Balance and Gait Scale | Balance and gait impairment | Fall risk assessment | [93] |
| Manchester Triage Score | Illness acuity | Predicts hospital admission from ED | [95] |
| Cumulative Illness Rating Scale for Geriatrics | Comorbidity burden | Predicts all-cause mortality | [94] |
Comprehensive Geriatric Assessment tools demonstrate significant predictive value for both mortality and discharge disposition outcomes in older adult populations. Functional measures, particularly IADL performance, gait speed, and frailty indicators, emerge as consistent predictors across multiple studies and analytical approaches. The integration of machine learning methodologies with traditional statistical models enhances predictive accuracy while validating key prognostic factors identified through conventional analyses. For discharge disposition, different geriatric domains predict distinct pathways: acute illness severity and delirium strongly predict hospital admission, while baseline frailty predicts referral to specialized geriatric services. These findings underscore the importance of multidimensional assessment in prognostic modeling for geriatric populations. Future research should focus on standardizing assessment protocols across settings and validating predictive models in diverse populations to enhance clinical applicability and translation into routine care pathways.
Within clinical and public health research, structured checklists and scoring systems are vital tools for risk stratification, patient assessment, and quality improvement. Their performance and impact, however, are highly dependent on the specific physiological, developmental, and epidemiological characteristics of the target population. This guide provides a comparative analysis of checklist performance in pediatric versus geriatric populations, framing the discussion within the context of validating tools for assessing exposures to endocrine-disrupting chemicals (EDCs). Researchers in toxicology and drug development require robust, validated questionnaires and checklists to study the health effects of EDCs across different age groups, where vulnerabilities and health outcomes can vary dramatically [98] [99].
Comparative Performance Metrics of Population-Specific Checklists
Checklists and scoring systems are tailored to address the most prevalent and critical risks facing each population. The performance of these tools is measured against outcomes highly relevant to each group's health priorities.
Table 1: Key Performance Metrics for Pediatric and Geriatric Checklists
| Metric | Pediatric Context | Geriatric Context |
|---|---|---|
| Primary Outcome Measured | Critical Deterioration Event (CDE), defined as unplanned PICU/HDU admission requiring organ support within 12 hours [100]. | Functional Decline, Falls, Unplanned ED Revisits, and Hospital Admissions [101]. |
| Typical Predictive Performance | Excellent predictive ability for CDEs. Area Under the Curve (AUC) for Pediatric Early Warning Scores (PEWS) ranges from 0.87 to 0.95 [100]. | Tracked via quality improvement metrics (e.g., rates of positive screens for delirium/falls, repeat ED visits) [101]. Specific AUC values less commonly reported in checklist implementation. |
| Commonly Identified Optimum Cut-Off | Yes, identified using statistical methods like the Youden J statistic to maximize sensitivity and specificity for predicting deterioration [100]. | Checklists often use pre-defined, validated cut-offs on screening tools (e.g., for delirium, functional decline) to trigger protocols [101]. |
| Key Performance Limitation | Low mortality rates outside intensive care make it an impractical outcome measure, necessitating the use of surrogate endpoints like CDEs [100]. | Outcomes are often multifactorial, making it difficult to attribute results solely to checklist use. |
Experimental Protocols for Checklist Validation
The methodologies for validating checklists and scores differ significantly between pediatric and geriatric settings, reflecting their distinct clinical challenges.
Protocol for Validating Pediatric Early Warning Systems
A robust protocol for validating a Pediatric Early Warning Score (PEWS) involves a case-control design focused on predicting critical deterioration [100].
- 1. Study Design & Population: A retrospective or prospective case-control study in a hospital inpatient setting. Cases are patients who experience a Critical Deterioration Event (CDE). Controls are matched to cases based on factors like age range and admitting specialty, typically in a 2:1 ratio [100].
- 2. Data Collection: Vital signs (e.g., respiratory rate, heart rate, oxygen saturation) and other clinical parameters (e.g., nurse concern, capillary refill) are collected from electronic patient records. The maximum PEWS is calculated in the 24, 12, 6, and 4 hours preceding the CDE (for cases) or discharge (for controls), excluding the final hour before the event to avoid pre-terminal vitals [100].
- 3. Statistical Analysis: Receiver Operating Characteristic (ROC) curves are generated to evaluate the score's discriminative ability. The Area Under the Curve (AUC) is calculated, with excellent performance often considered >0.9. The optimal score cut-off is determined using the Youden J statistic. Time-to-event analysis (e.g., Kaplan-Meier curves with log-rank test) further compares the cumulative risk of a CDE between patients stratified by the optimal cut-off [100].
Protocol for Implementing Geriatric Screening Checklists
Validation of geriatric checklists often focuses on implementation within a quality improvement framework and measuring process outcomes.
- 1. Tool Selection & Staff Education: A "senior-friendly" ED checklist is adopted, encompassing screening for delirium (e.g., CAM), dementia (e.g., Mini-Cog), functional decline (e.g., ISAR), and fall risk (e.g., Timed Up and Go) [101]. Education for physicians and nursing staff on geriatric emergency medicine domains is critical and must be completed prior to implementation [101].
- 2. Process Implementation: Defined protocols are activated based on screening results. For example, a positive delirium screen triggers a standardized delirium management protocol, while a positive fall risk screen triggers a comprehensive fall assessment [101].
- 3. Outcome Evaluation: The effectiveness is tracked through continuous quality improvement metrics. Key outcomes include the number of older adults with repeat ED visits or admissions, the percentage of patients screened, the percentage of screen-positive patients appropriately referred, and the length of ED stay [101].
The following diagram illustrates the core workflows for validating checklists in these two distinct populations.
The Scientist's Toolkit: Essential Reagents and Materials
Conducting research on EDCs and their health effects across age groups requires specialized tools and materials. The following table details key solutions for epidemiological and clinical investigations.
Table 2: Key Research Reagent Solutions for EDC Questionnaire Validation Studies
| Tool Category | Specific Examples | Function in Research |
|---|---|---|
| Biomonitoring Kits | Immunoassays for Bisphenol A (BPA), Phthalate metabolites; LC-MS/MS kits for PFAS analysis. | To quantitatively measure internal exposures to specific EDCs in biological samples (e.g., urine, blood, breast milk), providing objective data for correlating with health questionnaire responses [98] [99]. |
| Validated Health Questionnaires | Child Behavior Checklist (CBCL), Autism diagnostic interviews, Pubertal Development Scales (PDS), ADL/IADL scales for older adults. | To capture structured data on health outcomes and potential confounders. These are the "checklists" whose validation is often the study's goal, measuring neurodevelopment, metabolic, or functional outcomes [98]. |
| Data Extraction & Management Tools | Electronic Health Record (EHR) systems with structured fields, REDCap, Biobank data management platforms. | To systematically collect, manage, and link RWD (e.g., clinical histories, medication use) with EDC exposure data and questionnaire results, ensuring data quality and reusability [102]. |
| Statistical Analysis Software | R packages ('bibliometrix', etc.), VOSviewer, CiteSpace, SPSS, SAS. | To perform complex statistical analyses, including multivariable regression to control for confounding, bibliometric analysis of research trends, and modeling of mixed EDC exposures [98]. |
Discussion and Research Implications
The comparative analysis reveals that while the underlying principle of using structured tools for risk assessment is consistent, their application and validation are profoundly shaped by population-specific needs. Pediatric tools like PEWS are finely tuned to predict acute, physiological deterioration, whereas geriatric checklists take a holistic approach to identify multifactorial risks like functional decline and cognitive impairment [100] [101].
For researchers validating EDC questionnaires, this has critical implications:
- Endpoint Selection: In pediatric studies, questionnaires may need validation against neurodevelopmental, metabolic, or pubertal timing outcomes, which are sensitive to EDC exposure [98]. In geriatric populations, relevant endpoints may include cognitive decline, frailty trajectories, or metabolic dysfunction.
- Tool Design and Acceptability: Medication acceptability checklists must account for vast differences in formulation preferences and swallowing abilities between children and older adults [103]. A formulation's taste and smell are paramount for pediatric acceptance, while swallowability and manageability of polypharmacy are primary concerns for older adults [103].
- Leveraging Real-World Data (RWD): The increasing availability of EHR data presents an opportunity to validate and refine checklists. However, significant variability exists in how key clinical data are captured and stored, posing a barrier to reusing this data for research, particularly for disease-specific and contextual variables [102]. Efforts to standardize structured data entry in EHRs are essential for advancing research in both populations.
In conclusion, a one-size-fits-all approach is ineffective. Future research, particularly in evolving fields like EDC assessment, must continue to develop and validate age-group-specific instruments that are not only statistically robust but also clinically meaningful and acceptable to the intended population.
Conclusion
The validation of age-specific Emergency Department checklists is a cornerstone for enhancing patient safety and standardizing high-quality care across diverse populations. Evidence demonstrates that tailored tools, such as the Pediatric Assessment Triangle for children and the 5Ms framework for older adults, significantly improve the recognition of critical illness, guide appropriate interventions, and predict key clinical outcomes. Future efforts must focus on longitudinal multicenter studies to strengthen validity evidence, the development of hybrid tools for patients with intersecting needs, and the integration of digital checklists into electronic health records to support clinical decision-making. For researchers and drug development professionals, these validated instruments also offer robust frameworks for structuring clinical trial data collection in emergency settings, ensuring consistency and reliability in patient assessments across study sites.
References
- 1. Benchmarking emergency department prediction models ... [https://www.nature.com/articles/s41597-022-01782-9]
- 2. Findings from the Fifth Emergency Department ... [https://pmc.ncbi.nlm.nih.gov/articles/PMC12159897/]
- 3. The Development and Reliability Testing of a Tool to ... [https://www.mdpi.com/2076-3298/12/5/138]
- 4. Development of a Discrete Choice Experiment (DCE ... [https://pmc.ncbi.nlm.nih.gov/articles/PMC11985673/]
- 5. Web-Based Cross-Sectional Survey Study [https://www.jmir.org/2025/1/e81416]
- 6. Displaying the Data in a Health Care Quality Report [https://www.ahrq.gov/talkingquality/translate/display/index.html]
- 7. Contrast Checker [https://webaim.org/resources/contrastchecker/]
- 8. Pediatric Emergency Department Diagnostics: Global ... [https://link.springer.com/article/10.1007/s40746-025-00333-9]
- 9. Optimizing pediatric emergency triage in low-resource settings [https://intjem.biomedcentral.com/articles/10.1186/s12245-025-00998-x]
- 10. Factors Predicting Older People's Acceptance of ... - JMIR Aging [https://aging.jmir.org/2023/1/e41429/]
- 11. Reducing Exposures to Endocrine Disruptors (REED) study, a ... [https://trialsjournal.biomedcentral.com/articles/10.1186/s13063-024-08627-3]
- 12. Presenting data in tables and charts - PMC [https://pmc.ncbi.nlm.nih.gov/articles/PMC4008059/]
- 13. Presentation of Quantitative Data [https://ihatepsm.com/blog/presentation-quantitative-data]
- 14. Potential effects of endocrine-disrupting chemicals on ... [https://www.sciencedirect.com/science/article/pii/S0147651325010462]
- 15. Uncovering the hidden challenges of ED triage [https://nursingncal.kaiserpermanente.org/pediedtriage/]
- 16. The Geriatric Emergency Department Guidelines 2.0 - PMC [https://pmc.ncbi.nlm.nih.gov/articles/PMC12476112/]
- 17. Frailty, multimorbidity, and polypharmacy: Proposal of the ... [https://pmc.ncbi.nlm.nih.gov/articles/PMC12055515/]
- 18. Geriatric Syndromes and Their Relationship with Mortality ... [https://www.mdpi.com/2227-9032/12/12/1166]
- 19. Development and validation of a survey on reproductive ... [https://www.frontiersin.org/journals/reproductive-health/articles/10.3389/frph.2025.1519896/full]
- 20. Atypical presentations of older adults at the emergency ... [https://www.sciencedirect.com/science/article/abs/pii/S0167494315300480]
- 21. The clinical frailty scale improves risk prediction in older ... [https://www.nature.com/articles/s41598-025-97764-z]
- 22. Identifying Deprescribing Opportunities With Large Language ... [https://aging.jmir.org/2025/1/e69504/]
- 23. The effectiveness of checklists and error reporting systems in... [https://pubmed.ncbi.nlm.nih.gov/39156684/]
- 24. The development of checklists and reference charts for ... [https://www.sciencedirect.com/science/article/abs/pii/S1090379824001612]
- 25. Validation of an Infarction Code Care Checklist and Determination of... [https://www.researchprotocols.org/2025/1/e66584]
- 26. Delphi methodology in healthcare research: How to decide its ... [https://pmc.ncbi.nlm.nih.gov/articles/PMC8299905/]
- 27. EHR and EDC Integration in Reality [https://www.appliedclinicaltrialsonline.com/view/ehr-and-edc-integration-reality]
- 28. Revisiting the Delphi technique - Research thinking and ... [https://www.sciencedirect.com/science/article/pii/S0020748925001282]
- 29. The Delphi method: A comprehensive guide for group ... [https://www.1000minds.com/decision-making/delphi-method]
- 30. How Delphi studies in the health sciences find consensus [https://systematicreviewsjournal.biomedcentral.com/articles/10.1186/s13643-024-02738-3]
- 31. Checklists to reduce diagnostic error: a systematic review of ... [https://pmc.ncbi.nlm.nih.gov/articles/PMC9058772/]
- 32. Caring for Adult Patients with Suicide Risk [https://edc.org/resources/caring-for-adult-patients-with-suicide-risk-a-consensus-guide-for-emergency-departments/]
- 33. Emergency pediatric patients and use of the pediatric ... [https://bmcemergmed.biomedcentral.com/articles/10.1186/s12873-024-01068-w]
- 34. Clinical validity of the Pediatric Assessment Triangle in a ... [https://www.frontiersin.org/journals/pediatrics/articles/10.3389/fped.2025.1435604/full]
- 35. Performance of triage systems in emergency care [https://pubmed.ncbi.nlm.nih.gov/31142524/]
- 36. EMS Use of the Pediatric Assessment Triangle in ... [https://pubmed.ncbi.nlm.nih.gov/41222589/]
- 37. Community-based insights into the connection between ... [https://www.sciencedirect.com/science/article/pii/S2666027X25000118]
- 38. Optimizing Medications with the Geriatrics 5Ms: An Age- ... [https://pmc.ncbi.nlm.nih.gov/articles/PMC10092911/]
- 39. Assessing Geriatric Competencies in Residents: Validating ... [https://pmc.ncbi.nlm.nih.gov/articles/PMC12360228/]
- 40. Using the 5Ms Framework to Advance Aging-Responsive ... [https://pmc.ncbi.nlm.nih.gov/articles/PMC11932137/]
- 41. "A Movement Framework for Older Adults: Application of the ... [https://digitalcommons.sacredheart.edu/pthms_ptfac/91/]
- 42. Best Electronic Data Capture (EDC) Software in 2024 [https://www.octalsoft.com/best-electronic-data-capture-edc-software-in-2024-octalsoft/]
- 43. Mobile electronic versus paper case report forms in clinical ... [https://pmc.ncbi.nlm.nih.gov/articles/PMC5709849/]
- 44. Development of an Emergency Department Safety Checklist ... [https://pmc.ncbi.nlm.nih.gov/articles/PMC12130094/]
- 45. Protocol for an effectiveness implementation trial [https://www.sciencedirect.com/science/article/pii/S1551714425001041]
- 46. Socioeconomic status in the association between use of ... [https://pmc.ncbi.nlm.nih.gov/articles/PMC12019293/]
- 47. implementation strategies derived from normalization process ... [https://implementationscience.biomedcentral.com/articles/10.1186/s13012-025-01444-5]
- 48. Nuancing the continuum from ideal to real-world implementation [https://pmc.ncbi.nlm.nih.gov/articles/PMC12579398/]
- 49. Decentralized Clinical Trial Platforms in 2025 - Castor EDC [https://www.castoredc.com/insight-briefs/decentralized-clinical-trial-platforms-in-2025-a-practical-guide-for-clinical-operations/]
- 50. Usability and Evaluation of a Health Information System in the ... [https://humanfactors.jmir.org/2024/1/e48445]
- 51. The mixed effect of Endocrine-Disrupting chemicals on ... [https://www.sciencedirect.com/science/article/pii/S0160412024000333]
- 52. AI in Clinical Study Builds: Redefining EDC Efficiency [https://www.medidata.com/en/life-science-resources/medidata-blog/ai-study-build/]
- 53. Endocrine-Disrupting Chemicals Exposure and ... - PMC [https://pmc.ncbi.nlm.nih.gov/articles/PMC11281080/]
- 54. Socioeconomic status in the association between use of ... [https://www.frontiersin.org/journals/public-health/articles/10.3389/fpubh.2025.1537669/full]
- 55. Opportunities, barriers, and remedies for implementing ... [https://pmc.ncbi.nlm.nih.gov/articles/PMC12494410/]
- 56. The Best Electronic Data Capture (EDC) Systems in 2025 [https://swissdidata.com/blog/best-edc-systems]
- 57. Implementation of the WHO surgical safety checklist in ... [https://pmc.ncbi.nlm.nih.gov/articles/PMC11472478/]
- 58. Crossing the quality chasm in resource-limited settings [https://globalizationandhealth.biomedcentral.com/articles/10.1186/1744-8603-8-41]
- 59. Supporting research sites in resource-limited settings [https://pmc.ncbi.nlm.nih.gov/articles/PMC4195443/]
- 60. Top Electronic Data Capture (EDC) Systems for Clinical ... [https://ccrps.org/clinical-research-blog/directory-of-electronic-data-capture-edc-systems-for-clinical-trials]
- 61. EHR-to-EDC Trends 2025 | Global Insights from Yonalink [https://www.yonalink.com/blog-posts/ehr-to-edc-trends-2025]
- 62. Evidence-based practices for prevention and management ... [https://www.frontiersin.org/journals/medicine/articles/10.3389/fmed.2025.1551222/full]
- 63. Alarm fatigue in healthcare: a scoping review of definitions ... [https://pmc.ncbi.nlm.nih.gov/articles/PMC12181921/]
- 64. Usability Evaluation of an Offline Electronic Data Capture App ... [https://pmc.ncbi.nlm.nih.gov/articles/PMC8600440/]
- 65. Evaluating the Impact of Electronic Health Record to ... [https://pmc.ncbi.nlm.nih.gov/articles/PMC12574785/]
- 66. A usability design checklist for Mobile electronic data ... [https://bmcmedinformdecismak.biomedcentral.com/articles/10.1186/s12911-018-0718-3]
- 67. Comparing Top Clinical Trial EDC Systems [https://www.bioaccessla.com/blog/comparing-top-clinical-trial-edc-systems-features-benefits-and-drawbacks]
- 68. Model for Improvement [https://www.ihi.org/library/model-for-improvement]
- 69. Comparison of Older and Younger Adults' Attitudes Toward ... [https://pmc.ncbi.nlm.nih.gov/articles/PMC7644379/]
- 70. Quality Improvement Methods (LEAN, PDSA, SIX SIGMA) - NCBI [https://www.ncbi.nlm.nih.gov/books/NBK599556/]
- 71. EHR Operations and More Effective PDSA Cycles [https://www.phrasehealth.com/ehr-operations-and-more-effective-pdsa-cycles]
- 72. Implementing a national Dutch PEWS system in 12 hospitals ... [https://pmc.ncbi.nlm.nih.gov/articles/PMC11950935/]
- 73. Validation of the exercise and eating disorder questionnaire in ... [https://pmc.ncbi.nlm.nih.gov/articles/PMC6001437/]
- 74. Comparison of Electronic Data Capture (EDC) with the ... [https://pmc.ncbi.nlm.nih.gov/articles/PMC3179496/]
- 75. Top 100 Clinical Data Management & EDC Platforms ... [https://ccrps.org/clinical-research-blog/top-100-clinical-data-management-amp-edc-platforms-complete-2025-buyers-guide]
- 76. Eating Disorder Examination Questionnaire (EDE-Q) [https://www.corc.uk.net/outcome-measures-guidance/directory-of-outcome-measures/eating-disorder-examination-questionnaire-ede-q/]
- 77. External validation of the Vulnerable Elder's Survey for ... [https://bmcgeriatr.biomedcentral.com/articles/10.1186/s12877-017-0460-1]
- 78. , Sensitivity , Receiver-Operating Characteristic... Specificity [https://pmc.ncbi.nlm.nih.gov/articles/PMC2556590/]
- 79. and Sensitivity - Wikipedia specificity [https://en.wikipedia.org/wiki/Sensitivity_and_specificity]
- 80. Frontiers | Sensitivity , Specificity , and Predictive Values: Foundations... [https://www.frontiersin.org/journals/public-health/articles/10.3389/fpubh.2017.00307/full]
- 81. Further development of the 12-item EDE-QS - BMC Psychiatry [https://bmcpsychiatry.biomedcentral.com/articles/10.1186/s12888-020-02565-5]
- 82. Development and Validation of a Novel Screening Tool for ... [https://micronanoeducation.org/journal/volume-4-issue-1/development-and-validation-of-a-novel-screening-tool-for-predicting-substance-use-disorder-risk-using-machine-learning/]
- 83. Psychometric Evaluation of the Eating Disorder ... [https://pmc.ncbi.nlm.nih.gov/articles/PMC3668855/]
- 84. Development and Psychometric Validation of the EDE-QS, a ... [https://journals.plos.org/plosone/article?id=10.1371/journal.pone.0152744]
- 85. The Ultimate Guide to Electronic Data Capture for Clinical ... [https://www.quanticate.com/blog/electronic-data-capture-systems-in-clinical-trials]
- 86. What is an EDC System and How Does it Support Clinical ... [https://namsa.com/resources/blog/what-is-electronic-data-capture-in-clinical-trials/]
- 87. Advarra EDC Validation Packet [https://www.advarra.com/info-sheet/advarra-esource-edc-validation-packet/]
- 88. Interagency Integrated Triage Tool [https://www.who.int/tools/triage]
- 89. Comparison between the Smart Triage model and the ... [https://pmc.ncbi.nlm.nih.gov/articles/PMC11293692/]
- 90. Clinical validity of the Pediatric Assessment Triangle in a ... [https://pmc.ncbi.nlm.nih.gov/articles/PMC12106306/]
- 91. Assessment of the Value of the PAT as the First Step in ... [https://brieflands.com/journals/apid/articles/128551]
- 92. Development of an emergency department triage tool to ... [https://pmc.ncbi.nlm.nih.gov/articles/PMC11827304/]
- 93. Predicting Mortality in Older Adults Using Comprehensive ... [https://pmc.ncbi.nlm.nih.gov/articles/PMC12523355/]
- 94. The Value of Geriatric Assessments in Predicting ... [https://pmc.ncbi.nlm.nih.gov/articles/PMC3500366/]
- 95. Home FIRsT: interdisciplinary geriatric assessment and ... [https://www.sciencedirect.com/science/article/pii/S0953620520304258]
- 96. Predicting hospital discharge disposition in geriatric trauma ... [https://pubmed.ncbi.nlm.nih.gov/24368379/]
- 97. Risk assessment tools to predict location of discharge and ... [https://systematicreviewsjournal.biomedcentral.com/articles/10.1186/s13643-016-0401-7]
- 98. Bibliometric and visual analysis of global research on ... [https://pmc.ncbi.nlm.nih.gov/articles/PMC12532360/]
- 99. Endocrine disruptors: Challenges and future directions in ... [https://www.sciencedirect.com/science/article/pii/S0013935121012640]
- 100. Assessing the performance of paediatric early warning scores ... [https://pmc.ncbi.nlm.nih.gov/articles/PMC12220617/]
- 101. A Senior-Friendly ED Checklist - Geriatric-ED.com [https://geriatric-ed.com/complete-checklist/]
- 102. The Potential to Leverage Real-World Data for Pediatric ... [https://www.jmir.org/2025/1/e72573]
- 103. Patient-Centered Pharmaceutical Design to Improve ... [https://pmc.ncbi.nlm.nih.gov/articles/PMC4210646/]