Saliva Hormone Analysis by LC-MS/MS: A Comprehensive Guide for Researchers in Endocrine Profiling and Drug Development
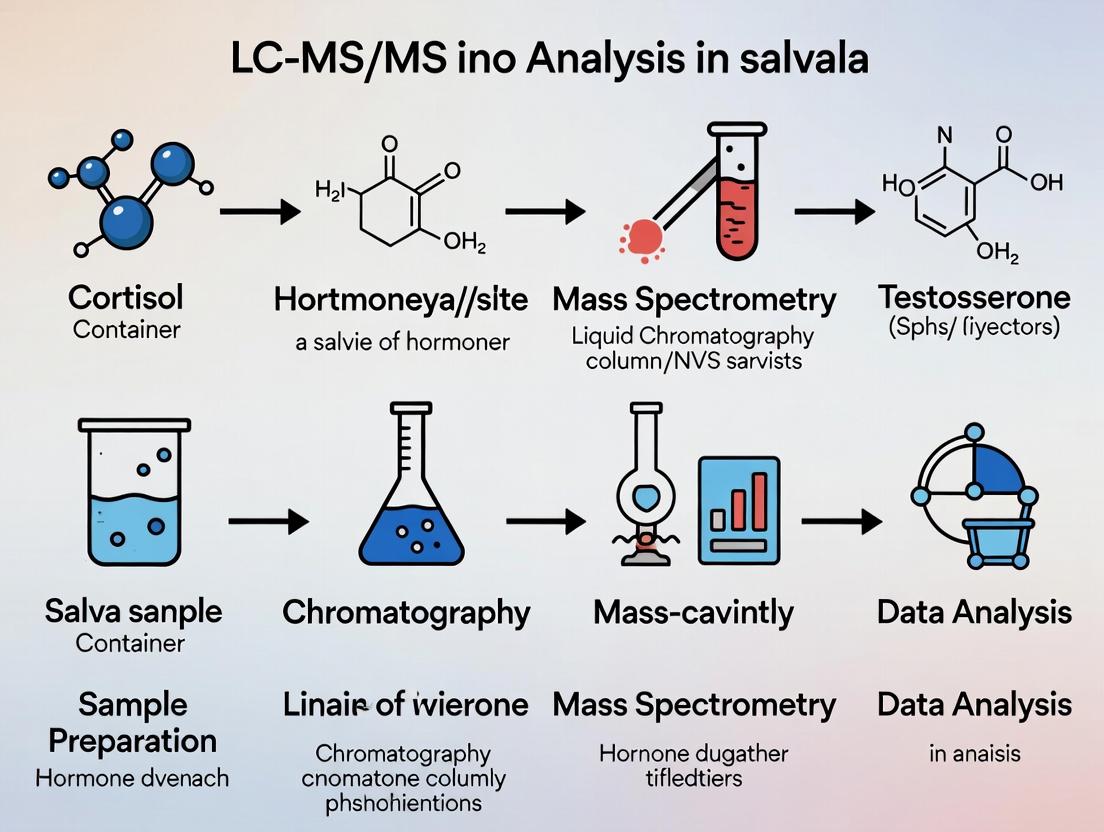
This article provides a detailed overview of liquid chromatography-tandem mass spectrometry (LC-MS/MS) for salivary hormone analysis, tailored for researchers, scientists, and drug development professionals.
Saliva Hormone Analysis by LC-MS/MS: A Comprehensive Guide for Researchers in Endocrine Profiling and Drug Development
Abstract
This article provides a detailed overview of liquid chromatography-tandem mass spectrometry (LC-MS/MS) for salivary hormone analysis, tailored for researchers, scientists, and drug development professionals. It explores the scientific rationale for using saliva as a diagnostic matrix, outlines robust methodological workflows for steroid and peptide hormone quantification, addresses common analytical challenges and optimization strategies, and critically evaluates the validation parameters and comparative advantages of LC-MS/MS over immunoassays. The content synthesizes current best practices to support high-quality research in stress biology, endocrinology, pharmacokinetics, and clinical biomarker discovery.
Why Saliva? The Scientific Rationale and Scope of LC-MS/MS for Hormone Profiling
Technical Context in LC-MS/MS Hormone Analysis Research
Within the framework of advanced thesis research on hormone analysis via Liquid Chromatography-Tandem Mass Spectrometry (LC-MS/MS), saliva has emerged as a critical matrix. Its non-invasive nature facilitates high-frequency, dynamic sampling—essential for capturing circadian rhythms, pulsatile secretion, and stress responses—unattainable through single-point blood draws. This whitepaper details the technical validation, methodologies, and applications central to this research paradigm.
Analytical Validation: Saliva vs. Serum/Plasma
Quantitative recovery and correlation with serum free hormone concentrations are paramount. The following table summarizes key validation data for representative steroid and thyroid hormones.
Table 1: Correlation and Recovery of Select Hormones in Saliva vs. Serum (LC-MS/MS Analysis)
| Analyte | Mean Correlation (r) with Serum Free Fraction | Typical Salivary Concentration Range | Mean Recovery (%) in Saliva | Key Pre-Analytical Consideration |
|---|---|---|---|---|
| Cortisol | 0.85 - 0.95 | 0.5 - 10 nmol/L (diurnal) | 92-105 | Avoid citric acid strips; cotton roll interference. |
| Testosterone | 0.90 - 0.98 (in males) | 50 - 250 pmol/L (male) | 95-102 | Passive drool preferred; gender-dependent ranges. |
| DHEA-S | 0.70 - 0.85 | 1 - 10 nmol/L | 88-95 | Less diurnal variation; high stability. |
| Progesterone | 0.80 - 0.90 | 5 - 100 pmol/L (cycle-dependent) | 90-98 | Critical timing relative to menstrual cycle. |
| Melatonin | 0.89 - 0.94 | 1 - 50 pg/mL | 85-94 | Strict light control during collection. |
| fT3 | 0.75 - 0.85 | 0.2 - 0.5 pg/mL | 80-90 | Requires highly sensitive assay. |
Detailed Experimental Protocols
Protocol 1: Standardized Saliva Collection for Dynamic Monitoring
- Materials: Pre-barcoded, polymer-based saliva collection tubes (e.g., Salivettes without additives), freezer (-80°C), timer.
- Procedure:
- Participant Preparation: No food, drink (except water), or tooth brushing for 60 minutes prior. Rinse mouth with water 10 minutes before.
- Sampling: Participant passively drools through a straw into the tube or places a synthetic swab in mouth until saturation (~2 min). For dynamic/circadian studies, collect at strict intervals (e.g., 0, 15, 30, 60 min post-waking, or hourly).
- Processing: Centrifuge swab/passive drool sample at 1500 x g for 15 minutes at 4°C. Transfer clear supernatant to a cryovial.
- Storage: Aliquot and freeze at ≤-20°C immediately; -80°C for long-term storage. Avoid freeze-thaw cycles.
Protocol 2: LC-MS/MS Analysis of Salivary Steroids (e.g., Cortisol, Testosterone)
- Materials: LC-MS/MS system (triple quadrupole), C18 reversed-phase column, solid-phase extraction (SPE) plates, deuterated internal standards (e.g., Cortisol-d4, Testosterone-d3), methanol, ammonium acetate.
- Procedure:
- Extraction: Thaw samples on ice. Add 50 µL of saliva to 200 µL of methanol containing isotopic internal standards. Vortex, centrifuge (13,000 x g, 10 min).
- Clean-up: Apply supernatant to a conditioned SPE cartridge (Oasis HLB). Wash with water/5% methanol. Elute with 80:20 ethyl acetate:hexane.
- Chromatography: Reconstitute in mobile phase A (0.1% formic acid in water). Inject onto LC. Gradient elution from 30% to 95% mobile phase B (0.1% formic acid in acetonitrile) over 8 min.
- MS Detection: Electrospray Ionization (ESI+) for steroids. Monitor 2-3 multiple reaction monitoring (MRM) transitions per analyte. Quantify via internal standard calibration curve.
Visualized Workflows and Pathways
Saliva Hormone Analysis Workflow
HPA Axis & Salivary Cortisol Feedback
The Scientist's Toolkit: Key Research Reagent Solutions
Table 2: Essential Materials for Salivary Hormone LC-MS/MS Research
| Item | Function & Rationale |
|---|---|
| Polymer-based Saliva Collection Tubes | Minimize analyte adsorption; no interference from cotton (which can bind steroids). |
| Deuterated Internal Standards (IS) | Correct for matrix effects and recovery losses during sample prep; essential for accurate LC-MS/MS quantification. |
| Mixed-mode SPE Cartridges (e.g., Oasis HLB) | Remove salts, proteins, and phospholipids, reducing ion suppression and column fouling. |
| LC-MS/MS Grade Solvents | High purity minimizes background noise and prevents instrument contamination. |
| Stable Calibrators & QC Pools | Prepared in artificial saliva for matrix-matched calibration; required for assay validation and daily run quality control. |
| Protein Precipitation Solvent (e.g., Methanol with 1% Formic Acid) | Denatures and precipitates salivary mucins and proteins, releasing bound hormones. |
| Specific Antibody-coated Beads (for Immunoextraction) | Used in hybrid methods (e.g., LC-MS/MS after immunoaffinity cleanup) for ultra-low level analytes (e.g., estradiol). |
Saliva has emerged as a critical biofluid for steroid hormone analysis, offering non-invasive collection, correlation with free, biologically active hormone concentrations, and suitability for dynamic, high-frequency sampling. Within the context of advancing liquid chromatography-tandem mass spectrometry (LC-MS/MS) research, saliva provides a complex but advantageous matrix. This whitepaper details the core steroids measurable in saliva, extends to other hormone classes, and provides a technical framework for their quantitative analysis via LC-MS/MS, the current gold standard for specificity and sensitivity.
Core Steroid Hormones in Saliva: Physiology and Significance
Cortisol
The primary glucocorticoid, salivary cortisol reflects the unbound, biologically active fraction (~5-10% of total serum cortisol). It is the cornerstone of hypothalamic-pituitary-adrenal (HPA) axis assessment, with a well-characterized diurnal rhythm.
Dehydroepiandrosterone-sulfate (DHEA-S)
A sulfated androgen precursor, DHEA-S in saliva is derived from passive diffusion from serum. It serves as a stable marker of adrenal androgen production and is often analyzed alongside cortisol to assess the cortisol/DHEA-S ratio, an indicator of hormonal balance and stress load.
Testosterone
Salivary testosterone correlates with the free serum fraction and is used in studies of aggression, competition, sexual function, and endocrine disorders in both males and females.
Progesterone
Salivary progesterone tracks the free hormone, useful in monitoring the luteal phase, assessing ovarian function, and in neuroendocrine research due to its neuroactive metabolites.
Estradiol (E2)
Despite low concentrations (especially in men and postmenopausal women), salivary E2 measurement via LC-MS/MS is feasible. It is applied in fertility monitoring, menopausal research, and hormonal perturbation studies.
Table 1: Core Salivary Steroids: Physiological Ranges and Analytical Considerations
| Hormone | Approximate Salivary Range (LC-MS/MS) | Diurnal Variation | Key Physiological Role | Primary Challenge in Analysis |
|---|---|---|---|---|
| Cortisol | 0.5 - 20 nmol/L (varies diurnally) | High (peak AM) | Stress response, metabolism, immune modulation | Matrix effects, high dynamic range |
| DHEA-S | 1 - 10 nmol/L (adults) | Minimal | Adrenal androgen precursor, antagonist to cortisol effects | High concentration relative to other steroids |
| Testosterone | Men: 100 - 250 pmol/L; Women: 5 - 25 pmol/L | Moderate (peak AM) | Anabolism, libido, aggression | Very low concentrations in women/children |
| Progesterone | Follicular: <100 pmol/L; Luteal: >300 pmol/L | Minimal (cyclic) | Prepare endometrium, neurosteroid precursor | Requires high sensitivity for follicular phase |
| Estradiol (E2) | Men: 2-5 pmol/L; Women: 1-15 pmol/L (varies cyclically) | Minimal (cyclic) | Sexual development, menstrual cycle regulation | Extremely low concentration, requires utmost sensitivity |
Beyond Steroids: Other Hormones Measurable in Saliva
LC-MS/MS and immunoassay platforms enable measurement of additional hormonal biomarkers:
- Melatonin: Key circadian rhythm regulator; saliva tracks plasma free fraction.
- Aldosterone: Primary mineralocorticoid; relevant in hypertension and adrenal research.
- Immunoreactive Hormones: Various cytokines (e.g., IL-1β, IL-6) and immunoglobulin A (IgA) as markers of local immune response.
Experimental Protocol: LC-MS/MS Analysis of Salivary Steroids
Protocol Title: Quantitative Analysis of Five Core Steroids in Human Saliva via Liquid Chromatography-Tandem Mass Spectrometry (LC-MS/MS)
1. Sample Collection & Pre-Processing:
- Collection: Use inert polymer-based salivettes. Avoid citric acid-treated rolls. Collect typically 1-2 mL. Instruct participants to avoid eating, drinking, or brushing teeth 60 minutes prior.
- Centrifugation: Clarify samples at 4°C, 3000 x g for 10 minutes. Aliquot supernatant into low-binding microtubes.
- Storage: Store at ≤ -20°C for short-term; ≤ -80°C for long-term stability. Avoid freeze-thaw cycles.
2. Sample Preparation (Solid Phase Extraction - SPE):
- Thawing & Aliquot: Thaw samples on ice. Transfer 200-500 µL of saliva to a clean tube.
- Internal Standard Addition: Add a known quantity of stable isotope-labeled internal standards (IS) for each analyte (e.g., Cortisol-d4, Testosterone-d3, Estradiol-d4).
- Protein Precipitation/Dilution: Dilute sample 1:1 with 0.1% formic acid in water or a dedicated precipitation solution. Vortex mix.
- SPE Clean-up: Load onto pre-conditioned (methanol, water) reversed-phase C18 SPE columns. Wash with 15-20% methanol/water. Elute analytes with 100% methanol or acetonitrile.
- Evaporation & Reconstitution: Dry eluents under a gentle stream of nitrogen at 40-45°C. Reconstitute dry extract in 50-100 µL of initial mobile phase (e.g., 30% methanol/70% water). Vortex thoroughly and centrifuge.
3. LC-MS/MS Analysis:
- Chromatography: Reversed-phase C18 column (e.g., 2.1 x 50 mm, 1.7-1.8 µm). Temperature: 40-50°C.
- Mobile Phase A: 0.1% Formic Acid in Water.
- Mobile Phase B: 0.1% Formic Acid in Methanol or Acetonitrile.
- Gradient: Start at 30% B, ramp to 95% B over 5-7 minutes, hold, re-equilibrate.
- Mass Spectrometry: Triple quadrupole MS with ESI+ (for most steroids) or ESI- (e.g., for cortisol, DHEA-S) ionization.
- Monitor 2-3 multiple reaction monitoring (MRM) transitions per analyte (one quantifier, one/two qualifiers).
- Optimize source parameters (gas temps, voltages) and collision energies for each MRM.
4. Data Analysis:
- Calibration: Use matrix-matched calibration curves (in stripped saliva or synthetic saliva) spanning the physiological range. Linear or quadratic regression with 1/x weighting is typical.
- Quantification: Peak area ratios (analyte/IS) are plotted against the calibration curve.
- Validation: Assay must be validated for precision (intra-/inter-assay CV <15%), accuracy (85-115% recovery), sensitivity (LLOQ), matrix effects, and carryover per FDA/EMA bioanalytical guidelines.
Diagram 1: LC-MS/MS Workflow for Salivary Hormones
Diagram 2: HPA Axis & Salivary Cortisol Pathway
The Scientist's Toolkit: Essential Research Reagent Solutions
Table 2: Key Reagents & Materials for Salivary Hormone LC-MS/MS
| Item / Reagent | Function / Purpose | Critical Specification / Note |
|---|---|---|
| Polymer-based Salivette | Inert saliva collection device. | Preferred over cotton (may interfere). Ensure lot consistency. |
| Stable Isotope-Labeled Internal Standards (IS) | Correct for losses during prep and matrix effects during ionization. | Use deuterated (d3, d4, d9) analogs for each target analyte. Purity >97%. |
| Stripped/Synthetic Saliva Matrix | Used to prepare calibration standards and quality controls. | Must be validated for lack of endogenous analyte and comparable matrix effects. |
| Solid Phase Extraction (SPE) Plates/Columns | Clean-up and concentrate analytes, remove interfering salts and proteins. | Typically reversed-phase C18 or mixed-mode phases. 96-well format for high throughput. |
| LC-MS Grade Solvents (Water, Methanol, Acetonitrile) | Mobile phase components. Minimize background noise and ion suppression. | Low UV absorbance, low particulate matter. |
| Volatile Buffer/Additive (Formic Acid, Ammonium Acetate) | Modifies mobile phase pH to optimize analyte ionization in MS source. | Use highest purity (e.g., Optima LC-MS grade). |
| Mass Spectrometry Tuning & Calibration Solution | Calibrates and optimizes mass accuracy and sensitivity of the MS instrument. | Specific to instrument manufacturer (e.g., Pierce LTQ Velos ESI). |
| Certified Reference Standards (for each analyte) | Prepare primary stock solutions for calibration curves. | Traceable to NIST or other certified bodies. Document purity and storage. |
Within the expanding field of salivary hormone analysis, Liquid Chromatography-Tandem Mass Spectrometry (LC-MS/MS) has emerged as the premier analytical platform for research and drug development. Its dominance is underpinned by three core pillars: exceptional selectivity, high sensitivity, and unparalleled multi-analyte capability. This technical guide elucidates these principles, framing them within the specific challenges and requirements of robust, high-throughput salivary hormone research.
Selectivity: Resolving Analytical Specificity
Selectivity in LC-MS/MS refers to the ability to distinguish and accurately measure a target analyte in a complex biological matrix like saliva, which contains salts, mucins, and interfering compounds.
Mechanisms:
- Chromatographic Selectivity: Achieved via reversed-phase, hydrophilic interaction liquid chromatography (HILIC), or specialized columns (e.g., core-shell C18) that separate analytes based on hydrophobicity, polarity, and size.
- Mass Spectrometric Selectivity: A two-stage process. The first quadrupole (Q1) selects the precursor ion (parent ion) of the target analyte. After fragmentation in the collision cell (Q2), the third quadrupole (Q3) selects a specific product ion. This Selected Reaction Monitoring (SRM) or Multiple Reaction Monitoring (MRM) process provides a unique "fingerprint" for each compound.
Experimental Protocol for Enhancing Selectivity in Saliva:
- Sample Preparation: 500 µL of saliva is mixed with 50 µL of an isotopically labeled internal standard (IS) solution. Protein precipitation is performed using 1 mL of cold methanol:acetonitrile (1:1, v/v). Samples are vortexed, centrifuged (15,000 x g, 10 min, 4°C), and the supernatant is evaporated to dryness under nitrogen.
- Derivatization (Optional): For polar steroids (e.g., cortisol, estradiol), the dry extract is reconstituted in 100 µL of hydroxylamine hydrochloride (1% in water) and incubated at 60°C for 1 hour to form oximes, enhancing chromatographic retention and ESI ionization.
- LC Separation: The reconstituted extract is injected onto a Kinetex C18 column (2.6 µm, 100 x 2.1 mm) maintained at 50°C. A binary gradient of water (A) and methanol (B), both with 0.1% formic acid, runs from 30% B to 95% B over 8 minutes at 0.4 mL/min.
- MS/MS Detection: Electrospray ionization (ESI) in positive mode. For each hormone, 2-3 optimized SRM transitions are monitored (quantifier and qualifiers). Dwell times are set to ≥ 20 ms per transition.
Table 1: Selectivity Metrics for Key Salivary Hormones via LC-MS/MS
| Hormone Class | Example Analyte | Precursor Ion (m/z) | Product Ion (m/z) (Quantifier) | Retention Time (min) | Resolution from Nearest Interferent |
|---|---|---|---|---|---|
| Glucocorticoid | Cortisol | 363.2 | 121.1* | 4.2 | >1.5 (from cortisone) |
| Androgen | Testosterone | 289.2 | 97.1 | 6.1 | >2.0 (from DHEA) |
| Estrogen | 17β-Estradiol | 271.2 | 145.1 | 5.4 | >3.0 (from estrone) |
| Melatonin | Melatonin | 233.1 | 174.1 | 3.8 | >2.5 |
*Derivatized as oxime; precursor [M+H]+.
Sensitivity: Pushing Detection Limits
Sensitivity defines the lowest amount of an analyte that can be reliably detected (LOD) and quantified (LOQ). It is critical for measuring low-abundance hormones in saliva (e.g., estradiol at pg/mL levels).
Key Factors:
- Ionization Efficiency: Optimized spray voltage, source temperature, and nebulizer gas.
- Signal-to-Noise Ratio (S/N): Enhanced by reducing chemical noise via sample clean-up and using high-purity reagents.
- Duty Cycle: Time spent monitoring each SRM transition.
Experimental Protocol for Sensitivity Optimization:
- Matrix Effect Assessment: Prepare calibration standards in charcoal-stripped saliva (for matrix-matched calibration) and in pure solvent. Compare slopes to calculate matrix effect (%ME). Aim for |%ME| < 15% through optimized sample preparation.
- Low-Level QC Preparation: Spiking stripped saliva with hormones at concentrations 3x and 10x the anticipated LOQ. Analyze six replicates across three separate batches.
- LOD/LOQ Determination: LOD is defined as the concentration yielding a S/N ≥ 3. LOQ is defined as the lowest concentration on the calibration curve that can be quantified with an accuracy of 80-120% and a precision (CV) ≤ 20%. It must also have a S/N ≥ 10.
Table 2: Sensitivity Benchmarks for Salivary Hormones by LC-MS/MS
| Analyte | Typical Salivary Range | Achievable LOD (LC-MS/MS) | Achievable LOQ (LC-MS/MS) | Primary Ionization Mode |
|---|---|---|---|---|
| Cortisol | 0.5 - 25 ng/mL | 0.05 ng/mL | 0.15 ng/mL | ESI+ (Derivatized) |
| Testosterone | 20 - 200 pg/mL (M) | 0.5 pg/mL | 2.0 pg/mL | APCI+ |
| DHEA | 50 - 500 pg/mL | 5 pg/mL | 15 pg/mL | ESI+ |
| Progesterone | 10 - 100 pg/mL | 1 pg/mL | 3 pg/mL | APCI+ |
| 17β-Estradiol | 0.5 - 10 pg/mL | 0.1 pg/mL | 0.3 pg/mL | ESI- (Derivatized) |
Multi-Analyte Capability: High-Throughput Profiling
Multi-analyte capability allows the simultaneous quantification of dozens of hormones from a single, small-volume saliva sample, enabling comprehensive endocrine profiling.
Technical Implementation:
- Scheduled SRM: SRM transitions are monitored only around their expected retention time windows, increasing the number of detectable analytes without sacrificing dwell time or data point density.
- Fast Chromatography: Using columns with sub-2 µm or core-shell particles allows for steep gradients and cycle times under 5-7 minutes.
- Polarity Switching: Modern mass spectrometers can rapidly switch between positive and negative ionization modes within a single run.
Experimental Protocol for a 15-Panel Steroid Hormone Assay:
- Sample Workflow: 200 µL of saliva is processed via supported-liquid extraction (SLE) using 96-well plates. Isotopically labeled IS for all 15 analytes is added before extraction.
- Chromatography: A 5.5-minute gradient on a Kinetex Biphenyl column (2.6 µm, 50 x 2.1 mm) with water and methanol (+ 0.1% formic acid, 2 mM ammonium fluoride).
- MS Analysis: Polarity switching is enabled. Over 60 SRM transitions (2-3 per analyte, plus IS) are monitored in scheduled mode with a 60-second window.
Diagram 1: LC-MS/MS SRM Workflow Principle
Diagram 2: Saliva Hormone Analysis Workflow
The Scientist's Toolkit: Research Reagent Solutions
Table 3: Essential Materials for Salivary Hormone LC-MS/MS
| Item | Function & Specification | Example/Catalog Note |
|---|---|---|
| Internal Standards | Correct for matrix effects & recovery losses; deuterated (d3, d5) or 13C-labeled analogs of each target hormone. | Cortisol-d4, Testosterone-d3, Estradiol-d4 (e.g., Cerilliant, IsoSciences) |
| Charcoal-Stripped Saliva | Provides a hormone-free matrix for preparing calibration standards and QC samples, essential for accuracy. | Pooled human saliva, stripped (e.g., Lee Biosolutions) or prepared in-house. |
| Supported-Liquid Extraction (SLE) Plates | High-throughput, reproducible clean-up of saliva; removes phospholipids and salts that cause ion suppression. | ISOLUTE SLE+ 96-well plates (Biotage) or equivalent. |
| LC Column | Provides chromatographic selectivity for steroids; core-shell biphenyl or C18 phases are common. | Kinetex Biphenyl, 2.6 µm, 50-100 x 2.1 mm (Phenomenex). |
| Derivatization Reagent | Enhances ionization efficiency and retention of polar steroids (e.g., estrogens, cortisol). | Hydroxylamine hydrochloride or Girard's Reagent P. |
| Mobile Phase Additives | Promote ionization and control chromatographic peak shape; high purity is critical for sensitivity. | Optima LC/MS grade Formic Acid, Ammonium Fluoride (Fisher Chemical). |
| Mass Spectrometer Tuning Solution | Calibrates and optimizes instrument mass accuracy and sensitivity for the relevant mass range. | ESI/APCI Tuning Mix for positive/negative mode (e.g., Agilent, SCIEX). |
The synergy of selectivity, sensitivity, and multi-analyte capability solidifies LC-MS/MS as the cornerstone technology for modern salivary hormone research. By leveraging precise chromatographic separations, specific SRM detection, and high-throughput workflows, researchers can obtain reliable, multiplexed quantitative data from small saliva volumes. This capability is indispensable for advancing studies in stress biology, endocrinology, and clinical drug development, where comprehensive hormonal profiling is paramount.
Liquid Chromatography-Tandem Mass Spectrometry (LC-MS/MS) has emerged as the gold standard for the multiplexed, sensitive, and specific quantification of steroid hormones and other small molecules in biological matrices. Within endocrine research, saliva collection offers a non-invasive, stress-free method to sample the biologically active, free fraction of hormones, which readily diffuse from plasma. This whitepaper details the core research advantages of integrating salivary LC-MS/MS analysis for investigations centered on the critical correlation with free, bioactive hormones and the dynamic profiling of circadian rhythms. This approach is fundamental to a broader thesis advancing personalized medicine, neuroendocrine research, and chronopharmacology.
Core Advantage 1: Direct Correlation with Free Bioactive Hormones
Unlike immunoassays, which may cross-react with bound or inactive metabolites, LC-MS/MS directly quantifies specific molecular analytes. In saliva, this translates to an unparalleled ability to measure the unbound, tissue-available hormone fraction.
Scientific Rationale: Only free hormones (e.g., cortisol, testosterone, progesterone, estradiol) are biologically active, crossing cell membranes to bind intracellular receptors and exert genomic and non-genomic effects. Serum total hormone measurements can be misleading in conditions altering binding globulins (SHBG, CBG). Salivary LC-MS/MS provides a direct window into this physiologically relevant pool.
Quantitative Data Summary:
Table 1: Comparison of Hormone Measurement Approaches
| Aspect | Serum Immunoassay (Total) | Serum LC-MS/MS (Total/Free) | Saliva LC-MS/MS (Free) |
|---|---|---|---|
| Analyte Specificity | Low; cross-reactivity with metabolites | High; exact mass detection | Very High; exact mass detection |
| Bioactive Fraction | Indirect (calculated) | Direct for free (if equilibrium dialysis used) | Directly measured |
| Sample Collection | Invasive (venipuncture), stressful | Invasive (venipuncture), stressful | Non-invasive, stress-free, home collection |
| Circadian Profiling Feasibility | Low (limited timepoints) | Low (limited timepoints) | High (frequent sampling possible) |
| Key Correlation (Example: Cortisol) | Weak correlation with tissue exposure | Strong for free serum fraction | Strongest correlation with tissue-free fraction & clinical status |
Supporting Experimental Protocol: Validation of Salivary Free Cortisol Correlation
Title: Protocol for Establishing Correlation between Salivary LC-MS/MS Cortisol and Serum Free Cortisol.
Objective: To validate salivary cortisol measured by LC-MS/MS as a surrogate for serum free cortisol using equilibrium dialysis as reference.
Materials:
- Paired serum and saliva samples from participants across a physiological range (e.g., circadian cycle, dexamethasone suppression).
- LC-MS/MS system with electrospray ionization (ESI).
- C18 reversed-phase chromatography column.
- Stable-isotope labeled internal standards (e.g., Cortisol-d4).
- Equilibrium dialysis device.
Method:
- Sample Collection: Collect unstimulated passive drool saliva and simultaneous serum via venipuncture. Centrifuge saliva (10,000 x g, 10 min, 4°C) to remove mucins.
- Serum Free Cortisol Isolation: Subject serum aliquot to equilibrium dialysis (37°C, 16-18 hrs) to isolate the ultrafiltrate containing free cortisol.
- Sample Preparation (Saliva & Serum Ultrafiltrate): a. Add internal standard (Cortisol-d4) to 200 µL of sample. b. Perform liquid-liquid extraction with methyl tert-butyl ether (MTBE). c. Evaporate organic layer to dryness under nitrogen stream. d. Reconstitute in mobile phase (e.g., water/methanol).
- LC-MS/MS Analysis: a. Chromatography: Gradient elution (water/methanol with 0.1% formic acid). Flow: 0.4 mL/min. Run time: ~5 min. b. MS Detection: Negative ESI mode. MRM transitions: Cortisol (407.2→331.2), Cortisol-d4 (411.2→335.2).
- Data Analysis: Construct calibration curves (1-50 nmol/L). Calculate concentrations. Perform Pearson correlation and Passing-Bablok regression analysis between salivary cortisol and serum free cortisol concentrations.
Core Advantage 2: Precision in Circadian Rhythm Studies
Circadian rhythms in hormone secretion are fundamental to physiology, metabolism, and behavior. Salivary LC-MS/MS is uniquely suited for high-density, temporal mapping of these rhythms.
Scientific Rationale: The non-invasive nature of saliva collection allows for frequent sampling (e.g., every 30-60 minutes over 24 hours) in ambulatory, ecological settings without disrupting sleep or inducing stress—a critical confounder for hormones like cortisol. LC-MS/MS provides the precision, low limit of quantification (LLOQ ~0.1 nmol/L for cortisol), and multiplexing capability needed to profile multiple hormones (cortisol, DHEA, testosterone, melatonin metabolites) simultaneously from a single sample.
Quantitative Data Summary:
Table 2: Key Circadian Rhythm Parameters Quantifiable via Salivary LC-MS/MS
| Parameter | Description | Typical Salivary Cortisol Value (LC-MS/MS) | Research Implication |
|---|---|---|---|
| CAR (Cortisol Awakening Response) | Increase in cortisol peaking 30-45 min post-awakening. | Rise: 8-16 nmol/L from waking peak | Index of HPA axis preparedness; blunted in burnout, flattened in PTSD. |
| Diurnal Slope | Rate of decline from peak to nadir. | -0.3 to -0.5 nmol/L per hour | Indicator of HPA axis resilience; flatter slope linked to chronic stress, depression. |
| AUC (Area Under the Curve) | Total hormone exposure over time. | AUCG (Ground): ~300 nmol/L*hr | Integrative measure of physiological load. |
| Acrophase | Time of peak concentration. | ~30 min post-awakening | Marker of circadian phase alignment; shifted in shift work, circadian disorders. |
| Nadir | Lowest concentration point. | ~2-4 nmol/L (late evening) | Critical for evaluating system shutdown; elevated in insomnia, Cushing's syndrome. |
Supporting Experimental Protocol: High-Density Salivary Circadian Profiling
Title: Protocol for 24-Hour Salivary Hormone Circadian Profiling using LC-MS/MS.
Objective: To obtain a precise circadian profile of free cortisol and DHEA in an ambulatory setting.
Materials:
- Salivettes or passive drool kits.
- Portable cooler for participants.
- Electronic diary/timed alerts.
- LC-MS/MS system with multiplexed MRM panel.
Method:
- Study Design: Participants collect saliva at home/work on a typical day. Sampling schedule: Immediately upon waking (S1), +30 min (S2), +45 min (S3), then every 2 hours until bedtime, and once at night if awake. Exact clock times are recorded.
- Sample Handling: Participants store samples immediately in their personal freezer (-20°C) before batch transfer to -80°C.
- Multiplexed LC-MS/MS Analysis: a. Extraction: As per Protocol in Section 2.0, but optimized for simultaneous recovery of cortisol and DHEA. b. Chromatography: Gradient separation to resolve isomers (e.g., cortisol vs. cortisone). c. MS Detection: MRM transitions for cortisol, DHEA, and their respective internal standards.
- Circadian Analysis: Use cosinor analysis or similar non-linear mixed-effects modeling to determine acrophase, mesor, amplitude, and diurnal slope for each hormone. Calculate AUC and CAR.
The Scientist's Toolkit: Research Reagent Solutions
Table 3: Essential Materials for Salivary LC-MS/MS Hormone Analysis
| Item / Reagent Solution | Function & Importance |
|---|---|
| Stable Isotope-Labeled Internal Standards (e.g., Cortisol-¹³C₃, DHEA-d6) | Corrects for matrix effects and variability in extraction efficiency; essential for quantitative accuracy in LC-MS/MS. |
| Mass Spectrometry Grade Solvents (MeOH, ACN, MTBE, Water) | Minimizes background ions and signal suppression, ensuring optimal instrument sensitivity and reproducible chromatography. |
| Solid Phase Extraction (SPE) or Liquid-Liquid Extraction (LLE) Kits | Purifies and concentrates analytes from complex saliva matrix, removing interfering proteins, mucins, and salts. |
| Certified Reference Material (CRM) for Steroid Hormones | Provides traceable calibrators to establish method accuracy and meet standards for laboratory accreditation (ISO 15189). |
| Multiplexed MRM Assay Kits (Pre-optimized transitions & columns) | Accelerates method development for panels (e.g., glucocorticoids, androgens, estrogens) ensuring optimal sensitivity for each analyte. |
| Passive Drool Collection Aids (Polypropylene Tubes, Straws) | Inert materials that prevent analyte adsorption and are compatible with downstream LC-MS/MS analysis. |
| Enzymatic Deconjugation Reagents (β-Glucuronidase/Sulfatase) | For measuring total (free + conjugated) hormone content in saliva, relevant for certain metabolites and hormone precursors. |
Visualizations
Title: Free Hormone Diffusion from Blood to Saliva for LC-MS/MS
Title: Salivary LC-MS/MS Workflow for Circadian Rhythm Analysis
Liquid Chromatography-Tandem Mass Spectrometry (LC-MS/MS) has revolutionized the quantitative analysis of steroid and peptide hormones in saliva. This non-invasive matrix provides a reliable measure of the biologically active, free hormone fraction, circumventing the complexities of serum protein binding. This technical guide details the core applications, methodologies, and resources for employing LC-MS/MS-based salivary hormone analysis across four critical research domains, framed within the broader thesis that salivary hormone profiling is indispensable for dynamic, stress-free, and longitudinal physiological monitoring.
Core Application Areas & Quantitative Data
Table 1: Key Salivary Hormones Analyzed by LC-MS/MS Across Application Areas
| Hormone Class | Specific Analytes | Stress Research Role | Sports Science Role | Pediatric/Geriatric Role | Drug Development Role |
|---|---|---|---|---|---|
| Glucocorticoids | Cortisol, Cortisone | Primary stress biomarker; HPA axis activity. | Overtraining monitoring, recovery status. | Adrenal function, developmental studies, aging. | PK/PD of corticosteroid therapies, stress liability. |
| Androgens | Testosterone, DHEA, DHT, Androstenedione | Chronic stress impact, social stress. | Anabolic state, performance, training adaptation. | Pubertal development, adrenal maturation, age-related decline. | Efficacy of hormone replacement therapies (HRT), SARMs. |
| Estrogens/Progestagens | Estradiol, Estrone, Progesterone | Mood and cognitive correlates of stress. | Energy availability, menstrual cycle phase. | Puberty, menopausal transition, bone health. | PK/PD of hormone therapies, contraceptive development. |
| Melatonin | Melatonin | Circadian rhythm disruption. | Sleep quality & recovery. | Sleep pattern maturation, age-related circadian shifts. | Chronotherapy efficacy, sleep aid development. |
| Peptides | α-amylase (surrogate), IGF-1 | Sympathetic nervous system (SNS) activity. | Acute metabolic & neural stress. | Autonomic nervous system development/decline. | Limited due to protease activity; specialized kits required. |
Table 2: Representative Concentration Ranges in Saliva (LC-MS/MS Data)
| Hormone | Typical Adult Baseline Range (LC-MS/MS) | Key Physiological Note |
|---|---|---|
| Cortisol | 0.5 - 9.5 nmol/L (diurnal variation) | Peak ~30 min post-waking, nadir at night. |
| Cortisone | 5.0 - 45.0 nmol/L | Inactive metabolite; higher conc. than cortisol. |
| Testosterone (M) | 70 - 250 pmol/L | ~1-3% of serum free testosterone. |
| Testosterone (F) | 4 - 25 pmol/L | |
| DHEA | 50 - 450 pmol/L | Adrenal zona reticularis output; declines with age. |
| Progesterone (F, luteal) | 30 - 200 pmol/L | Correlates with serum free fraction. |
| Estradiol (F, follicular) | 2 - 8 pmol/L | Requires high-sensitivity assays. |
| Melatonin | 1 - 30 pg/mL (night peak) | Directly reflects plasma free fraction. |
Experimental Protocols
Standardized Protocol for Multi-Hormone LC-MS/MS Analysis from Saliva
A. Sample Collection & Pre-processing
- Collection: Use inert polymer salivettes (e.g., Sarstedt). Instruct participants to avoid food, drink (except water), and brushing teeth for 60 min pre-collection. Note exact time.
- Stabilization: Centrifuge tubes (1,000 x g, 2 min, 4°C) immediately upon receipt. Add protease inhibitor cocktail if analyzing peptide fragments.
- Storage: Aliquot supernatant into low-binding polypropylene tubes. Store at -80°C. Avoid freeze-thaw cycles (>2).
B. Solid-Phase Extraction (SPE)
- Conditioning: Condition Oasis HLB or similar mixed-mode SPE cartridges (60 mg) with 1 mL methanol, then 1 mL HPLC-grade water.
- Loading: Thaw samples on ice. Mix 500 µL saliva with internal standard mix (deuterated analogs for each target analyte). Adjust pH to ~5.0. Load onto cartridge.
- Washing: Wash with 1 mL 5% methanol in water.
- Elution: Elute analytes with 1 mL methanol. Dry eluents under gentle nitrogen stream at 40°C.
C. LC-MS/MS Analysis
- Reconstitution: Reconstitute dried extracts in 100 µL of 20% methanol in water. Vortex and centrifuge.
- Chromatography:
- Column: Kinetex C18 (2.6 µm, 100 x 3.0 mm) or equivalent.
- Mobile Phase A: 0.1% Formic acid in water.
- Mobile Phase B: 0.1% Formic acid in methanol.
- Gradient: 20% B to 95% B over 8 min, hold 2 min, re-equilibrate. Flow: 0.4 mL/min.
- Mass Spectrometry:
- Ion Source: Electrospray Ionization (ESI), positive/negative switching.
- MS: Triple quadrupole. Operate in Selected Reaction Monitoring (SRM) mode.
- Example Transitions: Cortisol: 363.2 > 121.1 (quantifier), 363.2 > 97.1. Testosterone: 289.2 > 97.1. Use deuterated ISTD transitions for ratio quantification.
- Quantification: Use a 7-point calibration curve (matrix-matched) with internal standardization. Apply linear regression with 1/x² weighting.
Diurnal Cortisol Curve Protocol (Stress/Pediatric Studies)
- Sampling Schedule: Collect samples at wake-up (T0), +30 min (T30), +60 min (T60), afternoon (4 PM), and bedtime (10 PM).
- Analysis: Calculate Cortisol Awakening Response (CAR) as area under the curve (AUC) from T0 to T30. Calculate Diurnal Slope from peak (T30) to bedtime.
- Key Metrics: Total daily output (AUC for the entire day), CAR magnitude.
Pharmacokinetic (PK) Sampling Protocol (Drug Development)
- Pre-dose Baseline: Collect saliva immediately before drug administration.
- Dense Post-dose Sampling: Collect at 15, 30, 60, 90 min, 2, 4, 6, 8, 12, 24 hours post-dose (schedule depends on drug half-life).
- Analysis: Plot salivary concentration-time profile. Calculate PK parameters: Cmax, Tmax, AUC0-t, and apparent half-life.
Visualizations
Title: HPA Axis & Salivary Cortisol Measurement Pathway
Title: End-to-End LC-MS/MS Salivary Hormone Analysis Workflow
Title: Interdisciplinary Applications of Salivary Hormone Analysis
The Scientist's Toolkit: Research Reagent Solutions
Table 3: Essential Materials for LC-MS/MS Salivary Hormone Research
| Item/Category | Specific Product Examples | Function & Rationale |
|---|---|---|
| Collection Device | Sarstedt Cortisol Salivette (cotton/polyester), Salimetrics Oral Swab (SR-10), Passive Drool Kit. | Standardized, inert material to avoid interference and ensure adequate volume. Cotton can affect certain analytes. |
| Internal Standards | Deuterated Hormones: d4-Cortisol, d3-Testosterone, d5-Estradiol, d7-Progesterone (Cambridge Isotopes, Cerilliant). | Critical for accurate quantification by LC-MS/MS. Corrects for variability in extraction efficiency and ion suppression. |
| SPE Cartridges | Waters Oasis HLB, Agilent Bond Elut PPL, Phenomenex Strata-X. | Mixed-mode reversed-phase polymer for efficient, clean extraction of diverse hormone classes from saliva. |
| LC Column | Phenomenex Kinetex C18 (2.6 µm), Waters Acquity UPLC BEH C18 (1.7 µm). | Provides high-resolution separation of isobaric steroids (e.g., cortisol vs. cortisone, testosterone vs. DHT). |
| Mass Spec Calibrants | Certified Reference Standards (Neat powders or solutions) from Cerilliant, NIST, or USP. | To prepare primary stock solutions and authenticate calibration curves. |
| Quality Controls | Pooled saliva, spiked with low/medium/high concentrations of analytes. Commercially available QC materials (Bio-Rad, UTAK). | Monitors inter-assay precision and accuracy across batches. |
| Matrix for Calibration | Artificial Saliva or Charcoal-Stripped Pooled Saliva. | Creates a matrix-matched calibration curve, compensating for ionization matrix effects. |
| Solvents & Additives | LC-MS Grade Methanol, Acetonitrile, Water. Optima Grade Formic Acid, Ammonium Acetate. | Minimizes background noise, prevents source contamination, and promotes consistent ionization. |
| Protease Inhibitors | Complete Mini Tablets (Roche). | Essential if analyzing unstable peptides (e.g., α-amylase activity is a SNS marker). |
From Sample to Data: A Step-by-Step LC-MS/MS Workflow for Salivary Hormones
1. Introduction Within the context of LC-MS/MS hormone analysis in saliva research, the pre-analytical phase is the single most critical determinant of data integrity and analytical validity. Unlike blood, saliva is a complex filtrate influenced by numerous physiological and collection variables. Inappropriate pre-analytical handling irreversibly degrades analyte stability, introduces contaminants, and biases results, thereby compromising the high sensitivity and specificity of LC-MS/MS. This guide details evidence-based protocols to standardize this phase.
2. Saliva Collection: Methods and Considerations The choice of collection method directly impacts sample composition, volume, and compatibility with downstream LC-MS/MS.
Table 1: Comparison of Saliva Collection Methods for Hormone Analysis
| Method | Description | Advantages for LC-MS/MS | Disadvantages & Considerations |
|---|---|---|---|
| Passive Drool | Direct expectoration into a polypropylene tube. | Pure, undiluted sample; high analyte concentration; no polymer interference. | Requires training; viscous; potential for mucin clots. |
| Salivette (Cotton Roll) | Cotton roll chewed, placed in a centrifuge tube. | Simple, standardized; good for field collection. | Cotton absorbs ~20% volume; potential for hormone (e.g., cortisol) retention on fibers; cellulose polymers may interfere with MS. |
| Salivette (Synthetic) | Uses a polyester (Salivette SARSTEDT) swab. | No hormone retention; cleaner polymer background. | Slight sample dilution; polymer leaching requires validation. |
| Absorbent Pad/Sponge | Polymer pad chewed to absorb saliva. | High volume from dry mouths. | Significant dilution (up to 50%); extensive polymer leaching risks MS ion suppression. |
Protocol 2.1: Standardized Passive Drool Collection
- Participant Preparation: Observe a 1-hour fasting period (water permitted). Avoid brushing teeth, eating, or drinking (except water) for 1h prior. Rinse mouth thoroughly with water 10 minutes before collection.
- Timing: For circadian studies (e.g., cortisol), collect at strict intervals (e.g., waking, +30min, bedtime).
- Procedure: Tilt head forward, allow saliva to pool in the mouth floor. Passively drool through a disposable plastic straw into a pre-chilled, DNA/RNA-free 50mL polypropylene conical tube. Continue for 2-5 minutes to obtain ≥2 mL.
- Immediate Handling: Cap tube, invert gently 3-5 times to mix with mucins. Place immediately on wet ice or at 4°C.
3. Sample Handling and Initial Processing Rapid processing is essential to halt enzymatic degradation.
Protocol 3.1: Initial Processing for Steroid Hormones (Cortisol, DHEA-S, Testosterone)
- Centrifugation: Process within 60 minutes of collection. Centrifuge raw saliva at 4°C, 2,500-3,000 x g for 15 minutes.
- Aliquoting: Using a positive displacement pipette, transfer the clear, viscous supernatant (avoiding the pellet of mucins and cells) into pre-labeled, low-binding polypropylene cryovials (e.g., 0.5-1.0 mL aliquots).
- Stabilization: For long-term storage or unstable analytes (e.g., peptides), add protease/phosphatase inhibitors validated for MS compatibility. Note: Acidification, common in immunoassays, can interfere with LC-MS/MS and is generally not recommended without validation.
4. Storage Protocols and Analyte Stability Stability is analyte-specific. Storage temperature and duration must be validated for each target hormone.
Table 2: Recommended Storage Conditions for Key Hormones in Processed Saliva
| Analyte Class | Short-Term (≤1 Month) | Long-Term (>1 Month) | Maximum Freeze-Thaw Cycles (Tested) | Key Degradation Risk |
|---|---|---|---|---|
| Cortisol, Corticosterone | -20°C | -80°C | 3-4 | Enzymatic conversion; minimal non-enzymatic degradation. |
| DHEA-S | 4°C or -20°C | -20°C to -80°C | 5 | Highly stable in saliva. |
| Testosterone, DHT | -20°C | -80°C | 2-3 | Adsorption to tube walls; use low-bind tubes. |
| Melatonin | -80°C (immediate) | -80°C | 1-2 | Highly sensitive to light and oxidative degradation. |
| Peptide Hormones (e.g., α-amylase) | -80°C (immediate) | -80°C | 1 | Proteolytic degradation; requires specific inhibitors. |
5. LC-MS/MS Sample Preparation Considerations Pre-analytical steps must align with MS detection.
Protocol 5.1: Solid-Phase Extraction (SPE) for Cortisol and Testosterone This protocol precedes LC-MS/MS injection.
- Thawing: Thaw sample aliquots slowly at 4°C overnight. Vortex mix thoroughly.
- Internal Standard Addition: Add stable isotope-labeled internal standards (e.g., cortisol-d4, testosterone-d3) to correct for ion suppression and recovery losses.
- Protein Precipitation: Mix 200 µL saliva with 400 µL ice-cold methanol or acetonitrile. Vortex for 60s, incubate at -20°C for 10 min, centrifuge at 15,000 x g, 4°C, for 10 min.
- SPE Clean-up: Load supernatant onto a pre-conditioned (methanol, water) C18 SPE column. Wash with 15% methanol in water. Elute hormones with 100% methanol.
- Reconstitution: Evaporate eluent under gentle nitrogen stream at 40°C. Reconstitute dried extract in 50-100 µL of LC-MS/MS starting mobile phase (e.g., 20% methanol/water).
The Scientist's Toolkit: Key Research Reagent Solutions
Table 3: Essential Materials for Saliva Hormone Analysis by LC-MS/MS
| Item | Function & Rationale |
|---|---|
| DNA/RNA-Free Polypropylene Tubes | Minimizes analyte adsorption and prevents PCR contamination if used for multi-omics. |
| Stable Isotope-Labeled Internal Standards (SIL-IS) | Critical for LC-MS/MS quantification; corrects for matrix effects and variable extraction recovery. |
| Low-Binding Polypropylene Cryovials | Reduces loss of lipophilic hormones (e.g., androgens) via surface adsorption. |
| LC-MS/MS Compatible Protease Inhibitors | Stabilizes peptide/protein hormones without causing ion suppression or background noise. |
| Certified Hormone-Free Saliva Matrix | Used for preparing calibration standards and quality controls, ensuring matrix-matched quantification. |
| C18 or Mixed-Mode SPE Cartridges | Removes salts, phospholipids, and other matrix interferents that cause ion suppression in the MS source. |
| Positive Displacement Pipettes | Accurately transfers viscous, heterogeneous saliva samples and organic solvents. |
6. Signaling Pathways and Workflows
Diagram 1: HPA Axis to LC-MS/MS Saliva Analysis
Diagram 2: Saliva Pre-Analytical Workflow
In LC-MS/MS analysis of hormones in saliva, sample preparation is a critical step to isolate analytes from a complex matrix, remove interfering substances, and concentrate the target compounds to achieve the necessary sensitivity and specificity. This whitepaper provides an in-depth technical guide to three core techniques—Protein Precipitation (PPT), Liquid-Liquid Extraction (LLE), and Solid-Phase Extraction (SPE)—framed within the context of salivary hormone bioanalysis for clinical and pharmacological research.
Saliva is an attractive, non-invasive matrix for monitoring steroid hormones (e.g., cortisol, testosterone, DHEA), peptides, and other biomarkers. However, its protein content, viscosity, and potential for contamination necessitate robust cleanup. The choice of technique balances recovery, reproducibility, matrix effect, and throughput.
Table 1: Comparative Summary of Sample Preparation Techniques for Salivary Hormone LC-MS/MS
| Parameter | Protein Precipitation (PPT) | Liquid-Liquid Extraction (LLE) | Solid-Phase Extraction (SPE) |
|---|---|---|---|
| Principle | Denaturation & removal of proteins via organic solvent or acid. | Partitioning of analytes between two immiscible liquids based on polarity. | Selective adsorption and elution from a solid sorbent. |
| Typical Recovery for Steroids | 60-80% (can be lower for hydrophobic analytes) | 70-95% (highly optimized) | 85-100% (with selective sorbents) |
| Matrix Effect (Ion Suppression) | High (co-precipitation of interfering compounds) | Moderate to Low (good cleanup) | Low (excellent cleanup with selective washing) |
| Concentration Factor | Low (often dilution) | High (organic phase evaporation & reconstitution) | High (elution in small solvent volume) |
| Throughput | Very High (amenable to 96-well plates) | Low to Moderate (manual phase separation) | High (96-well automation) |
| Cost per Sample | Very Low | Low | Moderate to High |
| Best Suited For | High-throughput, initial cleanup, removing proteins. | Targeted extraction of non-polar to moderately polar hormones. | Complex matrices, demanding sensitivity, selective class-specific extraction (e.g., corticosteroids). |
Detailed Methodologies and Protocols
Protein Precipitation (PPT) for Saliva
Protocol for Cortisol Analysis (Adapted from current methodologies)
- Sample Volume: 200 µL of centrifuged (10,000 x g, 5 min) saliva.
- Precipitation: Add 600 µL of ice-cold acetonitrile (containing internal standard, e.g., cortisol-d4) to the sample in a microcentrifuge tube. Vortex vigorously for 60 seconds.
- Incubation: Let stand at -20°C for 10 minutes to enhance protein aggregation.
- Centrifugation: Centrifuge at 14,000 x g for 15 minutes at 4°C.
- Collection: Transfer 600 µL of the clear supernatant to a new tube.
- Evaporation & Reconstitution: Evaporate to dryness under a gentle stream of nitrogen at 40°C. Reconstitute the dry residue in 100 µL of LC-MS/MS mobile phase (e.g., 20% methanol, 80% water with 0.1% formic acid). Vortex and centrifuge before injection.
Liquid-Liquid Extraction (LLE) for Steroid Hormones
Protocol for Testosterone and DHEA (Adapted from current methodologies)
- Sample & Buffer: Pipette 500 µL of saliva into a glass tube. Add 1 mL of 0.1 M phosphate buffer (pH 7.0) to adjust ionic strength.
- Internal Standard: Add deuterated internal standards (e.g., testosterone-d3, DHEA-d6).
- Extraction Solvent: Add 5 mL of tert-butyl methyl ether (MTBE). Cap tightly.
- Mixing: Shake mechanically or vortex for 20 minutes to ensure complete partitioning.
- Phase Separation: Centrifuge at 3,000 x g for 5 minutes for clear phase separation.
- Collection: Transfer the upper organic layer (MTBE) to a clean conical tube.
- Evaporation & Reconstitution: Evaporate the organic layer to complete dryness under nitrogen at 40°C. Reconstitute in 100 µL of reconstitution solvent (e.g., 50:50 methanol:water). Vortex thoroughly prior to LC-MS/MS analysis.
Solid-Phase Extraction (SPE) for Corticosteroid Profiling
Protocol Using Mixed-Mode Cation Exchange (MCX) or Hydrophilic-Lipophilic Balanced (HLB) Sorbents
- Conditioning: Activate an HLB or MCX cartridge (30 mg/1 mL) with 1 mL of methanol, followed by 1 mL of water. Do not let the sorbent dry.
- Sample Loading: Acidify 1 mL of saliva with 50 µL of 1% formic acid. Load the sample onto the cartridge at a flow rate of ~1 mL/min.
- Washing: Wash sequentially with 1 mL of 5% methanol in water (for HLB) or 1 mL of 2% formic acid in water followed by methanol (for MCX) to remove impurities.
- Drying: Apply full vacuum for 5 minutes to dry the sorbent bed.
- Elution: Elute analytes with 1 mL of methanol (for HLB) or 5% ammonium hydroxide in methanol (for MCX) into a collection tube.
- Evaporation & Reconstitution: Evaporate the eluate to dryness under nitrogen. Reconstitute in 50 µL of mobile phase for LC-MS/MS analysis.
Workflow and Logical Pathways
Diagram 1: Decision Workflow for Sample Prep in Salivary Hormone Analysis
Diagram 2: Protein Precipitation (PPT) Step-by-Step Protocol
The Scientist's Toolkit: Research Reagent Solutions
Table 2: Essential Materials for Salivary Hormone Sample Preparation
| Item | Function in Sample Prep | Typical Example/Note |
|---|---|---|
| Deuterated Internal Standards | Correct for analyte loss during prep & ionization variance in MS. | Cortisol-d4, Testosterone-d3, DHEA-d6. Crucial for quantitative accuracy. |
| Organic Solvents (HPLC/MS Grade) | PPT: Protein denaturant. LLE: Extraction medium. SPE: Conditioning/elution. | Acetonitrile, Methanol, MTBE. Low UV absorbance & minimal contaminants. |
| SPE Cartridges/Plates | Selective retention of analytes based on chemical properties. | Oasis HLB (hydrophilic-lipophilic balance), Mixed-Mode (MCX, MAX). 96-well format for throughput. |
| Buffering Agents | Adjust sample pH to optimize extraction efficiency (LLE, SPE). | Phosphate buffer, Formic Acid, Ammonium Hydroxide. |
| Evaporation System | Concentrate eluates/extracts for lower detection limits. | Nitrogen Evaporator (TurboVap) or Centrifugal Vacuum Concentrator. |
| Laboratory Automation | Improves reproducibility & throughput for PPT & SPE. | Liquid Handling Robots, Positive Pressure SPE Manifolds. |
This guide details the critical chromatographic front-end for a thesis focused on quantifying steroid and peptide hormones in human saliva via Liquid Chromatography-Tandem Mass Spectrometry (LC-MS/MS). Saliva presents a unique matrix with low hormone concentrations, high protein binding, and potential interferents, making optimal column selection and mobile phase design paramount for achieving the requisite sensitivity, specificity, and reproducibility for clinical research and drug development.
Column Selection for Hormone Separations
The choice of stationary phase is dictated by hormone polarity, functional groups, and the need for robust separation from isobaric interferences in saliva.
2.1 Core Column Chemistry Types
- Reversed-Phase (C18, C8, Phenyl): The workhorse for most steroid hormones (cortisol, testosterone, progesterone). Provides separation based on hydrophobicity.
- Polar-Embedded / Aqueous Stable (e.g., C18 with amide embedding): Enhances retention of polar hormones (e.g., cortisone) under high aqueous conditions, improving compatibility with ESI-MS.
- HILIC (Hydrophilic Interaction Liquid Chromatography): Used for highly polar, often conjugated hormones or small peptides (e.g., DHEA-S). Retains analytes with a hydrophilic layer.
- Core-Shell (Fused-Core) Particles: Offer high efficiency and lower backpressure than fully porous sub-2µm particles, ideal for fast analyses on conventional HPLC systems.
2.2 Column Selection Quantitative Data
Table 1: Common HPLC/UHPLC Columns for Hormone Analysis in Saliva
| Hormone Class | Example Analytes | Recommended Column Chemistry | Particle Size | Dimensions (mm) | Typical Efficiency (N/m) |
|---|---|---|---|---|---|
| Glucocorticoids | Cortisol, Cortisone | Polar-embedded C18 (e.g., Acquity UPLC HSS T3) | 1.8 µm | 2.1 x 50-100 | >150,000 |
| Androgens | Testosterone, DHT, Androstenedione | Traditional C18 or C8 | 2.7µm (Fused-core) | 2.1 x 50 | ~120,000 |
| Progestogens | Progesterone, 17-OH-Progesterone | Phenyl-Hexyl or traditional C18 | 1.8 µm | 2.1 x 100 | >140,000 |
| Sulfated Steroids | DHEA-S, Estrone-S | HILIC (e.g., BEH Amide) or Reversed-Phase | 1.7-3.5 µm | 2.1 x 50-150 | Varies |
| Peptide Hormones | Insulin, Ghrelin (digested) | C18, 300Å pore size | 1.8-3.5 µm | 2.1 x 150 | >100,000 |
Mobile Phase Optimization
Optimization focuses on enhancing ionization efficiency, peak shape, and resolving power.
3.1 Components & Optimization Goals
- Aqueous Phase (A): Water with volatile additives. 0.1% Formic acid is standard for positive mode; 1-10mM Ammonium acetate/bicarbonate for negative mode or neutral steroids.
- Organic Phase (B): Acetonitrile (ACN) or Methanol (MeOH). ACN generally provides sharper peaks and lower backpressure; MeOH can alter selectivity and is stronger for some steroids.
- pH and Additive Concentration: Critically impacts ionization and retention. A pH below analyte pKa promotes [M+H]+ for basic groups; a pH above pKa promotes [M-H]- for acids.
- Gradient Elution: A shallow gradient is often required to resolve isobaric steroids (e.g., cortisol vs. cortisone, testosterone vs. DHEA).
3.2 Detailed Protocol: Mobile Phase Scouting for Steroid Panels
Objective: Identify optimal pH and organic modifier for a 10-plex salivary steroid panel. Materials: HPLC-grade water, ACN, MeOH, Formic Acid, Ammonium Hydroxide, Ammonium Acetate. Test columns: C18 and Polar-embedded C18 (50 x 2.1 mm, 1.8µm). Method:
- Prepare five aqueous phases: (i) 0.1% FA, (ii) 10mM NH4Ac (pH ~6.8), (iii) 0.1% NH4OH (pH ~10), (iv) 5mM NH4Ac + 0.01% FA (pH ~4.5), (v) 5mM NH4Ac + 0.01% NH4OH (pH ~9.5).
- For each aqueous phase, create two mobile phase systems: A/ACN and A/MeOH.
- Inject a standard mix of all 10 steroids (in stripped saliva) using a generic 5-95% B gradient over 10 min.
- Evaluate based on (a) peak symmetry (Asymmetry Factor 0.8-1.2 ideal), (b) MS response (S/N ratio), (c) retention factor (k between 2-10), and (d) critical pair resolution (Rs > 1.5).
- Select the system yielding the best composite score. Fine-tune gradient slope (e.g., 20-60% B over 7 min) for runtime/efficiency balance.
3.3 Mobile Phase Optimization Data
Table 2: Effect of Mobile Phase on Key Hormone LC-MS/MS Performance
| Analyte | Ionization Mode | Optimal Additive | Optimal Organic | Approx. Retention Time Shift (ACN vs MeOH) | Signal-to-Noise Ratio Improvement vs. Standard (0.1% FA/ACN) |
|---|---|---|---|---|---|
| Cortisol | ESI+ | 0.1% FA / 5mM NH4Ac | ACN | -15% with MeOH | +220% with NH4Ac additive |
| Testosterone | ESI+ | 0.1% FA | ACN | Minimal | Baseline |
| Progesterone | APCI+ | 0.1% FA | MeOH | +20% with MeOH | +80% with MeOH |
| DHEA-S | ESI- | 10mM NH4Ac | ACN | -10% with MeOH | +300% in ESI- mode |
| Estrone | ESI- | 0.01% NH4OH | ACN | -5% with MeOH | +150% at high pH |
Integrated LC-MS/MS Workflow for Saliva
LC-MS/MS Hormone Analysis Workflow
Hormone Biosynthesis Pathway Context
Understanding pathways aids in predicting co-eluting interferences.
Steroid Hormone Biosynthesis Pathways
The Scientist's Toolkit: Research Reagent Solutions
Table 3: Essential Materials for Hormone LC-MS/MS Method Development
| Item Name / Category | Function / Purpose | Example Product / Specification |
|---|---|---|
| Stable Isotope-Labeled Internal Standards (IS) | Corrects for matrix effects & losses in sample prep; essential for accurate quantification. | d4-Cortisol, d3-Testosterone, 13C3-Progesterone (≥98% isotopic purity) |
| Matrix for Calibrators & QCs | Provides a commutable matrix for calibration, free of endogenous analytes. | Charcoal-Stripped Human Saliva (verified for analyte removal) |
| Mixed-Mode SPE Cartridges | Selective clean-up of saliva; removes salts, proteins, and phospholipids. | Oasis MCX (Cation Exchange) or MAX (Anion Exchange) in 30mg/1mL format |
| LC-MS Grade Solvents & Additives | Minimize background ions, maintain system cleanliness and signal stability. | Water, ACN, MeOH, Formic Acid, Ammonium Acetate (Optima LC-MS grade) |
| High-Purity Reference Standards | Defines identity, retention time, and creates calibration curves. | Certified Reference Materials (CRMs) for each target hormone (≥95% purity) |
| Dedicated UHPLC Column | Provides consistent, high-efficiency separation for complex panels. | e.g., Waters Acquity UPLC HSS T3 (1.8µm, 2.1x100mm), maintained for hormone use only |
The quantification of steroid and peptide hormones in saliva using Liquid Chromatography-Tandem Mass Spectrometry (LC-MS/MS) represents a cornerstone of non-invasive endocrine research. This technical guide details the development and optimization of Multiple Reaction Monitoring (MRM) methods, which are critical for achieving the sensitivity, specificity, and reproducibility required for accurate hormone profiling in complex salivary matrices. The content is framed within a doctoral thesis investigating diurnal cortisol patterns and their correlation with stress markers in a clinical cohort.
Principles of MRM for Targeted Quantification
MRM is a highly selective mass spectrometric mode used for the precise quantification of target analytes. It involves two stages of mass filtering: first, the precursor ion (Q1) is selected, and second, a characteristic product ion (Q3) formed from the fragmentation of the precursor is monitored. The specific pair of m/z values is termed a "transition."
Key Parameters for MRM Optimization:
- Precursor Ion Selection: Typically the protonated [M+H]⁺ or deprotonated [M-H]⁻ molecule.
- Product Ion Selection: The most abundant and specific fragment ion.
- Collision Energy (CE): The voltage applied in the collision cell (Q2) to induce fragmentation.
- Declustering Potential (DP): The voltage applied to remove solvent adducts and efficiently guide ions into Q1.
Systematic Method Development Workflow
The following diagram illustrates the logical sequence for developing a robust MRM method.
Diagram Title: MRM Method Development and Optimization Workflow
Experimental Protocols for Key Steps
Protocol 3.1: MRM Transition Optimization via Direct Infusion
Objective: To determine the optimal precursor/product ion pairs and their corresponding collision energies (CE).
- Prepare a 1 µg/mL solution of the target hormone standard in 50:50 methanol/water with 0.1% formic acid.
- Infuse directly into the ESI source of the triple quadrupole MS at 5-10 µL/min using a syringe pump.
- Perform a precursor ion scan (Q3 in RF-only mode) to confirm the dominant adduct (e.g., [M+H]⁺).
- Using the identified precursor m/z, execute a product ion scan (Q1 fixed on precursor, scan Q3) across a wide CE range (e.g., 10-50 eV).
- Select the 2-3 most intense and unique product ions.
- For each selected transition, perform a CE ramp experiment to find the voltage yielding maximum product ion intensity. Use a Declustering Potential (DP) ramp to optimize ion transmission from the interface.
Protocol 3.2: Assessment of Matrix Effects in Saliva
Objective: To quantify ion suppression/enhancement caused by co-eluting salivary matrix components.
- Prepare three sets of samples in triplicate:
- Set A (Neat): Analytic in pure mobile phase.
- Set B (Post-Extraction Spike): Blank saliva extracted, then analyte spiked into the final extract.
- Set C (Pre-Extraction Spike): Analyte spiked into blank saliva before extraction.
- Process all samples through the developed LC-MRM method.
- Calculate the Matrix Effect (ME) for each transition:
- ME (%) = (Peak Area of Set B / Peak Area of Set A) × 100.
- An ME of 100% indicates no effect; <100% indicates suppression; >100% indicates enhancement.
- Calculate the Process Efficiency (PE) and Extraction Recovery (RE):
- PE (%) = (Peak Area of Set C / Peak Area of Set A) × 100.
- RE (%) = (Peak Area of Set C / Peak Area of Set B) × 100.
Quantitative Data from Method Validation
Table 1: Optimized MRM Parameters for a Panel of Steroid Hormones
| Hormone | Precursor Ion (m/z) | Product Ion 1 (m/z) | CE 1 (V) | Product Ion 2 (m/z) | CE 2 (V) | DP (V) |
|---|---|---|---|---|---|---|
| Cortisol | 363.2 | 121.0 (Quantifier) | 22 | 327.2 (Qualifier) | 16 | 80 |
| Testosterone | 289.2 | 109.1 (Quantifier) | 28 | 97.1 (Qualifier) | 38 | 90 |
| DHEA-S | 367.2 | 96.9 (Quantifier) | 34 | 78.9 (Qualifier) | 58 | 100 |
| Progesterone | 315.2 | 109.1 (Quantifier) | 24 | 97.1 (Qualifier) | 30 | 85 |
Table 2: Validation Metrics for Salivary Cortisol Assay
| Parameter | Value | Acceptance Criterion |
|---|---|---|
| Linear Range | 0.1 - 50 ng/mL | R² > 0.995 |
| Limit of Detection (LOD) | 0.03 ng/mL | S/N ≥ 3 |
| Limit of Quantification (LOQ) | 0.1 ng/mL | S/N ≥ 10, Accuracy 80-120%, CV <20% |
| Intra-day Precision (CV%) at LOQ | 8.5% | ≤ 20% |
| Inter-day Precision (CV%) at LOQ | 12.1% | ≤ 20% |
| Matrix Effect (ME) | 87% (12% Suppression) | Consistent (CV of ME < 15%) |
| Extraction Recovery (RE) | 92% | Consistent across levels |
The Scientist's Toolkit: Essential Research Reagent Solutions
Table 3: Key Reagents and Materials for LC-MS/MS Hormone Analysis in Saliva
| Item | Function & Brief Explanation |
|---|---|
| Stable Isotope-Labeled Internal Standards (e.g., Cortisol-d4) | Corrects for variability in sample preparation, ionization efficiency, and matrix effects. Essential for accurate quantification. |
| Solid Phase Extraction (SPE) Cartridges (C18 or Mixed-Mode) | Purifies and concentrates target hormones from saliva, removing salts, proteins, and phospholipids that cause matrix effects. |
| LC Column: C18, 2.1 x 50 mm, 1.7-1.8 µm | Provides high-efficiency chromatographic separation of isobaric hormones (e.g., cortisol vs. cortisone) before MS detection. |
| Ammonium Fluoride / Formic Acid Mobile Phase Additives | Enhance electrospray ionization efficiency for steroids. Fluoride can improve [M+H]⁺ signal for certain hormones. |
| Artificial Saliva Matrix | Used for preparing calibration standards and quality controls to match the composition of real samples and ensure accurate calibration. |
| Phospholipid Removal Plates (e.g., HybridSPE-PPT) | Specifically removes phospholipids, a major source of ion suppression in ESI, from protein-precipitated saliva samples. |
Integrated LC-MRM Analysis Pathway
The final operational pathway, from sample to result, is depicted below.
Diagram Title: Integrated LC-MRM Analysis Pathway for Saliva
Liquid chromatography-tandem mass spectrometry (LC-MS/MS) has become the gold standard for the multiplexed, sensitive, and specific quantification of steroid hormones (e.g., cortisol, DHEA, testosterone, progesterone, estradiol) in saliva. This whitepaper details the core data analysis principles—quantification, calibration curves, and internal standardization—essential for producing reliable, reproducible data in this complex biological matrix. Accurate analysis is critical for research in stress physiology, endocrinology, and drug development, where salivary biomarkers offer non-invasive sampling advantages.
Core Quantitative Principles
Quantification Strategy
In LC-MS/MS, quantification is predominantly performed using external calibration with internal standardization. The measured signal (peak area or height) of the analyte is compared to that of its corresponding stable isotope-labeled internal standard (SIL-IS) to correct for variability in sample preparation and instrument response.
Key Equation:
Analyte Concentration = (Analyte Area / IS Area) * Slope⁻¹ from Calibration Curve
The Calibration Curve
A calibration curve establishes the mathematical relationship between the instrument response (analyte/IS area ratio) and the known concentration of the analyte. For hormone analysis, a linear fit with 1/x or 1/x² weighting is typically used to account for heteroscedasticity (non-constant variance across the concentration range).
Table 1: Representative Calibration Curve Data for Salivary Cortisol by LC-MS/MS
| Standard Concentration (pg/mL) | Mean Cortisol Area | Mean d4-Cortisol IS Area | Mean Area Ratio (Analyte/IS) |
|---|---|---|---|
| 10 | 1250 | 50500 | 0.0248 |
| 50 | 9800 | 52000 | 0.1885 |
| 200 | 41500 | 49800 | 0.8333 |
| 1000 | 225000 | 51200 | 4.3945 |
| 5000 | 1,125,000 | 49000 | 22.9592 |
Expected Curve Parameters: Slope: ~0.0046, Intercept: ~0.002, Correlation Coefficient (R²): >0.99.
Internal Standardization
Stable isotope-labeled internal standards (e.g., cortisol-d4, testosterone-d3) are added to every sample, calibration standard, and quality control (QC) at the beginning of sample preparation. They correct for:
- Matrix effects (ion suppression/enhancement).
- Efficiency losses during extraction (e.g., solid-phase extraction, liquid-liquid extraction).
- Instrumental variability (injection volume, source contamination).
Detailed Experimental Protocols
Protocol: Preparation of Calibrators and QCs in Artificial Saliva
Purpose: To create a calibration series and quality control samples matching the chemical matrix. Materials: Artificial saliva (pH ~6.8), primary hormone stock solutions (in methanol), SIL-IS working solution, charcoal-stripped artificial saliva for blank matrix. Procedure:
- Serially dilute primary stock solutions to create intermediate working solutions.
- Spike working solutions into charcoal-stripped artificial saliva to create calibration standards (e.g., 10, 50, 200, 1000, 5000 pg/mL).
- Similarly, prepare independent QC samples at Low, Medium, and High concentrations (e.g., 30, 800, 3000 pg/mL).
- Add a fixed volume of SIL-IS working solution to all calibrators, QCs, and unknown samples.
- Process all samples identically through the extraction protocol.
Protocol: Saliva Sample Preparation for LC-MS/MS
Purpose: To clean up and concentrate analytes from the saliva matrix. Method: Supported Liquid Extraction (SLE) or Solid-Phase Extraction (SPE). Detailed SLE Protocol:
- Pre-treatment: Centrifuge 500 µL of saliva at 10,000 x g for 10 min to remove mucins. Transfer 200 µL supernatant to a new tube.
- Internal Standard Addition: Add 20 µL of a SIL-IS mixture in methanol to all samples.
- Loading: Condition SLE plate with 1 mL methyl tert-butyl ether (MTBE). Load pre-treated saliva onto the SLE plate and let it absorb for 5-10 min.
- Elution: Elute analytes with 2 x 1 mL of MTBE:ethyl acetate (1:1, v/v) into a collection plate.
- Evaporation & Reconstitution: Evaporate eluent to dryness under a gentle nitrogen stream at 40°C. Reconstitute dried extract in 100 µL of initial LC mobile phase (e.g., 30:70 methanol:water with 0.1% formic acid).
- Analysis: Inject 5-10 µL into the LC-MS/MS system.
Data Analysis Workflow & Validation
Table 2: Key Method Validation Parameters for Salivary Hormone Assays
| Parameter | Target Criteria | Typical Value for LC-MS/MS |
|---|---|---|
| Accuracy | Mean bias within ±15% of nominal value (±20% at LLOQ) | 85-115% recovery |
| Precision | Intra- and inter-day CV <15% (<20% at LLOQ) | CV <10% |
| Lower Limit of Quantification (LLOQ) | Signal-to-noise ratio ≥10, accuracy & precision within ±20% | 1-10 pg/mL for steroids |
| Linearity | Correlation coefficient (R²) > 0.99 | R² > 0.995 |
| Matrix Effect | IS-normalized matrix factor close to 1.0; CV <15% | ~0.9-1.1 |
| Carryover | Response in blank after high-concentration sample <20% of LLOQ response | <5% LLOQ |
Visualization of Core Concepts
Diagram 1: LC-MS/MS Quantification Workflow for Salivary Hormones
Diagram 2: Internal Standard Correction for Matrix Effects
The Scientist's Toolkit: Key Research Reagent Solutions
Table 3: Essential Materials for Salivary Hormone LC-MS/MS Analysis
| Item | Function & Rationale |
|---|---|
| Stable Isotope-Labeled Internal Standards (SIL-IS) | (e.g., Cortisol-d4, Testosterone-d3). Compensates for analyte loss and matrix effects; critical for accuracy. |
| Charcoal-Stripped Artificial Saliva | Provides a consistent, analyte-free matrix for preparing calibration standards, ensuring matrix-matching. |
| Certified Reference Material (CRM) for Steroids | Used to prepare primary stock solutions, establishing traceability and accuracy of the entire method. |
| Supported Liquid Extraction (SLE) Plates | Provides high and reproducible recovery of steroids from saliva with minimal phospholipid carryover. |
| LC-MS/MS Grade Solvents (Methanol, Water, MTBE) | Minimizes background noise and ion suppression caused by solvent impurities. |
| High-Purity Formic Acid or Ammonium Acetate | Common mobile phase additives to control ionization efficiency in positive or negative ESI mode. |
| Mass Spectrometry Tuning & Calibration Solution | Ensures optimal instrument sensitivity, resolution, and mass accuracy for reliable MRM quantification. |
| Multi-Level Quality Control (QC) Pools | Independent samples at low, mid, high concentrations to monitor assay performance across each batch. |
Solving Analytical Challenges: Optimization and Troubleshooting in Saliva LC-MS/MS Assays
Addressing Matrix Effects and Ion Suppression in Saliva
Within the framework of LC-MS/MS hormone analysis in saliva, matrix effects (ME) and ion suppression (IS) represent the most significant technical hurdles to achieving robust, accurate, and sensitive quantification. This whitepaper provides an in-depth technical guide to the sources, mechanisms, and mitigation strategies for these phenomena, equipping researchers with practical methodologies for method development and validation.
Saliva is a complex biological matrix containing electrolytes, mucus, enzymes, food residues, bacteria, and cellular debris. Unlike plasma, its composition is highly variable and subject to collection method, diet, and circadian rhythm. In electrospray ionization (ESI) LC-MS/MS, co-eluting matrix components can alter the ionization efficiency of target analytes, leading to signal suppression or enhancement. Ion suppression, a subset of matrix effects, typically results in reduced sensitivity and accuracy.
- Phospholipids: Major contributors to late-eluting ion suppression in reversed-phase chromatography.
- Mucins and High-Molecular-Weight Proteins: Can cause source fouling and non-specific binding.
- Inorganic Salts (Na⁺, K⁺, Cl⁻): Cause intense adduct formation ([M+Na]⁺, [M+K]⁺) and compete for charge in the ESI droplet.
- Food-derived Compounds: Polyphenols, caffeine, and lipids introduce highly variable, exogenous interferences.
- Oral Hygiene Products: Residues of surfactants (e.g., sodium lauryl sulfate) are potent ion suppressors.
- Bacterial Metabolites and Enzymes.
Mechanism of Ion Suppression
During ESI, non-volatile or less volatile matrix components compete for access to the droplet surface and for the available charge. This physical displacement or charge competition reduces the number of analyte ions reaching the gas phase.
Quantitative Assessment of Matrix Effects
The standard method for quantifying ME is the post-extraction spike method, calculating the Matrix Factor (MF).
Formula: MF = (Peak Area of analyte spiked post-extraction into matrix) / (Peak Area of analyte in neat solution)
- MF = 1: No matrix effect.
- MF < 1: Ion suppression.
- MF > 1: Ion enhancement.
The IS-normalized MF uses a stable isotope-labeled internal standard (SIL-IS) to correct for variability: IS-normalized MF = (MF of analyte) / (MF of SIL-IS)
Table 1: Typical Matrix Factor Ranges for Common Salivary Hormones (Reversed-Phase ESI+)
| Analytic Class | Example Hormone | Typical Uncorrected MF Range | Common Source of Interference |
|---|---|---|---|
| Steroids | Cortisol | 0.3 - 0.7 (Suppression) | Phospholipids, mucins |
| Steroids | Testosterone | 0.5 - 0.9 (Suppression) | Phospholipids |
| Peptides | DHEA-S | 0.6 - 1.2 | Salts, variable adducts |
| Catecholamines | Cortisone | 0.2 - 0.8 (Severe Suppression) | Catechol metabolites, salts |
Detailed Experimental Protocols for Mitigation
Protocol: Phospholipid Removal Efficiency Test
Objective: To evaluate solid-phase extraction (SPE) sorbents versus protein precipitation (PPT) for removing phospholipids.
- Saliva Pool Preparation: Pool samples from ≥10 donors. Centrifuge at 10,000 x g for 10 min to remove particulates.
- Sample Preparation:
- Arm A (PPT): Mix 200 µL saliva with 600 µL cold acetonitrile (ACN). Vortex, incubate (-20°C, 20 min), centrifuge (15,000 x g, 15 min). Transfer supernatant.
- Arm B (SPE - HybridSPE): Acidify 200 µL saliva with 20 µL 1% formic acid. Load onto preconditioned (MeOH, H₂O) HybridSPE cartridge. Apply vacuum. Elute with 500 µL ACN:MeOH (80:20).
- LC-MS/MS Analysis: Use a phospholipid-specific MRM scan in positive mode (Precursors m/z 184 → 184 for phosphocholines; m/z 104 → 104 for phosphoethanolamines). Integrate total ion chromatogram (TIC) area of phospholipid region (typically 1.5 – 4 min in reversed-phase).
- Calculation: % Phospholipid Removal = [1 - (TIC Area post-treatment / TIC Area in raw saliva)] x 100.
Protocol: Standard Addition for Absolute Quantification in High-Matrix Samples
Objective: To validate analyte recovery in the presence of severe, variable suppression where SIL-IS co-suppression is incomplete.
- Prepare Calibration in Matrix: Start with a pooled, charcoal-stripped saliva pool (baseline).
- Spike Analytes: Create 6 concentration levels across the expected range into separate aliquots of the sample of interest (not the stripped pool).
- Add Constant SIL-IS: Add the same amount of SIL-IS to all samples and standards.
- Process and Analyze: Perform full sample preparation and LC-MS/MS analysis.
- Data Analysis: Plot peak area ratio (Analyte / SIL-IS) against spiked analyte concentration. Perform linear regression. The absolute value of the x-intercept represents the endogenous concentration in the unspiked sample.
Protocol: Optimization of Chromatographic Separation to Minimize Co-elution
Objective: To temporally separate analytes from the bulk of matrix ion suppressors.
- Inject a "Blank" Saliva Extract: Analyze a processed saliva sample from a donor not containing the target analytes.
- Perform a MS "Flow Injection Analysis" in MRM Mode: Set up MRMs for known suppressor ions (e.g., m/z transitions for sodium formate clusters, characteristic phospholipid fragments). Use a shallow gradient (e.g., 5-95% B over 15 min).
- Map Suppression Zones: Identify regions of intense signal in the blank MRM channels – these are "dirty" zones.
- Modify Gradient: Adjust the initial %B, gradient slope, and use gradient delays or step holds to shift the retention times (RT) of your target analytes away from the identified suppression zones. Aim for analyte elution in "clean" regions of the chromatogram.
The Scientist's Toolkit: Research Reagent Solutions
Table 2: Essential Materials for Mitigating Salivary Matrix Effects
| Item | Function & Rationale |
|---|---|
| Stable Isotope-Labeled Internal Standards (SIL-IS) | Gold standard for correction. Ideally, ¹³C or ¹⁵N-labeled; co-elutes with analyte, correcting for suppression/recovery losses. |
| HybridSPE-Phospholipid or similar SLE Plates | Selective removal of phospholipids via zirconia-coated silica, significantly reducing a major source of late-eluting suppression. |
| Supported Liquid Extraction (SLE) Plates | Efficient cleanup with higher and more consistent recovery than traditional liquid-liquid extraction (LLE), removing salts and polar interferences. |
| Charcoal/Dextran-Stripped Saliva | Provides a consistent, analyte-free matrix for preparing calibration standards, though it may not remove all interfering compounds. |
| HILIC Chromatography Columns | Alternative to RP; retains and separates polar salts and metabolites that cause early-phase suppression in RP, changing the landscape of interference. |
| Mobile Phase Additives: Ammonium Fluoride | Promotes efficient ionization and reduces sodium/potassium adduction by forming volatile ammonium adducts instead. |
| Saliva Collection Aid (e.g., Salimetrics Oral Swab) | Standardized collection device that reduces mucin and food particle contamination vs. passive drool. |
Visualizing Workflows and Relationships
Title: Workflow for Managing Ion Suppression in Saliva LC-MS/MS
Title: Mechanism of Competitive Ion Suppression in ESI
Effectively addressing matrix effects is non-negotiable for valid salivary hormone LC-MS/MS assays. A systematic approach is required:
- Use a SIL-IS for every analyte.
- Employ rigorous sample cleanup (SPE/SLE over PPT) targeting phospholipids.
- Chromatographically separate analytes from suppression zones.
- Quantitatively assess MF during validation across multiple donor lots.
- Consider standard addition for critical assays with high, variable suppression. By integrating these protocols and tools, researchers can transform saliva into a reliable matrix for high-precision hormone analysis, unlocking its full potential in clinical and pharmacological research.
In the field of salivary hormone analysis using Liquid Chromatography-Tandem Mass Spectrometry (LC-MS/MS), overcoming low analyte concentrations is a paramount challenge. Saliva offers a non-invasive matrix for monitoring steroid hormones, peptides, and other biomarkers relevant to stress, endocrinology, and therapeutic drug monitoring. However, salivary hormone concentrations are often 10-1000 times lower than in serum, frequently residing in the low picogram per milliliter (pg/mL) to femtogram per milliliter (fg/mL) range. This whitepaper details advanced sensitivity enhancement strategies within the context of a broader thesis aiming to establish robust, high-throughput salivary LC-MS/MS assays for clinical and pharmacological research.
Core Sensitivity Enhancement Strategies
Pre-Analytical Sample Preparation
Effective sample preparation is critical for concentrating analytes and removing matrix interferents.
Protocol: Solid-Phase Extraction (SPE) for Salivary Steroids
- Conditioning: Condition a reversed-phase C18 SPE cartridge (e.g., 30 mg/1 mL) with 1 mL methanol followed by 1 mL HPLC-grade water.
- Loading: Acidify 500 µL of saliva sample with 20 µL of 10% formic acid. Load the sample onto the cartridge at a flow rate of ~1 mL/min.
- Washing: Wash the cartridge with 1 mL of 5% methanol in water to remove polar interferents.
- Elution: Elute the target steroids (e.g., cortisol, testosterone) with 500 µL of 90% methanol in water. The eluate is collected.
- Evaporation & Reconstitution: Evaporate the eluate to dryness under a gentle stream of nitrogen at 40°C. Reconstitute the dry residue in 50 µL of initial LC mobile phase (e.g., 20% methanol, 80% water with 0.1% formic acid), resulting in a 10-fold pre-concentration.
Protocol: Supported Liquid Extraction (SLE) SLE offers high recovery with minimal emulsification.
- Load 200 µL of saliva (diluted 1:1 with 4% phosphoric acid) onto an SLE plate.
- Allow 5 minutes for adsorption.
- Elute with 2 x 600 µL of methyl tert-butyl ether (MTBE).
- Evaporate the combined organic layers and reconstitute in a small volume (e.g., 40 µL) for a 5-fold pre-concentration.
Chemical Derivatization
Derivatization increases analyte molecular weight, improves ionization efficiency (especially for electrospray ionization, ESI+), and alters fragmentation for more sensitive and specific MRM transitions.
Protocol: Girard's Reagent T Derivatization for Ketosteroids
- Dry down extracted salivary steroids.
- Reconstitute in 50 µL of methanol containing 0.1% formic acid.
- Add 50 µL of Girard's Reagent T solution (10 mg/mL in methanol with 1% acetic acid).
- Incubate at 60°C for 1 hour.
- Cool, dilute with 100 µL of water, and analyze by LC-MS/MS. This can enhance signal intensity by 10- to 100-fold for steroids like androstenedione and DHEA.
Advanced Chromatographic Separations
Narrower peaks increase signal-to-noise ratio (S/N).
- Micro-LC and Nano-LC: Reducing column internal diameter (e.g., from 2.1 mm to 0.3 mm) increases analyte concentration at the detector. A shift from 2.1 mm to 0.3 mm ID theoretically yields a ~50-fold increase in concentration sensitivity.
- Using Sub-2µm Particles: Columns packed with particles <2 µm provide higher efficiency and sharper peaks.
- Scheduled/MRM: Optimizes dwell times for peak-specific detection, improving S/N across the chromatogram.
- Ion Funnels and High-Pressure RF Gratings: Increase ion transmission into the mass analyzer.
- Paper Spray Ionization and Micro-Sampling: Directly couple minimal sample cleanup with ionization, showing promise for ultra-low volume (<10 µL) saliva analysis.
Table 1: Impact of Sensitivity Strategies on Key Salivary Hormone LOQs
| Hormone (Matrix: Saliva) | Baseline LOQ (pg/mL) | With SPE (10x conc.) | With Derivatization (e.g., Girard's T) | Combined SPE + Derivatization | Primary LC-MS/MS System |
|---|---|---|---|---|---|
| Cortisol | 50-100 | 5-10 | 20-40* | 0.5-2 | Triple Quad 6500+ |
| Testosterone | 5-10 | 0.5-1 | 2-5* | 0.05-0.2 | Triple Quad 7500 |
| DHEA | 100-200 | 10-20 | 10-20 | 1-2 | QTRAP 7500 |
| Aldosterone | 10-20 | 1-2 | N/A | 1-2 | TSQ Altis |
| Progesterone | 50-100 | 5-10 | N/A | 5-10 | Xevo TQ-S micro |
*Derivatization may not be beneficial for all ionization modes of every hormone; cortisol often ionizes well natively in ESI-.
Table 2: Comparison of Pre-concentration Techniques
| Technique | Typical Sample Volume (µL) | Typical Elution/Reconstitution Volume (µL) | Concentration Factor | Average Recovery (%) | Key Benefit | Key Limitation |
|---|---|---|---|---|---|---|
| Solid-Phase Extraction (SPE) | 500 | 50 | 10x | 70-95 | Excellent cleanup, flexible chemistries | Time-consuming, potential for clogging |
| Supported Liquid Extraction (SLE) | 200 | 40 | 5x | 80-100 | High recovery, minimal emulsion | Less selective than SPE |
| Liquid-Liquid Extraction (LLE) | 500 | 100 | 5x | 60-90 | Simple, cost-effective | Emulsion risk, organic waste |
| On-Line SPE | 50-100 | N/A | ~5-10x* | 70-90 | Fully automated | Higher instrument complexity |
*Concentration effect is based on focusing at column head rather than volume reduction.
Integrated Experimental Workflow Protocol
Title: Comprehensive Protocol for Ultra-Sensitive Salivary Cortisol and Testosterone Analysis
Step 1: Collection & Stabilization. Collect saliva using SalivaBio collection aids. Immediately add antioxidant/stabilizer cocktail (e.g., 0.1% ascorbic acid, 0.01% Tween-20). Centrifuge at 10,000 x g for 10 min at 4°C. Aliquot and store at -80°C.
Step 2: Internal Standard Addition. Add stable isotope-labeled internal standards (e.g., Cortisol-d4, Testosterone-d3) to 500 µL of clarified saliva. Vortex.
Step 3: Supported Liquid Extraction (SLE).
- Dilute sample 1:1 with 4% H₃PO₄.
- Load onto a 96-well SLE plate.
- Allow 5 min for absorption.
- Elute with 2 x 600 µL MTBE.
- Evaporate eluate to dryness under N₂ at 40°C.
Step 4: Derivatization (for Testosterone).
- Reconstitute dry extract in 30 µL methanol.
- Add 30 µL of 0.5 mg/mL hydroxylamine hydrochloride in 50% methanol/water.
- Incubate at 60°C for 30 min to form oxime derivative.
- Cool and proceed to LC-MS/MS.
Step 5: LC-MS/MS Analysis.
- LC: Micro-LC system. Column: C18, 1.0 x 50 mm, 1.7 µm. Flow: 40 µL/min.
- Gradient: 20% B to 98% B over 8 min (A: Water/0.1% FA; B: Methanol/0.1% FA).
- MS: Triple quadrupole with heated electrospray ionization (HESI).
- MRM Transitions:
- Cortisol: 407.2 > 331.2 (Quantifier), 407.2 > 121.1 (Qualifier)
- Cortisol-d4: 411.2 > 335.2
- Testosterone-Oxime: 318.2 > 112.1 (Quantifier), 318.2 > 158.1 (Qualifier)
- Testosterone-d3-Oxime: 321.2 > 115.1
Visualizations
Integrated Salivary Hormone Analysis Workflow
HPA Axis to Salivary Cortisol Pathway
The Scientist's Toolkit: Research Reagent Solutions
| Item | Function/Description | Key Consideration for Saliva |
|---|---|---|
| Stable Isotope-Labeled Internal Standards (SIL-IS) (e.g., Cortisol-d4, Testosterone-d3) | Corrects for matrix effects and losses during sample prep; essential for accurate quantification. | Must be added at the very beginning of sample prep to track analyte recovery. |
| Supported Liquid Extraction (SLE) Plates (e.g., ISOLUTE SLE+) | Provides high-recovery, emulsion-free extraction of analytes from biological fluids. | Ideal for saliva's variable viscosity and protein content. Superior to traditional LLE for throughput. |
| Derivatization Reagents (e.g., Hydroxylamine, Girard's Reagent T, Dansyl chloride) | Enhances ionization efficiency and shifts MRM transitions to higher, less noisy m/z regions. | Choice depends on analyte functional group (ketone, hydroxyl, etc.). Optimize for speed and yield. |
| LC Columns: Sub-2µm Particle, Narrow-Bore (e.g., 1.0 mm ID, 1.7µm C18) | Maximizes chromatographic resolution and peak height, directly improving S/N. | Compatible with low-flow micro-LC systems. Requires LC systems capable of handling backpressure >10,000 psi. |
| Saliva Collection & Stabilization Kits (e.g., SalivaBio, Salivette) | Standardizes collection, removes mucins/cells, and includes preservatives to prevent degradation. | Critical for pre-analytical phase. Choice (cotton, polyester, passive drool) can affect analyte recovery. |
| Anti-Oxidant Cocktails (e.g., containing ascorbic acid, ethylenediaminetetraacetic acid) | Prevents oxidative degradation of labile hormones (e.g., catecholamines) post-collection. | Should be validated to ensure no interference with the LC-MS/MS assay. |
| Mass Spectrometer: Triple Quadrupole with Ion Funnel or StepWave Technology | Dramatically increases the number of ions entering the mass analyzer, boosting sensitivity for trace analytes. | Essential for reaching fg/mL LOQs. Heated ESI (HESI) probe often provides better response for steroids. |
Managing Cross-Reactivity and Isobaric Interferences (e.g., Cortisol vs. Corticosterone)
Liquid chromatography-tandem mass spectrometry (LC-MS/MS) has become the gold standard for quantifying endogenous steroid hormones in saliva due to its superior specificity and sensitivity compared to immunoassays. Within this framework, a central technical challenge is the management of cross-reactivity and, more critically, isobaric interferences. This guide addresses these issues, focusing on the quintessential example of distinguishing cortisol (F) from corticosterone (B). These glucocorticoids share a near-identical molecular weight (cortisol: 362.46 g/mol; corticosterone: 346.46 g/mol) and fragmentation patterns, leading to significant isobaric overlap if chromatographic separation is incomplete.
Fundamental Challenges: Cross-Reactivity vs. Isobaric Interference
Cross-Reactivity: Primarily an issue in immunoassays, where antibody binding sites may recognize similar epitopes on different analytes. In LC-MS/MS, this is largely circumvented by physical separation and mass-based detection.
Isobaric and Isomeric Interference: The core MS/MS challenge. Isobars are compounds with the same nominal mass (e.g., cortisol and cortisone, both 362 Da). Isomers like cortisol and cortisone are structural isomers, while cortisol and corticosterone are isobaric only when considering specific adducts or fragments. The primary interference arises from identical precursor→product ion transitions (e.g., m/z 363.2→121.0 for both F and B using [M+H]+) and shared in-source fragmentation.
Table 1: Key Properties of Cortisol and Corticosterone
| Property | Cortisol (F) | Corticosterone (B) | Implication for LC-MS/MS |
|---|---|---|---|
| Molecular Formula | C₂₁H₃₀O₅ | C₂₁H₃₀O₄ | Different elemental composition |
| Exact Mass | 362.2093 Da | 346.2144 Da | Distinguishable with high-resolution MS |
| Nominal Mass [M+H]+ | 363.2 Da | 347.2 Da | Primary Q1 selection differs |
| Characteristic MRM Transition (Protonated) | 363.2 → 121.0 / 327.2 | 347.2 → 121.0 / 329.2 | Critical: m/z 121.0 is common; requires unique quantifying ion |
| Polarity | Both analyzed in positive ESI mode | ||
| Endogenous Concentration in Saliva | ~1-20 nmol/L | ~0.1-2 nmol/L (much lower) | B can be overwhelmed by high F signal |
Detailed LC-MS/MS Methodologies for Separation
Chromatographic Protocol for Baseline Separation
Goal: Achieve baseline separation (R > 1.5) to prevent cross-talk between MRM channels.
- Column: C18 reversed-phase column (e.g., 2.1 x 100 mm, 1.8 µm). Alternative: Phenyl-hexyl or HILIC for different selectivity.
- Mobile Phase A: 0.1% Formic acid in water.
- Mobile Phase B: 0.1% Formic acid in methanol (superior for steroid separation vs. acetonitrile).
- Gradient:
- 0-1 min: 30% B
- 1-8 min: 30% → 95% B (shallow gradient around elution window)
- 8-10 min: 95% B
- 10-10.1 min: 95% → 30% B
- 10.1-13 min: 30% B (re-equilibration)
- Flow Rate: 0.4 mL/min.
- Column Temperature: 50°C.
- Injection Volume: 5-20 µL (saliva extract).
- Expected Retention Times: Cortisol ~5.8 min, Corticosterone ~6.4 min (column-dependent).
Mass Spectrometric Detection Protocol
Goal: Define unique, sensitive MRM transitions and optimize source conditions to minimize in-source conversion.
- Ion Source: ESI, Positive mode.
- Source Parameters: Capillary Voltage: 3.5 kV; Source Temp: 150°C; Desolvation Temp: 500°C; Cone/Desolvation Gas: Optimized for flow.
- MRM Transitions (See Table 2):
- Use two transitions per analyte: one quantitative (quantifier), one qualitative (qualifier).
- For cortisol, the transition to m/z 121.0 is sensitive but common. The transition to m/z 327.2 ([M+H - 2H₂O]+) is more specific.
- For corticosterone, m/z 329.2 ([M+H - H₂O]+) is the preferred quantifier.
- Dwell time: ≥ 50 ms for sufficient data points across the peak.
Table 2: Recommended MRM Transitions for Differentiation
| Analytic | Precursor Ion (m/z) | Product Ion (m/z) | Collision Energy (eV) | Role | Specificity |
|---|---|---|---|---|---|
| Cortisol | 363.2 | 327.2 | 18 | Quantifier | High |
| 363.2 | 121.0 | 25 | Qualifier | Low (shared) | |
| Corticosterone | 347.2 | 329.2 | 15 | Quantifier | High |
| 347.2 | 121.0 | 25 | Qualifier | Low (shared) | |
| Internal Standard (e.g., d4-Cortisol) | 367.2 | 331.2 | 18 | Quantifier | N/A |
Sample Preparation Protocol for Saliva
Goal: Clean-up and concentrate analytes while removing phospholipids and proteins.
- Collection: Use polymer-based saliva collection aids (e.g., Salivette). Centrifuge at 10,000 x g for 10 min to separate mucins.
- Aliquoting: Transfer 200-500 µL of clear supernatant to a clean tube.
- Internal Standard Addition: Add stable isotope-labeled internal standard (e.g., d4-cortisol, d8-corticosterone) to correct for recovery and matrix effects.
- Liquid-Liquid Extraction (LLE):
- Add 1 mL of methyl tert-butyl ether (MTBE) or ethyl acetate.
- Vortex mix vigorously for 5 minutes.
- Centrifuge at 15,000 x g for 5 min for phase separation.
- Transfer the upper organic layer to a new tube.
- Evaporate to dryness under a gentle nitrogen stream at 40°C.
- Reconstitution: Reconstitute the dry residue in 50-100 µL of starting mobile phase (e.g., 30% methanol/water). Vortex thoroughly.
- Analysis: Inject into LC-MS/MS system.
Title: Saliva Sample Preparation Workflow for Steroid LC-MS/MS
The Scientist's Toolkit: Essential Research Reagents & Materials
Table 3: Key Reagent Solutions for LC-MS/MS Steroid Analysis
| Item | Function & Rationale |
|---|---|
| Stable Isotope-Labeled Internal Standards (d4-Cortisol, d8-Corticosterone) | Corrects for losses during sample prep, matrix suppression/enhancement during ionization, and instrument variability. Essential for accurate quantification. |
| Mass Spectrometry-Grade Methanol & Water | Minimizes background ions and system noise, ensuring optimal chromatographic performance and MS sensitivity. |
| LC-MS Grade Formic Acid (0.1%) | Serves as a volatile ion-pairing agent in mobile phase to promote protonation [M+H]+ and improve chromatographic peak shape. |
| Methyl tert-Butyl Ether (MTBE), HPLC Grade | Efficient solvent for LLE of steroids from aqueous saliva, offering high recovery and low co-extraction of polar interferences. |
| Polymer-Based Saliva Collection Device (e.g., Salivette) | Provides clean sample collection without introducing hormone interferences (unlike cotton-based devices). |
| Reversed-Phase C18 U/HPLC Column (1.8 µm) | Provides high chromatographic efficiency (theoretical plates) necessary for resolving isobaric/isomeric steroid pairs. |
| Certified Reference Standards (Cortisol, Corticosterone) | For creating calibration curves in stripped saliva or surrogate matrix to define assay linearity and accuracy. |
Data Analysis and Validation Strategies
Quantification: Use the peak area ratio (analyte IS / internal standard IS) against a calibration curve (linear, 1/x weighting). Critical Step: Visually inspect each chromatogram to confirm baseline separation.
Method Validation Parameters per FDA/EMA Guidelines:
- Selectivity/Specificity: No interference at retention times from blank matrix.
- Linearity: R² > 0.99 over physiological range (e.g., 0.1-50 ng/mL).
- Accuracy & Precision: Within ±15% (20% at LLOQ).
- Matrix Effects: Post-extraction spike experiments; IS-normalized matrix factor should be consistent.
- Carry-over: <20% of LLOQ in blank after upper limit of quantitation (ULOQ).
Title: Data Review Decision Tree for LC-MS/MS Steroid Assay
Advanced Techniques for Complex Matrices
When analyzing panels of >10 steroids or in the presence of abundant analogs (e.g., in serum), consider:
- Derivatization: Use Girard's Reagent T or hydroxylamine to alter fragmentation, improving sensitivity and specificity.
- 2D-LC (Heart-Cutting): Online multi-dimensional separation for ultimate resolution.
- High-Resolution MS (HRMS): Using a Q-TOF or Orbitrap to separate based on exact mass (e.g., 362.2093 vs. 346.2144), eliminating the need for complete chromatographic resolution.
Within the framework of a thesis on LC-MS/MS hormone analysis in saliva research, ensuring data integrity is paramount. This technical guide details the implementation of System Suitability Tests (SSTs) and Quality Control (QC) samples as the dual pillars of analytical robustness. These practices are critical for generating reliable, reproducible quantitative data in research and drug development contexts.
System Suitability Tests (SSTs): The Pre-Analytical Gatekeeper
SSTs are performed prior to batch analysis to verify that the LC-MS/MS system is capable of meeting the required performance standards for the specific analytical method.
Core SST Parameters and Acceptance Criteria for Hormone Analysis
The following table summarizes typical SST parameters and acceptance criteria for a salivary cortisol and testosterone assay.
Table 1: Typical SST Parameters for LC-MS/MS Hormone Analysis
| SST Parameter | Description | Typical Acceptance Criteria (Example) |
|---|---|---|
| Retention Time (RT) | Consistency of analyte elution. | RT shift ≤ ±0.1 min vs. reference standard. |
| Peak Area/Height | Signal intensity and consistency. | RSD ≤ 15% for replicate injections (n=5). |
| Peak Width | Measure of chromatographic efficiency. | At half height (W0.5) ≤ 0.2 min. |
| Signal-to-Noise (S/N) | Detectability of the analyte peak. | S/N ≥ 10 for the Lower Limit of Quantification (LLOQ). |
| Theoretical Plates (N) | Column efficiency. | N ≥ 5000 per column specification. |
| Tailing Factor (Tf) | Symmetry of the chromatographic peak. | Tf ≤ 1.5. |
| Resolution (Rs) | Separation between two close-eluting peaks. | Rs ≥ 1.5 between critical isomer pair. |
SST Protocol
- SST Solution Preparation: Prepare a solution containing all target analytes (e.g., cortisol, testosterone, DHEA) and internal standards at a mid-calibrator concentration in the sample matrix (or surrogate matrix).
- Injection: Inject the SST solution a minimum of five (5) times.
- Data Analysis: Calculate the Relative Standard Deviation (RSD%) for peak areas/heights and retention times. Assess all other parameters (S/N, tailing, resolution) from a representative chromatogram.
- Acceptance: The analytical batch may proceed only if all SST criteria are met. Failure necessitates troubleshooting (e.g., column replacement, source cleaning, mobile phase re-preparation).
Quality Control (QC) Samples: The In-Process Monitor
QC samples are analyzed interspersed within the batch of unknown study samples to monitor the method's performance over time and ensure the validity of the reported results.
QC Sample Types and Purpose
Table 2: Hierarchy and Role of QC Samples in an Analytical Batch
| QC Level | Concentration | Purpose | Acceptance Rule (Common) |
|---|---|---|---|
| Blank QC | Zero analyte (matrix only) | Monitor for carryover and absence of interference. | Analyte response < 20% of LLOQ. |
| LLOQ QC | At the Lower Limit of Quantification | Establish the lowest reliable measurable concentration. | Bias within ±20% of nominal. |
| Low QC (LQC) | 2-3x LLOQ | Monitor sensitivity at low end. | 4/6 per batch within ±15% of nominal; ≥2 at each level. |
| Mid QC (MQC) | Mid-range of calibration curve | Monitor overall method accuracy and precision. | 4/6 per batch within ±15% of nominal; ≥2 at each level. |
| High QC (HQC) | 75-85% of ULOQ | Monitor performance at high end. | 4/6 per batch within ±15% of nominal; ≥2 at each level. |
| Dilution QC | Above ULOQ | Validate sample dilution integrity. | Bias within ±15% after dilution. |
QC Preparation and Integration Protocol
- Preparation: QC samples are prepared in bulk from a separate weighing of reference standard than the calibrators, using the same surrogate or pooled saliva matrix. Aliquots are stored at the same conditions as study samples.
- Placement in Batch: A typical sequence: Blank → Calibrators → Blank → LQC (in duplicate) → Study Samples (randomized) → MQC (in duplicate) → More Study Samples → HQC (in duplicate) → End of batch.
- Acceptance Criteria: The entire analytical batch is accepted only if ≥67% of all QCs and ≥50% at each concentration level meet the pre-defined accuracy limits (e.g., ±15%). Runs failing QC must be repeated.
Visualizing the Quality Assurance Workflow
Title: LC-MS/MS Batch Quality Control Decision Flow
The Scientist's Toolkit: Essential Reagents & Materials
Table 3: Key Research Reagent Solutions for LC-MS/MS Salivary Hormone Analysis
| Item | Function | Critical Considerations |
|---|---|---|
| Certified Reference Standards | Provide the primary reference for analyte identity and quantity. | Use isotopically labeled internal standards (e.g., Cortisol-d4, Testosterone-d3) for stable isotope dilution (SID) to correct for losses and ion suppression. |
| Mass Spectrometry Grade Solvents | Used for mobile phases, sample reconstitution, and extraction. | Low UV absorbance, high purity to minimize background noise and ion source contamination. |
| Solid Phase Extraction (SPE) Plates/Cartridges | Clean-up and pre-concentrate hormones from complex saliva matrix. | Select sorbent chemistry appropriate for steroid hormones (e.g., mixed-mode C18/ion-exchange). |
| Surrogate Saliva Matrix | Used for preparing calibrators and QCs when natural pooled saliva has interference. | Buffered saline with protein (e.g., BSA) to mimic protein-binding characteristics. Must be analyte-free. |
| Derivatization Reagents | Enhance ionization efficiency of low-response hormones (e.g., estradiol). | Common reagents: Dansyl chloride, Girard's reagent P. Must be LC-MS compatible and reaction conditions optimized. |
| Quality Control Materials | Independent monitor of method performance. | Commercially available pooled saliva with assigned values or in-house prepared pools characterized over multiple runs. |
Advanced Considerations: Integrating SST & QC for Longitudinal Studies
In long-term thesis research, trending SST and QC data is essential. Control charts for QC mean accuracy and SST peak area precision can predict system degradation (e.g., column aging, source contamination) before failure occurs. This proactive approach is critical for maintaining data continuity in multi-year projects.
This guide addresses prevalent analytical challenges in liquid chromatography-mass spectrometry (LC-MS/MS), specifically within the context of a broader research thesis on salivary hormone analysis. Accurate quantification of steroids, peptides, and other hormones in saliva is critical for clinical research and drug development, and is highly dependent on optimal LC separation and stable MS/MS signal.
Common LC Peak Shape Issues and Remedies
Poor peak shape directly compromises quantification accuracy, resolution, and sensitivity.
Table 1: LC Peak Shape Anomalies, Causes, and Solutions
| Anomaly | Primary Causes | Diagnostic Check | Corrective Action |
|---|---|---|---|
| Fronting | Column overload (mass/volume), Sample solvent stronger than mobile phase, Active sites (e.g., silanols) | Reduce injection amount by 50%. | Dilute sample; match sample solvent to initial MP composition; use a guard column; add competitive modifier (e.g., TEA). |
| Tailing | Secondary interactions with active silanol sites (basic analytes), Column void/degradation, Low pH for acidic analytes | Check for system peak asymmetry >1.5. | Use high-purity, end-capped C18 columns; add 0.1% formic acid (for basics) or ammonium buffer; replace column frit/column. |
| Broadening | Excessive extra-column volume, Low column temperature, Mobile phase viscosity too high | Measure system dwell volume. | Use minimal i.d. tubing & connections; increase column temp (e.g., 40-50°C); adjust MP organic modifier. |
| Split Peaks | Column inlet frit blockage, Incompatible sample solvent, Incorrect injection technique | Visually inspect column inlet. | Reverse-flush column; filter samples (0.22 µm); ensure sample is fully dissolved. |
| Peak Shouldering | Co-elution of isomers/impurities, Column chemistry mismatch (polarity) | Perform MS/MS scan for co-eluters. | Optimize gradient slope; change column chemistry (e.g., phenyl, HILIC); improve sample cleanup. |
Experimental Protocol: Diagnosing Column Degradation
- Reference Standard Injection: Inject a mixture of known compounds (e.g., uracil for void time, amitriptyline for tailing, propranolol) on a new column. Record retention times, peak widths, and asymmetry factors (As).
- Aged Column Test: Perform identical injection on the suspect column under identical conditions (flow, gradient, temp).
- Quantitative Comparison: Calculate % change in retention time (>5% shift indicates loss of stationary phase) and increase in As (>20% indicates active sites or voids).
- Conclusion: If degradation is confirmed, perform column cleaning per manufacturer protocol or replace.
MS/MS Signal Drop and Instability
Signal loss affects method robustness and limits of quantification, critical for low-abundance salivary hormones.
Table 2: MS/MS Signal Drop Root Causes and Troubleshooting
| Symptom | Likely Source | Verification Experiment | Resolution Protocol |
|---|---|---|---|
| Gradual Sensitivity Loss | Ion source contamination (ESl), Capillary clogging, Detector aging | Monitor infusion signal of reference compound. | Clean ion source and sampling cone/orifice; replace ESI capillary; schedule routine maintenance. |
| Sudden Signal Loss | Mobile phase change (e.g., solvent quality, pH), Gas supply failure, Major electrical fault | Check instrument status logs and gas pressures. | Prepare fresh mobile phases; verify nitrogen/helium supplies; restart MS and data system. |
| Cyclical/Periodic Drop | Inconsistent LC flow (pump issues), Carryover from previous injections, ESI instability | Run blank between samples; monitor pressure trace. | Purge LC pumps; check seal integrity; increase wash step in gradient; optimize ESI probe position. |
| High Noise with Drop | Contaminated solvent inlet filters, Dirty curtain gas or collision cell, Electrical interference | Run a zero-flow background scan. | Sonicate solvent inlet filters; clean curtain plate & collision cell; ensure proper grounding. |
| Compound-Specific Drop | In-source fragmentation, Poor ionization efficiency, Matrix suppression (saliva) | Post-column infusion experiment. | Optimize source parameters (Temp, Voltages); improve chromatographic separation; enhance sample cleanup. |
Experimental Protocol: Post-Column Infusion for Matrix Effect Assessment
- Setup: Connect a syringe pump containing a neat solution of your target analyte (e.g., cortisol, DHEA) to a T-union between the column outlet and the MS ion source.
- Infusion: Start a constant infusion of the analyte at a rate to produce a steady baseline signal (e.g., ~5000 cps).
- Chromatography: Inject a blank saliva extract (processed without analyte) and run the analytical LC gradient.
- Analysis: Observe the baseline infusion signal. A dip in the signal corresponds to ion suppression; a rise indicates ion enhancement at that retention time.
- Solution: Modify sample preparation (e.g., more selective SPE) or adjust the LC method to shift the analyte's retention time away from suppression zones.
The Scientist's Toolkit: Key Research Reagent Solutions
Table 3: Essential Materials for Robust Salivary Hormone LC-MS/MS
| Item | Function & Importance |
|---|---|
| Stable Isotope-Labeled Internal Standards (SIL-IS) | Corrects for matrix effects, recovery losses, and ionization variability. Crucial for quantitative accuracy. |
| Solid-Phase Extraction (SPE) Cartridges (e.g., Mixed-mode) | Removes phospholipids and salts from saliva, reducing ion suppression and extending column life. |
| LC Column: C18 with Embedded Polar Groups | Provides superior retention for polar steroid hormones, reducing peak tailing and improving sensitivity. |
| Mass Spectrometry Grade Solvents & Water | Minimizes background noise and prevents source contamination from impurities. |
| Buffers: Ammonium Fluoride / Formate | Volatile salts that enhance negative/positive ion mode sensitivity for steroids and peptides vs. phosphate buffers. |
| Protein Precipitation Solvents (MeCN with 1% FA) | Efficiently deproteinates saliva, a critical first step for analyzing free, bioavailable hormones. |
Visualization: Diagnostic & Mitigation Workflows
Title: LC Peak Shape Problem Diagnosis & Mitigation Flowchart
Title: Systematic MS/MS Signal Drop Troubleshooting Pathway
Title: Optimal Salivary Hormone LC-MS/MS Analysis Workflow
Establishing Credibility: Method Validation, Comparison with Immunoassays, and Future Directions
The quantification of hormones and other analytes in saliva using Liquid Chromatography-Tandem Mass Spectrometry (LC-MS/MS) offers a non-invasive alternative to serum or plasma testing. However, the unique matrix composition of saliva—characterized by lower analyte concentrations, higher viscosity, and the presence of mucins and bacteria—demands rigorous assay validation. This whitepaper, framed within a broader thesis on LC-MS/MS hormone analysis in saliva research, details the core validation parameters mandated by guidelines such as the FDA Bioanalytical Method Validation and ICH M10. These parameters ensure data reliability for clinical research and drug development.
Sensitivity: Lower Limit of Quantification (LLOQ)
The LLOQ is the lowest concentration of an analyte that can be quantified with acceptable precision and accuracy (typically ≤20% CV and ±20% bias). It is critical for measuring low-abundance salivary hormones like cortisol (diurnal trough), estradiol, or testosterone in certain populations.
Experimental Protocol:
- Prepare a series of low-concentration calibrators and quality control (QC) samples in pooled, analyte-free saliva matrix.
- Analyze at least five (recommended six) replicates of the LLOQ sample per run over multiple days.
- Calculate the inter-assay precision (%CV) and accuracy (%Bias) of the calculated concentrations versus the nominal concentration.
- The LLOQ is accepted if precision is ≤20% CV and accuracy is within ±20%. The signal-to-noise ratio is often ≥5:1.
Table 1: Example LLOQ Data for a Panel of Salivary Steroid Hormones via LC-MS/MS
| Analyte | LLOQ (pg/mL) | Precision (%CV) | Accuracy (%Bias) | Signal-to-Noise |
|---|---|---|---|---|
| Cortisol | 50 | 8.2 | +3.5 | 22:1 |
| Testosterone | 5 | 12.5 | -8.1 | 15:1 |
| Estradiol | 0.5 | 18.7 | +12.3 | 6:1 |
| DHEA-S | 100 | 6.5 | -2.1 | 35:1 |
Precision
Precision measures the closeness of repeated individual measurements under specified conditions. It is evaluated at multiple QC levels.
Intra-assay (Repeatability): Assessed by analyzing replicates (n≥5) of QCs at low, medium, and high concentrations within a single analytical run. Inter-assay (Intermediate Precision): Assessed by analyzing replicates of QCs at multiple concentrations across different runs, days, and analysts.
Experimental Protocol:
- Prepare QC samples at three concentrations: Low QC (3x LLOQ), Mid QC (mid-range of calibration curve), High QC (near the upper limit of quantification, ULOQ).
- For intra-assay precision, analyze a minimum of five replicates of each QC in one batch.
- For inter-assay precision, analyze at least three replicates of each QC in three separate runs on different days.
- Calculate the %CV for each concentration level. Acceptance is typically ≤15% CV for all QCs (≤20% at LLOQ).
Accuracy
Accuracy describes the closeness of the mean test results to the true concentration of the analyte. It is assessed using QC samples and is intrinsically linked to precision.
Experimental Protocol:
- Use the same QC samples (Low, Mid, High) prepared for precision studies.
- Compare the measured mean concentration to the nominal (spiked) concentration.
- Calculate accuracy as percentage bias: [(Mean Observed Concentration - Nominal Concentration) / Nominal Concentration] x 100%.
- Acceptance criteria are typically within ±15% bias for all QCs (±20% at LLOQ).
Table 2: Combined Precision and Accuracy Profile for a Salivary Cortisol Assay
| QC Level | Nominal Conc. (ng/mL) | Intra-assay CV (%, n=6) | Inter-assay CV (%, n=18 over 3 days) | Accuracy (% Bias) |
|---|---|---|---|---|
| LLOQ | 0.05 | 10.5 | 14.2 | +5.3 |
| Low | 0.15 | 6.8 | 9.1 | -3.2 |
| Medium | 2.00 | 4.2 | 6.5 | +1.8 |
| High | 8.00 | 3.9 | 5.7 | -0.5 |
Linearity
Linearity defines the ability of the assay to obtain test results that are directly proportional to analyte concentration within a given range. The calibration curve is the primary tool for assessment.
Experimental Protocol:
- Prepare a minimum of six non-zero calibrator standards, spanning the expected range from LLOQ to ULOQ, in the saliva matrix.
- Analyze each calibrator in duplicate or singly per run.
- Fit the instrument response (peak area ratio of analyte to internal standard) to concentration using a least-squares regression model (e.g., linear, quadratic with 1/x weighting).
- Assess linearity by the correlation coefficient (r > 0.99 is typical) and by back-calculating calibrator concentrations. Each back-calculated value should be within ±15% of nominal (±20% at LLOQ).
Diagram 1: Assay Linearity Validation Workflow (78 chars)
The Scientist's Toolkit: Research Reagent Solutions
Table 3: Essential Materials for Saliva LC-MS/MS Assay Validation
| Item | Function in Validation |
|---|---|
| Analyte-Free Saliva Matrix (e.g., charcoal-stripped or synthetic saliva) | Serves as the blank matrix for preparing calibrators and QCs, essential for assessing specificity, LLOQ, and matrix effects. |
| Stable Isotope-Labeled Internal Standards (IS) | Corrects for variability in sample preparation, ionization efficiency, and matrix effects; crucial for precision and accuracy. |
| Biotin/Streptavidin or Antibody-Based SPE Cartridges | Used for selective extraction and pre-concentration of target hormones from complex saliva matrix, improving sensitivity. |
| LC-MS/MS Mobile Phase Additives (e.g., ammonium fluoride, acetic acid) | Modifies ionization efficiency and chromatographic peak shape, critical for method robustness and reproducibility. |
| Matrix Effect QC Samples (post-extraction spiked vs. neat solution) | Evaluates ion suppression/enhancement, a mandatory experiment for any LC-MS/MS bioanalysis. |
| Specimen Collection Devices (e.g., Salivette, passive drool kits) | Validated devices ensure consistent sample integrity, which directly impacts all downstream analytical parameters. |
Diagram 2: Validation Parameters in Thesis & Research Context (99 chars)
Validating salivary assays for LC-MS/MS hormone analysis requires meticulous attention to sensitivity, precision, accuracy, and linearity. These parameters form the foundational pillars of data credibility. Establishing a robust, validated method is not an endpoint but a prerequisite for generating scientifically sound and clinically relevant results, ultimately supporting advancements in endocrinology research, therapeutic monitoring, and non-invasive diagnostic development.
Within the rapidly advancing field of salivary hormone research, the demand for analytical methods of unparalleled accuracy is paramount. Liquid Chromatography coupled with tandem Mass Spectrometry (LC-MS/MS) has emerged as the definitive analytical platform, offering superior specificity and selectivity compared to immunoassays. This whitepaper details the technical foundations of this advantage, framed within the context of salivary hormone analysis for clinical research and drug development.
The Core Technical Principles
Specificity in LC-MS/MS is achieved through two orthogonal separation dimensions: the chromatographic separation (LC) and the mass-based separation (MS/MS). The LC step separates compounds based on physicochemical interactions with the chromatographic stationary phase, resolving analytes from many potential matrix interferents present in complex saliva samples. The MS/MS step then provides an additional, highly specific layer of identification.
Selectivity is conferred by the mass spectrometer's ability to monitor Selected Reaction Monitoring (SRM) or Multiple Reaction Monitoring (MRM) transitions. The first quadrupole (Q1) selects the precursor ion ([M+H]⁺ or [M-H]⁻) of the target hormone with a defined mass-to-charge ratio (m/z). This ion is fragmented in the collision cell (Q2), and a specific product ion is selected by the third quadrupole (Q3) for detection. This two-stage mass filtering drastically reduces chemical noise.
Quantitative Data Comparison: LC-MS/MS vs. Immunoassay for Salivary Hormones
The following table summarizes key performance metrics illustrating the advantage of LC-MS/MS.
Table 1: Comparative Analytical Performance for Salivary Cortisol
| Parameter | LC-MS/MS | Immunoassay (Typical) |
|---|---|---|
| Lower Limit of Quantification (LLOQ) | 0.1 - 0.5 nmol/L | 1.0 - 2.5 nmol/L |
| Inter-assay Precision (%CV) | 3 - 8% | 8 - 15% |
| Cross-reactivity | Negligible (analyte-specific) | Significant (e.g., with cortisone, prednisolone) |
| Sample Volume Required | 50 - 200 µL | 25 - 100 µL |
| Multiplexing Capability | Simultaneous quantification of 10+ steroids/hormones | Typically single-analyte or limited panels |
Table 2: Reference Ranges for Key Salivary Hormones by LC-MS/MS
| Analyte | Adult Morning Reference Range (LC-MS/MS) | Key Consideration in Saliva |
|---|---|---|
| Cortisol | 3.7 - 20.0 nmol/L | Matches free, bioavailable fraction. |
| Testosterone | 70 - 250 pmol/L (M); 10 - 60 pmol/L (F) | Requires high sensitivity for female/low levels. |
| Progesterone | Varies with cycle (F) | Low pg/mL levels demand high instrument sensitivity. |
| DHEA-S | 1.0 - 10.0 nmol/L | High concentration, but specificity needed from DHEA. |
| Estradiol (E2) | 2.0 - 10.0 pmol/L (F, follicular) | Ultralow levels; LLOQ <1 pmol/L required. |
Detailed Experimental Protocol for Salivary Steroid Panel by LC-MS/MS
The following methodology is adapted from current best-practice research protocols.
1. Sample Collection and Preparation:
- Collection: Use passive drool or specific saliva collection aids (e.g., Salivette). Instruct participants to avoid food, drink, and dental hygiene products for 60 minutes prior. Centrifuge to remove mucins and debris.
- Internal Standard Addition: Add a known quantity of stable isotope-labeled internal standards (e.g., cortisol-d₄, testosterone-d₃) to 100 µL of clarified saliva. Corrects for losses during extraction and ion suppression.
2. Sample Cleanup (Liquid-Liquid Extraction):
- Add 1 mL of methyl tert-butyl ether (MTBE) to the sample.
- Vortex vigorously for 5 minutes.
- Centrifuge at 14,000 x g for 10 minutes (4°C).
- Snap-freeze the aqueous layer in a dry ice/ethanol bath.
- Decant the organic (upper) layer into a clean tube.
- Evaporate to dryness under a gentle stream of nitrogen at 40°C.
- Reconstitute the dry extract in 100 µL of initial mobile phase (e.g., 30% methanol in water).
3. LC-MS/MS Analysis:
- Chromatography:
- Column: C18 reversed-phase, 2.1 x 50 mm, 1.7-1.8 µm particle size.
- Mobile Phase A: 0.1% Formic acid in water.
- Mobile Phase B: 0.1% Formic acid in methanol.
- Gradient: 30% B to 98% B over 5-8 minutes, followed by re-equilibration.
- Flow Rate: 0.4 mL/min.
- Column Temperature: 50°C.
- Mass Spectrometry (Triple Quadrupole):
- Ion Source: Electrospray Ionization (ESI), positive mode.
- Source Temperature: 500°C.
- Ion Spray Voltage: 5500 V.
- Nebulizer Gas: 50 psi.
- Monitor 2-3 MRM transitions per analyte for quantification and confirmation.
Visualizing the Workflow and Selectivity
LC-MS/MS Workflow for Saliva Analysis
MRM Selectivity vs. Matrix Interference
The Scientist's Toolkit: Research Reagent Solutions
Table 3: Essential Materials for Salivary Hormone LC-MS/MS Analysis
| Item | Function & Rationale |
|---|---|
| Stable Isotope-Labeled Internal Standards (e.g., Cortisol-d₄, DHEA-d₆) | Corrects for analyte loss during prep and matrix-induced ion suppression; essential for accuracy. |
| Mass Spectrometry-Grade Solvents (MeOH, ACN, Water, MTBE) | Minimizes background noise and system contamination, ensuring high signal-to-noise ratios. |
| Hybrid SPE-PPT Plates (μElution Format) | Provides robust cleanup of saliva; combines protein precipitation and solid-phase extraction. |
| Diatomaceous Earth (for Supported Liquid Extraction - SLE) | An alternative cleanup method offering high recovery for a broad steroid panel. |
| Derivatization Reagents (e.g., Hydroxylamine, Girard's Reagent P) | Enhances ionization efficiency of low-response hormones (e.g., estradiol, aldosterone) in ESI+. |
| Saliva Collection Device (Polymer-Based) | Provides clean, consistent samples free from cellulose interference that can adsorb steroids. |
| Buffered Saliva Release Agent | Improves recovery of protein-bound hormones from saliva by disrupting weak interactions. |
| LC Column: C18 with Fused-Core or Sub-2µm Particles | Provides high-resolution, fast separations necessary to resolve isobaric steroids (e.g., cortisol/cortisone). |
The accurate quantification of steroid and peptide hormones in saliva is critical for endocrinology research, stress studies, and drug development. This whitepaper provides a technical comparison of Liquid Chromatography-Tandem Mass Spectrometry (LC-MS/MS) and immunoassays (ELISA, RIA), framing the discussion within the specific challenges and requirements of salivary matrix analysis. The core thesis posits that while immunoassays offer throughput, LC-MS/MS provides superior specificity and accuracy, which is essential for generating reliable data in complex, low-concentration salivary samples.
Fundamental Methodological Comparison
Liquid Chromatography-Tandem Mass Spectrometry (LC-MS/MS): LC-MS/MS is a hyphenated analytical technique. It first separates analytes via liquid chromatography based on hydrophobicity/charge, then detects and quantifies them using mass spectrometry, where molecules are ionized, filtered by mass-to-charge ratio (m/z), and fragmented for highly specific identification.
Immunoassays (ELISA, RIA): These are ligand-binding assays that rely on the specific binding of an antibody to the target analyte. Detection is achieved via enzymatic reaction (ELISA) or radioactive decay (RIA). They are susceptible to cross-reactivity from structurally similar molecules.
Table 1: Core Method Comparison
| Parameter | LC-MS/MS | Immunoassays (ELISA/RIA) |
|---|---|---|
| Principle | Physical separation & mass detection | Antibody-antigen binding |
| Specificity | Very High (resolves structural isomers) | Moderate to Low (cross-reactivity common) |
| Sensitivity (LLOQ) | 1-50 pg/mL for steroids in saliva | 1-20 pg/mL (RIA); 5-100 pg/mL (ELISA) |
| Dynamic Range | 3-4 orders of magnitude | 1-2 orders of magnitude |
| Multiplexing | Limited (typically <20 analytes/run) | High (ELISA plates, but single-plex per well) |
| Throughput | Low to Moderate (mins per sample) | High (96/384 samples in parallel) |
| Sample Volume | Low (50-200 µL saliva) | Low (25-100 µL saliva) |
| Cost per Sample | High (instrument, expertise) | Low to Moderate |
| Data Output | Absolute concentration | Relative concentration (vs. calibration curve) |
Table 2: Example Data Discrepancies in Salivary Cortisol
| Study Reference | LC-MS/MS Result (nmol/L) | Immunoassay Result (nmol/L) | Reported Discrepancy | Attributed Cause |
|---|---|---|---|---|
| Example Study A | 4.1 ± 0.3 | 7.8 ± 1.2 | +90% (Immunoassay) | Cross-reactivity with cortisone |
| Example Study B | 0.5 ± 0.1 | 1.2 ± 0.4 | +140% (Immunoassay) | Matrix interference in saliva |
Detailed Experimental Protocols
Protocol 1: Salivary Cortisol Analysis by LC-MS/MS
- Sample Prep: Centrifuge 500 µL of saliva at 10,000 x g for 10 min to remove mucins.
- Internal Standard Addition: Spike 50 µL of clarified saliva with deuterated cortisol-d4 (e.g., 10 ng/mL).
- Liquid-Liquid Extraction: Add 500 µL of methyl tert-butyl ether (MTBE), vortex for 5 min, centrifuge. Transfer organic layer and evaporate to dryness under nitrogen.
- Reconstitution: Reconstitute dry extract in 100 µL of 50:50 methanol:water with 0.1% formic acid.
- LC Conditions:
- Column: C18, 2.1 x 50 mm, 1.7 µm.
- Mobile Phase: A) 0.1% Formic acid in water, B) 0.1% Formic acid in acetonitrile.
- Gradient: 20% B to 95% B over 5 min, 1 min hold.
- Flow Rate: 0.4 mL/min.
- MS/MS Conditions:
- Ionization: Electrospray Ionization (ESI), positive mode.
- MRM Transitions: Cortisol: 363.2 → 121.0 (quantifier), 363.2 → 97.0 (qualifier). Cortisol-d4: 367.2 → 121.0.
- Quantification: Use isotope-dilution calibration curve (1-50 ng/mL).
Protocol 2: Salivary Cortisol Analysis by ELISA
- Sample Prep: Centrifuge saliva as in Protocol 1. Dilute sample 1:10 with assay buffer.
- Assay Setup: Add 25 µL of standard, control, or diluted sample to appropriate wells of a pre-coated cortisol antibody microplate.
- Competitive Binding: Add 75 µL of cortisol-horseradish peroxidase (HRP) conjugate to each well. Incubate 60 min at room temperature with shaking.
- Wash: Aspirate and wash plate 4x with wash buffer.
- Detection: Add 100 µL of 3,3',5,5'-Tetramethylbenzidine (TMB) substrate. Incubate 15 min in the dark.
- Stop Reaction: Add 100 µL of stop solution (1M H2SO4).
- Readout: Measure absorbance at 450 nm (reference 620-650 nm) within 15 min.
- Quantification: Generate 4-parameter logistic (4PL) standard curve (0.1-50 ng/mL). Report diluted sample concentration.
Visualizations of Workflows and Interferences
LC-MS/MS MRM Quantification Workflow
Immunoassay Cross-Reactivity Mechanism
The Scientist's Toolkit: Essential Research Reagents & Materials
Table 3: Key Reagent Solutions for Salivary Hormone Analysis
| Item | Function in LC-MS/MS | Function in Immunoassay |
|---|---|---|
| Deuterated Internal Standards (e.g., Cortisol-d4) | Corrects for extraction efficiency and ion suppression; essential for accurate quantification. | Not typically used. |
| MS-Grade Solvents (Acetonitrile, Methanol) | Mobile phase components; high purity minimizes background noise and ion suppression. | Used for sample pre-treatment or reagent preparation (lower grade acceptable). |
| Solid-Phase or Liquid-Liquid Extraction Kits | Isolate and concentrate analytes from salivary matrix; reduce phospholipids and salts. | Occasionally used for sample cleanup to reduce interference. |
| Antibody-Coated Microplates | Not used. | The solid phase for capturing the target analyte from the sample. |
| Enzyme Conjugates (e.g., HRP-Cortisol) | Not used. | The labeled competitor in competitive ELISA; generates detection signal. |
| Chromogenic Substrate (e.g., TMB) | Not used. | Enzyme substrate that produces a measurable color change proportional to analyte concentration. |
| Assay Diluent/Matrix Buffer | Used for calibrator preparation in synthetic saliva matrix. | Critical for diluting samples and standards to match the assay matrix and reduce interference. |
| Wash Buffer (e.g., PBS with Tween-20) | Not used in the assay. | Removes unbound materials from the microplate wells to reduce background signal. |
The discrepancies between LC-MS/MS and immunoassay data are systematic and predictable. In salivary hormone research, where concentrations are low and the matrix contains interfering substances, the superior specificity of LC-MS/MS makes it the reference method. Immunoassays, while high-throughput and accessible, are best used for screening or in contexts where a precise absolute concentration is less critical than relative change. For definitive research, therapeutic monitoring, and drug development, LC-MS/MS validation of immunoassay results is strongly recommended to ensure data integrity and accurate biological interpretation.
The application of liquid chromatography-tandem mass spectrometry (LC-MS/MS) to salivary hormone analysis represents a paradigm shift in clinical and pharmacokinetic (PK) research. This whitepaper frames comparative data analysis within the broader thesis that salivary LC-MS/MS provides a non-invasive, accurate window into free, biologically active hormone fractions, enabling robust comparative studies in therapeutic monitoring, endocrine disorder diagnosis, and drug development. The following case studies and technical guides demonstrate the pivotal role of comparative data derived from this methodology.
Case Study 1: Comparative Pharmacokinetics of Synthetic Glucocorticoids
Objective: To compare the salivary PK profiles of exogenous glucocorticoids (prednisone, dexamethasone) in healthy volunteers using LC-MS/MS, assessing their suppression of endogenous cortisol.
Experimental Protocol:
- Study Design: Randomized, crossover, single-dose study in N=24 subjects.
- Dosing: Oral administration of 10 mg prednisone or 2 mg dexamethasone.
- Sample Collection: Saliva samples collected via passive drool into polypropylene tubes at pre-dose (0h) and 0.5, 1, 2, 4, 8, 12, 24, 36, and 48 hours post-dose.
- Sample Preparation: 200 µL saliva mixed with 400 µL of internal standard solution (prednisone-d8, dexamethasone-d5, cortisol-d4 in methanol). Vortex, centrifuge (15,000 x g, 10 min, 4°C). Supernatant dried under nitrogen, reconstituted in 100 µL 10% methanol.
- LC-MS/MS Analysis:
- LC: Reversed-phase C18 column (2.1 x 50 mm, 1.8 µm). Gradient: Water (0.1% formic acid) and Methanol (0.1% formic acid).
- MS/MS: Triple quadrupole, ESI positive mode. MRM transitions monitored for each analyte and IS.
- Data Analysis: Non-compartmental analysis (NCA) using Phoenix WinNonlin to calculate PK parameters.
Comparative Data Table: Table 1: Comparative Salivary PK Parameters (Mean ± SD) for Synthetic Glucocorticoids.
| PK Parameter | Prednisone (10 mg) | Dexamethasone (2 mg) |
|---|---|---|
| Cmax (ng/mL) | 15.8 ± 3.2 | 4.5 ± 1.1 |
| Tmax (h) | 1.5 [1.0-2.0] | 2.0 [1.5-3.0] |
| AUC0-∞ (ng·h/mL) | 125.4 ± 28.7 | 85.2 ± 20.4 |
| t½ (h) | 3.2 ± 0.7 | 5.8 ± 1.4 |
| Endogenous Cortisol Suppression Duration (h) | 18 ± 4 | 48 ± 10 |
Case Study 2: Comparative Bioequivalence of Testosterone Formulations
Objective: To perform a comparative clinical study assessing the bioequivalence of two sublingual testosterone cyclodextrin formulations using salivary testosterone LC-MS/MS as the primary endpoint.
Experimental Protocol:
- Study Design: Randomized, two-period, two-sequence crossover bioequivalence study in hypogonadal males (N=36).
- Intervention: Single dose of Testosterone Test (T) and Reference (R) products.
- Sample Collection: Salivary samples at -0.5, 0, 0.25, 0.5, 0.75, 1, 1.5, 2, 3, 4, 6, 8, 10, 12, 16, and 24h.
- Sample Analysis: Saliva diluted 1:5 with PBS. 50 µL aliquot spiked with testosterone-d3 IS. Liquid-liquid extraction with methyl tert-butyl ether. LC-MS/MS analysis using a derivatization step (PTAD) to enhance sensitivity.
- Statistical Analysis: ANOVA on log-transformed AUC0-t, AUC0-∞, and Cmax. Bioequivalence declared if 90% confidence intervals (CIs) fall within 80.00-125.00%.
Comparative Data Table: Table 2: Bioequivalence Analysis of Salivary Testosterone Pharmacokinetics.
| Parameter (Geometric Mean) | Test Product (T) | Reference Product (R) | T/R Ratio (%) | 90% CI |
|---|---|---|---|---|
| Cmax (pg/mL) | 285.6 | 275.4 | 103.7 | (98.2 - 109.5) |
| AUC0-t (pg·h/mL) | 2450.2 | 2385.7 | 102.7 | (99.1 - 106.4) |
| AUC0-∞ (pg·h/mL) | 2655.8 | 2588.1 | 102.6 | (99.0 - 106.3) |
Detailed LC-MS/MS Protocol for Salivary Hormone Panel Analysis
Workflow: A standardized protocol for the simultaneous quantification of steroids (cortisol, cortisone, testosterone, DHEA, progesterone, 17-OHP) and melatonin in saliva.
- Materials & Consumables: Polypropylene collection tubes (Sarstedt), 96-well protein precipitation plates (Orochem), 0.2 µm PVDF filter plates (Waters), 2.1 x 100 mm Kinetex C18 column (Phenomenex).
- Internal Standard Solution: Prepare in methanol with deuterated analogs for each analyte.
- Calibrators & QCs: Prepare in charcoal-stripped, artificial saliva.
- Procedure: a. Pre-treatment: Centrifuge native saliva at 10,000 x g for 5 min to remove mucins. b. Protein Precipitation: Pipette 200 µL clarified saliva into a well. Add 300 µL of cold IS solution. Seal, vortex 10 min, incubate at -20°C for 15 min. c. Filtration: Transfer entire content to a 96-well filter plate. Apply positive pressure (5-10 psi) to collect filtrate in a clean 96-well collection plate. d. Chromatography: Column temp: 50°C. Flow: 0.4 mL/min. Mobile Phase A: 0.1% Formic Acid in Water; B: 0.1% Formic Acid in Acetonitrile. Gradient: 15% B to 95% B over 7 min. e. Mass Spectrometry: SCIEX 6500+ QTRAP. ESI+ for steroids, ESI- for melatonin. Scheduled MRM mode.
The Scientist's Toolkit: Research Reagent Solutions for Salivary LC-MS/MS
Table 3: Essential Research Reagents and Materials.
| Item | Example Product/Supplier | Function in Protocol |
|---|---|---|
| Stable Isotope IS Mix | Cerilliant Isotopes | Compensates for matrix effects and variability in extraction/ionization for each analyte. |
| Charcoal-Stripped Saliva | BioIVT or custom-prepared | Provides an analyte-free matrix for preparing calibration standards and quality controls. |
| Derivatization Reagent | PTAD (Pierce) | Enhances ionization efficiency and sensitivity for low-abundance steroids like estradiol. |
| Protein Precipitation Plates | Orochem Finisterre | High-throughput removal of salivary proteins and glycoproteins to protect LC column. |
| HybridSPE-PPT Plates | Supelco (MilliporeSigma) | Combines protein precipitation and phospholipid removal in a single step for cleaner extracts. |
| Phenylboronic Acid Cartridges | Waters Oasis HLB µElution | Selective solid-phase extraction (SPE) for hormones with cis-diol groups (e.g., cortisol). |
Key Signaling Pathways in Hormone Action & Pharmacodynamics
Understanding comparative PK data requires contextualization within pharmacodynamics (PD). The hypothalamic-pituitary-adrenal (HPA) axis is a primary PD target for glucocorticoids.
Comparative data from LC-MS/MS-based salivary hormone analysis provides an unparalleled, non-invasive tool for clinical and pharmacokinetic research. The precision, sensitivity, and multi-analyte capability of this technique enable rigorous head-to-head drug comparisons, detailed PK/PD modeling, and personalized therapeutic monitoring. Integrating these case studies and protocols into a research framework advances the core thesis that salivary biomarkers, accurately quantified by LC-MS/MS, are critical for the future of endocrine and drug development sciences.
This whitepaper details the paradigm shift in salivary hormone analysis driven by High-Resolution Mass Spectrometry (HRMS). Within the broader thesis of LC-MS/MS hormone research, HRMS represents a critical evolution, enabling the simultaneous, precise quantification of a vast array of steroid hormones, peptides, and their metabolites from a single saliva sample. This transition from immunoassays and unit-resolution tandem MS to HRMS is fundamentally expanding the salivary hormone panel, offering unprecedented insights into endocrinology, stress biology, and therapeutic monitoring.
The HRMS Advantage in Salivary Analysis
High-Resolution Mass Spectrometry (e.g., Q-TOF, Orbitrap) provides accurate mass measurements (typically <5 ppm mass error), offering several key benefits for salivary profiling:
- Untargeted and Targeted Analysis: Ability to perform retrospective data mining for compounds not originally targeted.
- Enhanced Selectivity: Superior resolution reduces chemical background and isobaric interferences.
- Expanded Panel Capacity: Simultaneous analysis of dozens to hundreds of analytes without sacrificing sensitivity.
Expanding the Salivary Hormone Panel: Key Analytic Classes
The modern HRMS panel moves beyond traditional steroids like cortisol and DHEA-S.
Table 1: Expanded Salivary Hormone Panel via HRMS
| Analytic Class | Examples of Specific Analytes | Physiological Relevance |
|---|---|---|
| Classical Steroids | Cortisol, Cortisone, DHEA, Testosterone, Progesterone, Estradiol | HPA axis function, stress response, reproductive status |
| 11-Oxyandrogens | 11-Ketotestosterone, 11β-Hydroxytestosterone | Emerging role in PCOS, adrenal hyperactivity |
| Corticosteroid Metabolites | 6β-Hydroxycortisol, Tetrahydrocortisone | CYP3A4 enzyme activity, metabolic clearance |
| Bile Acids | Glycocholic Acid, Taurochenodeoxycholic Acid | Gut-liver axis, circadian markers, metabolic health |
| Eicosanoids | PGE₂, 15-HETE, Resolvin D1 | Inflammation and resolution pathways |
| Peptide Hormones | Insulin, Ghrelin (fragments), Neuropeptides | Requires specialized pre-analytical handling |
Detailed HRMS Experimental Protocol for Salivary Steroid Profiling
Objective: Simultaneous quantification of 30+ steroid hormones and their metabolites in human saliva.
4.1. Sample Collection & Preparation:
- Collection: Use passive drool or synthetic swab kits. Centrifuge (10,000 x g, 10 min, 4°C) to obtain clear saliva.
- Internal Standards: Add a mixture of stable isotope-labeled analogs (e.g., d4-cortisol, 13C3-testosterone) to 500 µL of saliva.
- Liquid-Liquid Extraction: Add 1.5 mL of methyl tert-butyl ether (MTBE), vortex for 2 min, and centrifuge. Transfer organic layer and evaporate to dryness under nitrogen.
- Chemical Derivatization: Reconstitute in 50 µL of methoxyamine hydrochloride in pyridine (20 mg/mL) and incubate (30 min, 60°C) to oximate keto-groups. Add 50 µL of N-methyl-N-trimethylsilyltrifluoroacetamide (MSTFA) with 1% trimethylchlorosilane and incubate (60 min, 60°C) for trimethylsilylation.
4.2. LC-HRMS Analysis:
- LC System: Reverse-phase C18 column (2.1 x 100 mm, 1.7 µm). Mobile Phase A: 0.1% formic acid in water. B: 0.1% formic acid in acetonitrile.
- Gradient: 30% B to 95% B over 15 min, hold 3 min, re-equilibrate.
- HRMS (Orbitrap Exemplar): Full-scan data acquisition (m/z 200-1000) at resolution = 70,000 (at m/z 200). Parallel Reaction Monitoring (PRM) for targeted quantitation at resolution = 35,000.
- Ion Source: Heated Electrospray Ionization (HESI-II) in positive mode.
4.3. Data Processing:
- Quantitation based on extracted ion chromatograms (XICs) using a narrow mass tolerance window (e.g., ±5 ppm).
- Use stable isotope dilution for calibration (linear range: 1-1000 pg/mL for most steroids).
Visualizing Workflows and Pathways
Diagram 1: HRMS Salivary Hormone Analysis Workflow
Title: HRMS Salivary Hormone Analysis Workflow
Diagram 2: Key Steroidogenic Pathways in Saliva
Title: Steroidogenic Pathways Detectable in Saliva
The Scientist's Toolkit: Essential Research Reagent Solutions
Table 2: Key Reagents & Materials for HRMS Salivary Hormone Analysis
| Item | Function & Importance |
|---|---|
| Stable Isotope-Labeled Internal Standards (SIS) | Crucial for accurate quantification via isotope dilution; corrects for matrix effects and losses. |
| Mass Spectrometry-Grade Solvents (ACN, MeOH, MTBE) | Minimize background noise and ion suppression; ensure reproducibility. |
| Derivatization Reagents (MSTFA, MOX) | Enhance volatility and ionization efficiency of steroids, improving sensitivity for HRMS detection. |
| Solid-Phase or Liquid-Liquid Extraction Kits | Purify and concentrate analytes from complex saliva matrix; reduce phospholipid interference. |
| HRMS-Compatible Buffer Salts (Ammonium Formate/Acetate) | Provide volatile buffers for LC separation compatible with ESI-MS. |
| Quality Control Pools (Charcoal-Stripped Saliva Spiked with Analytes) | Monitor inter-assay precision, accuracy, and long-term instrument stability. |
| High-Resolution LC Columns (C18, PFP) | Achieve optimal chromatographic separation of isobaric hormone isomers (e.g., cortisol vs. cortisone). |
| Certified Reference Standard Mixtures | For creating calibration curves to ensure traceable and accurate quantitation across the expanded panel. |
Conclusion
LC-MS/MS has firmly established itself as the gold-standard technology for salivary hormone analysis, offering unparalleled specificity, multiplexing capability, and accuracy essential for rigorous biomedical research and drug development. By mastering the foundational principles, robust methodologies, and rigorous validation outlined, researchers can reliably exploit the non-invasive nature of saliva to gain insights into endocrine function, stress response, and drug pharmacodynamics. Future directions point toward broader hormone panels, increased automation, and the integration of high-resolution mass spectrometry, further solidifying the role of salivary LC-MS/MS in personalized medicine and advanced biomarker discovery. The convergence of this analytical power with saliva's accessibility promises to accelerate research across endocrinology, neuroscience, and therapeutic development.