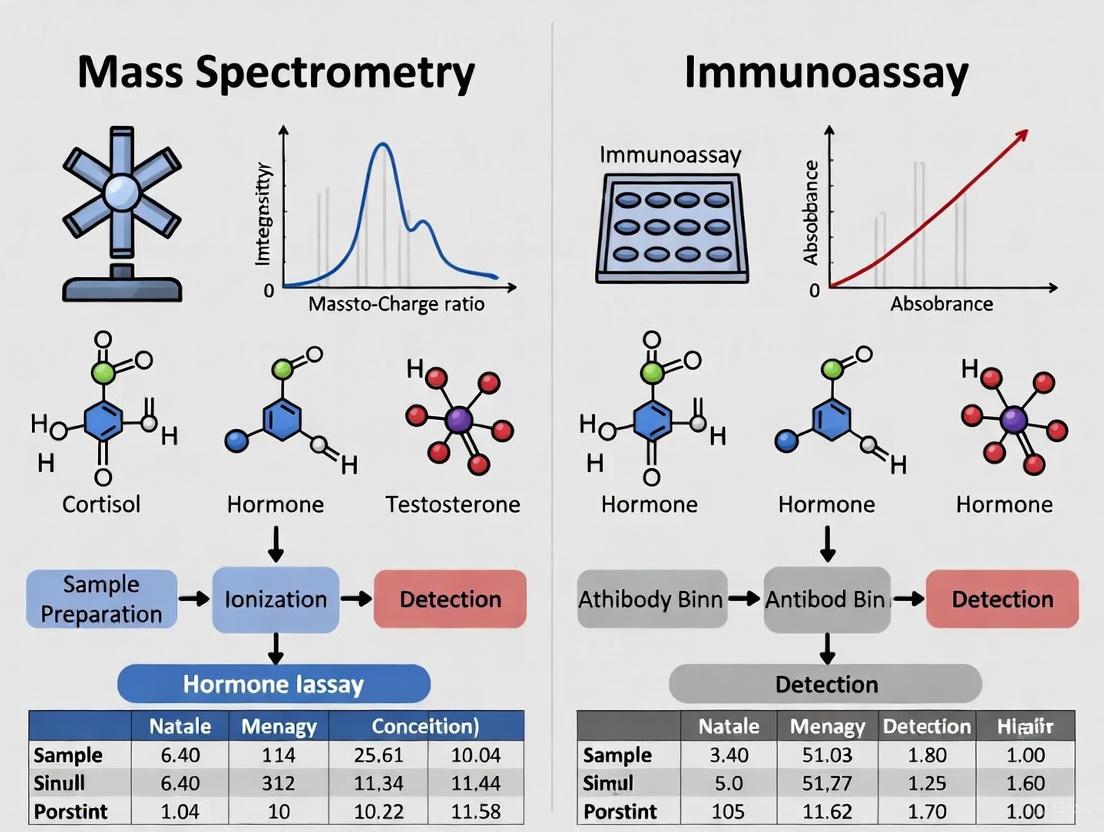
Mass Spectrometry vs. Immunoassay in Endocrinology: A Precision Medicine Showdown
This article provides a comprehensive comparative analysis of mass spectrometry (MS) and immunoassay techniques for endocrine measurements, tailored for researchers, scientists, and drug development professionals.
Mass Spectrometry vs. Immunoassay in Endocrinology: A Precision Medicine Showdown
Abstract
This article provides a comprehensive comparative analysis of mass spectrometry (MS) and immunoassay techniques for endocrine measurements, tailored for researchers, scientists, and drug development professionals. It explores the foundational principles of both platforms, details their specific methodological applications in conditions like diabetes, Cushing's syndrome, and congenital adrenal hyperplasia, and addresses critical challenges in accuracy and standardization. By synthesizing recent validation studies and examining emerging hybrid technologies, the content offers a strategic framework for selecting, optimizing, and validating analytical methods to advance biomarker discovery, therapeutic monitoring, and personalized treatment strategies in endocrine disorders.
Core Principles: Demystifying Immunoassay and Mass Spectrometry Technologies
Immunoassays are powerful biochemical tests that measure the presence or concentration of a macromolecule or small molecule in a solution through the use of an antibody or antigen [1]. Since the development of the first immunoassay in the 1950s by Rosalyn Sussman Yalow and Solomon Berson (earning a Nobel Prize in 1977), these techniques have evolved considerably, becoming fundamental tools in clinical and research laboratories [1] [2]. The exceptional specificity and sensitivity of immunoassays stem from the precise molecular recognition between an antibody and its target antigen [3]. In the context of endocrine research, immunoassays are routinely used to quantify hormones, though an awareness of their limitations compared to mass spectrometry is crucial for accurate interpretation of results, particularly for steroid hormones at low concentrations [4] [5] [2].
This application note provides a comprehensive overview of immunoassay principles, standard workflows, and common formats, with specific consideration for their application in endocrine measurements.
Basic Principles and Key Components
The fundamental principle of any immunoassay is the specific binding between an antibody and its target analyte [1]. This interaction allows for the detection and quantification of the analyte even within complex biological matrices like serum, plasma, or saliva [3]. The key components of an immunoassay system include:
- Antibodies: These can be polyclonal (recognizing multiple epitopes on an antigen) or monoclonal (recognizing a single specific epitope), with the latter offering superior specificity [2].
- Labels: A detectable label is conjugated to an antibody or antigen to generate a measurable signal. Common labels include enzymes (e.g., Horseradish Peroxidase (HRP) or Alkaline Phosphatase (AP)), chemiluminescent compounds (e.g., acridinium ester), fluorescent tags, and radioactive isotopes [6] [1] [7].
- Solid Phase: Many immunoassays are heterogeneous, meaning they require separation of bound and free labels. This is typically achieved by immobilizing the capture antibody on a solid surface, such as the wells of a microtiter plate or magnetic particles [6] [1].
- Calibrators: Solutions with known concentrations of the analyte are used to construct a standard curve, which is essential for converting the signal generated by the sample into a quantitative value [1].
The following diagram illustrates the core logical relationship and workflow of a generic immunoassay, from reagent preparation to data analysis.
Common Immunoassay Formats
Immunoassays are broadly classified based on their design and whether the analyte competes for binding or is captured in a sandwich complex. The choice of format is often dictated by the size of the analyte.
Competitive Immunoassays
Competitive immunoassays are typically used for measuring small molecules (haptens), such as steroid hormones (estradiol, testosterone, cortisol) and thyroid hormones, because these molecules are too small to be bound by two antibodies simultaneously [2] [3]. In this format, the analyte in the patient sample competes with a labeled version of the analyte (the tracer) for a limited number of antibody-binding sites [6] [2]. The amount of tracer that binds to the antibody is inversely proportional to the concentration of the analyte in the sample. Common types include competitive Enzyme-Linked Immunosorbent Assay (ELISA) and Cloned Enzyme Donor Immunoassay (CEDIA) [1].
Immunometric (Sandwich) Assays
Sandwich immunoassays are used for larger molecules that have multiple antigenic epitopes, such as protein hormones (e.g., parathyroid hormone, insulin), cytokines, and antibodies themselves [2] [3]. This format requires two antibodies that bind to different epitopes on the target analyte. One antibody is immobilized on a solid phase and acts as the capture antibody. The second antibody is labeled and serves as the detection antibody. The analyte is "sandwiched" between the two, and the signal generated is directly proportional to the analyte concentration [3]. This format generally offers higher specificity and sensitivity than competitive assays [3].
The following diagram provides a visual comparison of these two fundamental formats.
Comparison of Common Formats: ELISA and CLIA
While both ELISA and Chemiluminescent Immunoassay (CLIA) can be configured in competitive or sandwich formats, they differ significantly in their detection method and performance characteristics. CLIA uses a chemical reaction that produces light (chemiluminescence) as its readout, whereas traditional colorimetric ELISA relies on an enzyme converting a substrate to a colored product, which is measured by absorbance [7] [8].
Table 1: Comparison of ELISA and CLIA Performance Characteristics [8]
| Parameter | ELISA (Colorimetric) | CLIA |
|---|---|---|
| Detection Principle | Color change (Absorbance) | Light emission (Luminescence) |
| Sensitivity | Lower | Higher |
| Dynamic Range | Narrower | Wider |
| Assay Speed | Slower (time-consuming) | Faster (rapid) |
| Throughput | Moderate | High |
| Cost | Lower | Higher (instrumentation & reagents) |
| Signal Measurement | Optical Density (OD) | Relative Light Units (RLU) |
Detailed Experimental Protocol: Sandwich Chemiluminescent Immunoassay (CLIA)
The following protocol details the steps for a sandwich CLIA, a common and sensitive format used for quantifying proteins and large biomolecules in endocrine research (e.g., growth hormones, IGF-1) [7].
Reagent Preparation
- Coating Buffer: 50 mM sodium bicarbonate, pH 9.6, or PBS, pH 8.0 [6].
- Wash Buffer: PBS or Tris-buffered saline (TBS) with 0.05% Tween-20 (PBST/TBST) [6].
- Blocking Buffer: 1% BSA or 10% host serum in TBS, or commercial protein-based blockers (e.g., Casein) [6].
- Antibody Diluent: Blocking buffer or 1% BSA in PBS/TBS [6].
- Standards: Prepare a dilution series of the purified analyte in the matrix that matches the sample (e.g., hormone-free serum) [6].
- Chemiluminescent Substrate: Ready-to-use luminol-based or similar substrate for HRP [7].
Step-by-Step Workflow
- Coating: Add the capture antibody, diluted in coating buffer, to each well of a 96-well microtiter plate. Seal the plate and incubate overnight at 2-8°C [6] [7].
- Washing: Aspirate the coating solution and wash the plate 3 times with Wash Buffer (e.g., >300 µL per well per wash) to remove unbound antibody [6] [7].
- Blocking: Add Blocking Buffer to each well (e.g., 300 µL) to cover all remaining protein-binding sites. Incubate for 1-2 hours at room temperature. Wash as in Step 2 [6] [7].
- Sample and Standard Incubation: Add standards, controls, and test samples to the assigned wells. Incubate for a specified time (e.g., 2 hours at room temperature) to allow the analyte to bind to the capture antibody. Wash thoroughly to remove unbound substances [6] [7].
- Detection Antibody Incubation: Add the biotin-conjugated detection antibody to each well. Incubate for a specified time (e.g., 1-2 hours at room temperature). Wash to remove excess, unbound detection antibody [7].
- Enzyme Conjugate Incubation: Add the Avidin-Horseradish Peroxidase (Avidin-HRP) conjugate. Incubate for a defined period (e.g., 45-60 minutes at room temperature). The avidin binds tightly to the biotin on the detection antibody. Perform a final wash step to remove unbound conjugate [7].
- Signal Generation: Add the chemiluminescent substrate solution to each well. The HRP enzyme catalyzes a reaction that produces light. Measure the Relative Light Units (RLU) using a luminometer [7].
Data Analysis
- Generate a standard curve by plotting the RLU of the standards against their known concentrations.
- Use a non-linear regression curve-fitting model (e.g., 4- or 5-parameter logistic) to fit the data [6].
- Interpolate the concentration of unknown samples from the standard curve.
The Scientist's Toolkit: Key Research Reagent Solutions
Successful immunoassay development and implementation depend on high-quality, specific reagents. The following table outlines essential materials and their functions.
Table 2: Essential Reagents for Immunoassay Development [6] [7] [2]
| Reagent Category | Specific Examples | Function & Importance |
|---|---|---|
| Solid Phase | Greiner high-binding plates, Nunc plates, magnetic microparticles | Provides a surface for immobilizing the capture antibody or antigen, facilitating separation of bound and free fractions. |
| Antibodies | Matched antibody pairs (for sandwich IA), affinity-purified polyclonal or monoclonal antibodies | The core recognition element that defines assay specificity. Affinity-purified antibodies reduce background and improve performance. |
| Blocking Reagents | 1% BSA, 10% host serum, Casein, commercial protein-free blockers | Coats unused protein-binding sites on the solid phase to minimize non-specific binding and reduce background signal. |
| Detection Labels | Horseradish Peroxidase (HRP), Alkaline Phosphatase (AP), Acridinium Ester | Conjugated to antibodies or antigens to generate a measurable signal (color, light, fluorescence). |
| Substrates | TMB (colorimetric), Luminol (chemiluminescent), pNPP (colorimetric) | Converted by the enzyme label to produce a detectable product. Choice of substrate impacts sensitivity and dynamic range. |
| Separation Systems | Biotin-Streptavidin, anti-species secondary antibodies | Used to separate the antibody-bound label from the free label, a critical step in heterogeneous immunoassays. |
Immunoassay Interference and Limitations in Endocrine Research
Despite their utility, immunoassays are susceptible to various interferences that can lead to inaccurate results, a critical consideration for endocrine research [2].
- Cross-Reactivity: Antibodies may bind to structurally similar molecules, such as hormone metabolites or precursors (e.g., cross-reaction of testosterone assay with dihydrotestosterone). This is a significant issue for competitive steroid hormone immunoassays and can lead to overestimation of the true analyte concentration [2] [3].
- Heterophile Antibodies: Endogenous human antibodies that can bind to animal immunoglobulins used in the assay (e.g., Human Anti-Mouse Antibodies or HAMAs). These can cause false-positive or false-negative results by cross-linking capture and detection antibodies in the absence of the analyte [2].
- Biotin Interference: High endogenous levels or supplemental biotin can interfere with assays using a biotin-streptavidin separation system, leading to falsely low results in sandwich assays and falsely high results in competitive assays [2].
- Matrix Effects: Components of the sample matrix (e.g., lipids, hemoglobin, bilirubin, proteins) can non-specifically modulate the antigen-antibody reaction or the signal generation, affecting accuracy [6] [2].
Specific Example in Endocrine Research: A landmark study comparing immunoassay and mass spectrometry (MS) for serum estradiol (E2) measurement in men found that immunoassay E2 levels, but not MS E2 levels, showed a significant positive association with C-reactive protein (CRP) levels [4]. This suggests that CRP or a CRP-associated factor interferes with the immunoassay, potentially confounding studies investigating the relationship between E2 and inflammation-related outcomes like cardiovascular disease [4]. A more recent 2025 study on salivary sex hormones also concluded that ELISA showed poor performance for measuring estradiol and progesterone compared to LC-MS/MS, which was superior despite being more challenging [5] [9].
Immunoassays, including ELISA and CLIA, are versatile, sensitive, and widely used tools for quantifying hormones and other analytes in endocrine research and clinical diagnostics. Understanding the fundamental principles, workflows, and formats (competitive vs. sandwich) is essential for selecting the appropriate assay and interpreting results correctly. However, researchers must be cognizant of the potential for analytical interference, particularly when measuring steroid hormones at low concentrations or in complex matrices. For such applications, mass spectrometry remains the gold standard due to its superior specificity [4] [5]. Therefore, while immunoassays are a powerful component of the scientist's toolkit, their results, especially when clinically discordant, should be interpreted with caution and confirmed with more specific methods when necessary.
Liquid Chromatography-Tandem Mass Spectrometry (LC-MS/MS) is a cornerstone analytical technique that combines the superior separation power of liquid chromatography with the high sensitivity and specificity of tandem mass spectrometry. In the context of endocrine analysis, this technique provides a critical advantage over traditional immunoassays by enabling the precise measurement of hormones and other biomarkers with minimal cross-reactivity interference [10]. The workflow encompasses sample preparation, chromatographic separation, ionization, mass analysis, and data processing, each step contributing to the method's overall selectivity and accuracy. This application note details the fundamental protocols and technical considerations for implementing a robust LC-MS/MS workflow, providing a framework for researchers in drug development and clinical research.
Experimental Protocols
Sample Preparation Methodology
Proper sample preparation is paramount for removing interfering matrix components and concentrating the analyte to enhance sensitivity.
Protocol for Plasma/Serum Sample Cleanup (Liquid-Liquid Extraction): The following protocol, adapted from a validated method for quantifying small molecules in human plasma, is designed for a 1.0 mL sample aliquot [11].
- Aliquot and Spike: Pipette 1.0 mL of plasma into a glass centrifuge tube. Spike with an appropriate volume of internal standard (IS) solution.
- Extract: Add 3.0 mL of organic extraction solvent (e.g., toluene or methyl tert-butyl ether) to the tube.
- Vortex and Centrifuge: Vortex-mix vigorously for 10 minutes. Centrifuge at 4,000 × g for 10 minutes at room temperature to separate the phases.
- Transfer and Evaporate: Transfer the upper organic layer to a clean tube. Evaporate to dryness under a gentle stream of nitrogen gas in a water bath at 40°C.
- Reconstitute: Reconstitute the dry residue in 150 µL of initial mobile phase (e.g., 70% methanol in water). Vortex for 30 seconds and transfer to an autosampler vial for analysis [11].
Protocol for Solid-Phase Extraction (SPE): SPE is ideal for complex matrices and can be automated for high-throughput environments [12].
- Condition: Condition a reversed-phase C18 SPE cartridge with 3 mL of methanol followed by 3 mL of water.
- Load: Load the prepared sample (e.g., urine or digested protein sample) onto the cartridge.
- Wash: Wash with 3 mL of a mild aqueous wash solution (e.g., 5% methanol) to remove impurities.
- Elute: Elute the analyte(s) with 2 × 1 mL aliquots of a strong organic solvent (e.g., 90% methanol with 0.1% formic acid).
- Evaporate and Reconstitute: Evaporate the eluent under nitrogen and reconstitute in a compatible mobile phase for LC-MS/MS analysis.
Liquid Chromatography (LC) Separation
The LC system separates the complex mixture, reducing matrix effects and isolating analytes in time before they enter the mass spectrometer.
- Column: Utilize a reversed-phase column, such as a Waters XSelect HSS T3 (2.1 mm × 100 mm, 2.5 µm), for small molecules and peptides [11] [13].
- Mobile Phase: A binary system is standard.
- Mobile Phase A: Water with 0.1% formic acid.
- Mobile Phase B: Methanol or Acetonitrile with 0.1% formic acid.
- Gradient Elution: Perform separation using a gradient. For a 4-minute method, an isocratic or shallow gradient can be used (e.g., 70% B) [11]. For deeper proteomic profiling, a longer, steeper gradient is required (e.g., 5% B to 95% B over 60-120 minutes) [13].
- Flow Rate and Temperature: A flow rate of 0.500 mL/min for analytical columns and column temperature of 40°C are typical [11].
Ionization and Mass Spectrometry (MS) Detection
This stage ionizes the separated analytes and detects them based on their mass-to-charge ratio (m/z).
- Ionization Source: Electrospray Ionization (ESI) is the most common technique, particularly for polar molecules and biologics. It operates at atmospheric pressure and is well-suited for coupling with LC [14].
- Mass Analyzer Configuration: A triple quadrupole (QQQ) mass spectrometer is the gold standard for targeted, quantitative analysis [14] [11].
- Quadrupole 1 (Q1): Selects the precursor ion of the target analyte.
- Quadrupole 2 (Q2): Acts as a collision cell, fragmenting the precursor ion using an inert gas like argon or nitrogen.
- Quadrupole 3 (Q3): Selects a specific product ion from the fragments.
- Data Acquisition: The instrument is operated in Multiple Reaction Monitoring (MRM) mode. This mode monitors specific transitions from a precursor ion to a product ion for each analyte and internal standard, providing the highest level of specificity and sensitivity for quantification [11].
Data Analysis and Interpretation
Raw data from the mass spectrometer is processed to identify and quantify the target analytes.
- Peak Integration: The software integrates the chromatographic peak area for each MRM transition.
- Quantification: The peak area ratio (Analyte / Internal Standard) is calculated. This ratio is plotted against the known concentration of calibration standards to create a linear calibration curve. The concentration of the analyte in unknown samples is determined by interpolating their peak area ratios from this curve [11].
- Quality Control: Quality Control (QC) samples at low, medium, and high concentrations are analyzed alongside unknowns to ensure the analytical run remains within predefined accuracy and precision limits.
Essential Research Reagent Solutions
The following table details key reagents and materials required for a successful LC-MS/MS analysis.
Table 1: Key Research Reagents and Materials for LC-MS/MS Analysis
| Item | Function / Explanation | Example |
|---|---|---|
| Internal Standard (IS) | Corrects for variability in sample preparation and ionization; typically a stable isotope-labeled version of the analyte. | d3-Cortisol, 13C-ISRIB [11] |
| Extraction Solvents | For liquid-liquid extraction; precipitates proteins and extracts the analyte from the biological matrix. | Toluene, Methyl tert-butyl ether (MTBE) [11] |
| SPE Cartridges | For solid-phase extraction; selectively binds analytes for cleanup and concentration. | Reversed-Phase C18, Weak Anion Exchange (WAX) [12] |
| LC Mobile Phase Additives | Modifies pH and promotes efficient ionization in the ESI source; improves chromatographic peak shape. | Formic Acid, Acetic Acid, Ammonium Formate [11] [13] |
| Digestion Enzyme | In proteomics, cleaves proteins into predictable peptides for "bottom-up" analysis. | Trypsin (specific for lysine/arginine) [13] |
| Reducing/Alkylating Agents | In proteomics, breaks disulfide bonds and prevents reformation to ensure complete digestion. | Dithiothreitol (DTT)/Tris(2-carboxyethyl)phosphine (TCEP) and Iodoacetamide [13] |
Performance Characteristics and Method Validation
A rigorously validated LC-MS/MS method ensures the reliability, reproducibility, and robustness of the generated data. The following table summarizes key validation parameters and typical results based on regulatory guidelines [11].
Table 2: Representative LC-MS/MS Method Validation Data for Quantitative Bioanalysis
| Validation Parameter | Acceptance Criteria | Exemplary Data from trans-ISRIB Assay [11] |
|---|---|---|
| Linearity & Calibration Range | R² > 0.99 | 0.500 - 1,000 nM (Over 3 orders of magnitude) |
| Accuracy | 85-115% of nominal value | Within ± 15% at LLOQ; Within ± 10% at other QCs |
| Precision (Repeatability) | CV < 15% (≤ 20% at LLOQ) | CV < 9.6% across all QC levels |
| Lower Limit of Quantification (LLOQ) | Signal-to-noise ≥ 5 | 0.500 nM |
| Recovery (Extraction Efficiency) | Consistent and reproducible | High recovery reported with toluene extraction |
| Carryover | < 20% of LLOQ | Not specified, but typically minimized by needle wash |
LC-MS/MS vs. Immunoassay in Endocrine Research
The choice between LC-MS/MS and immunoassay for endocrine measurements is critical and depends on the specific application requirements. The table below contrasts the two methodologies.
Table 3: Comparison of LC-MS/MS and Immunoassay for Endocrine Measurements
| Parameter | LC-MS/MS | Immunoassay |
|---|---|---|
| Specificity | High; measures exact mass and fragmentation pattern, minimizing cross-reactivity [10]. | Moderate to Low; susceptible to cross-reactivity from structurally similar compounds [10]. |
| Sensitivity | High to Ultra-high (fg-pg level); continually improving with instrumentation [14]. | High; can be excellent for specific antigens. |
| Multiplexing Capability | High; can monitor dozens of analytes simultaneously in a single run (MRM). | Limited; typically requires multiple, separate assays. |
| Throughput | Moderate to High; run times of 2-10 minutes are common [11]. | Very High; suitable for 96/384-well plate formats. |
| Development Time & Cost | Longer method development; higher initial capital cost. | Faster setup; lower initial instrument cost. |
| Dynamic Range | Wide (3-4 orders of magnitude) [11]. | Limited (2-3 orders of magnitude). |
| Ability to Distinguish Isobars | Yes; based on chromatographic separation and unique fragmentation. | No; may report them as a single entity. |
The LC-MS/MS workflow represents a powerful and versatile platform for quantitative bioanalysis, offering unparalleled specificity, sensitivity, and multiplexing capabilities. Its ability to accurately measure multiple endocrine biomarkers without antibody cross-reactivity makes it an indispensable tool in modern pharmaceutical research and development. While immunoassays remain valuable for high-throughput screening of single analytes, LC-MS/MS is the definitive technique for method-dependent studies, complex matrices, and situations where the highest level of analytical confidence is required. As the technology continues to advance with greater automation, improved data processing platforms, and enhanced sensitivity, its role in driving innovations in drug discovery and personalized medicine will only expand [15].
The choice of analytical platform is fundamental to the success of endocrine research and drug development. While immunoassays have been a long-standing cornerstone for hormone measurement, mass spectrometry (MS) has emerged as a powerful technology that offers distinct performance advantages. For researchers and scientists engaged in endocrine measurements, understanding the core performance metrics of these platforms is crucial for designing robust experiments, generating reliable data, and making informed decisions in diagnostic and therapeutic development. This application note provides a detailed, evidence-based comparison of the sensitivity, specificity, and multiplexing capabilities of mass spectrometry and immunoassays, framed within the context of endocrine research. Furthermore, it presents standardized protocols to guide the implementation of these technologies in laboratory settings.
Comparative Performance Metrics: MS vs. Immunoassay
The following table summarizes the key performance characteristics of mass spectrometry and immunoassays, synthesizing data from recent comparative studies across various endocrine applications.
Table 1: Comparative Performance of Mass Spectrometry and Immunoassays for Endocrine Measurements
| Performance Metric | Mass Spectrometry (LC-MS/MS) | Traditional Immunoassay | Supporting Evidence |
|---|---|---|---|
| Sensitivity | Attomolar (aM) to femtomolar (fM) level demonstrated in advanced platforms; suitable for low-abundance biomarkers [16]. | Typically picomolar (pM) level; may be inadequate for low-concentration analytes in post-menopausal women and men [4]. | LC-MS/MS showed 10-fold lower LOD for HIV p24 than SIMOA (a sensitive IA); 22 aM LOD for IL6 [16]. |
| Specificity | High; distinguishes structurally similar steroids and isoforms based on mass and fragmentation patterns [17] [18]. | Moderate; susceptible to cross-reactivity with homologous compounds, metabolites, and interfering proteins [4] [17]. | Immunoassay E2 correlated with CRP levels (rS=0.29), suggesting interference; no such correlation with MS E2 [4]. |
| Multiplexing Capability | High; can simultaneously quantify dozens of analytes in a single run (e.g., 200-plex panel) [16] [18]. | Low to Moderate; limited by spectral overlap of labels; typically single-plex or low-plex [19]. | NULISAseq achieved 200-plex quantification with attomolar sensitivity without significant loss in performance [16]. |
| Dynamic Range | Wide; 7-log dynamic range or greater [16]. | Narrow; typically 3-4 logs [16]. | NULISA demonstrated a >7-log dynamic range for IL4 and p24, compared to ~4 logs for SIMOA [16]. |
| Reference Method Status | Often cited as the "gold standard" or reference method for steroid hormones like estradiol (E2) and cortisol [4] [20]. | Used routinely but requires validation against MS when high specificity is critical [4] [9]. | LC-MS/MS is recommended by Endocrine Society for CAH management over immunoassays due to superior specificity [17]. |
Experimental Protocols for Endocrine Biomarker Analysis
Protocol 1: Liquid Chromatography-Tandem Mass Spectrometry (LC-MS/MS) for Steroid Hormones
This protocol outlines a standardized workflow for the quantification of steroid hormones (e.g., cortisol, estradiol, testosterone) in serum or plasma using LC-MS/MS, consistent with methodologies described across multiple studies [4] [20] [21].
1. Sample Preparation:
- Protein Precipitation: Add 200 µL of internal standard solution (e.g., cortisol-d4 for cortisol assays) to 200 µL of serum or plasma.
- Vortex and Centrifuge: Mix thoroughly and centrifuge at high speed (e.g., 13,000 × g) for 10 minutes to pellet proteins.
- Supernatant Collection: Transfer the clear supernatant to a clean vial for analysis.
2. Liquid Chromatography (LC):
- Column: Use a reversed-phase C8 or C18 column (e.g., 2.1 × 100 mm, 1.7 µm).
- Mobile Phase: Employ a binary gradient system. Mobile phase A: Water with 0.1% formic acid. Mobile phase B: Methanol or acetonitrile with 0.1% formic acid.
- Gradient Elution: Implement a linear gradient from 30% B to 95% B over 5-10 minutes, with a total run time of 12-15 minutes.
- Injection Volume: 10 µL.
3. Tandem Mass Spectrometry (MS/MS) Detection:
- Ionization Mode: Electrospray Ionization (ESI), positive mode.
- Data Acquisition: Multiple Reaction Monitoring (MRM).
- MS Parameters:
- For Cortisol: Monitor transition m/z 363.2 → 121.0 (quantifier) and 363.2 → 327.0 (qualifier).
- For Estradiol: Monitor specific transitions optimized for the instrument.
- Use a minimum of two transitions per analyte for confident identification.
4. Data Analysis:
- Quantify analytes by comparing the peak area ratio of the analyte to the internal standard against a calibration curve prepared in a matching matrix.
The workflow for this protocol is illustrated below.
Protocol 2: Immunoassay for Urinary Free Cortisol (UFC)
This protocol describes the procedure for measuring Urinary Free Cortisol using a direct (extraction-free) chemiluminescence immunoassay, as evaluated in recent comparative studies [20].
1. Sample Pre-treatment:
- Collect 24-hour urine in a container without preservatives. Mix the total urine collection thoroughly.
- Centrifuge a urine aliquot at 2000 × g for 10 minutes to remove any particulate matter. Use the supernatant for the assay.
2. Assay Procedure:
- Automated Platform: Use an automated chemiluminescence immunoanalyzer (e.g., Mindray CL-1200i, Roche e801).
- Calibration: Load the instrument with manufacturer-provided calibrators.
- Quality Control: Include at least two levels of quality control (QC) materials in each run.
- Sample Loading: Pipette the prepared urine samples (and controls) into designated sample cups.
- Automated Analysis: The instrument automatically performs the following steps: a. Incubation: Combines the sample with anti-cortisol antibody conjugated to a chemiluminescent label. b. Separation: Uses magnetic particles or other solid phase to separate bound from free analyte. c. Washing: Washes the complex to remove unbound materials. d. Signal Detection: Triggers the chemiluminescent reaction and measures the emitted light, which is inversely proportional to the cortisol concentration.
3. Data Analysis:
- The analyzer software calculates the concentration of UFC in each sample (nmol/24 hours) based on the established calibration curve.
The Scientist's Toolkit: Essential Research Reagents and Materials
Successful implementation of the protocols above requires specific, high-quality reagents and materials. The following table details key components for LC-MS/MS-based endocrine analysis.
Table 2: Key Research Reagent Solutions for LC-MS/MS Endocrine Analysis
| Reagent/Material | Function | Application Example |
|---|---|---|
| Stable Isotope Labeled Internal Standards (SIS) | Corrects for analyte loss during preparation and ion suppression/enhancement during MS analysis; enables absolute quantification [22] [18]. | Cortisol-d4 for cortisol quantification; Estradiol-d5 for estradiol assays. |
| Solid-Phase Extraction (SPE) Cartridges | Purifies and pre-concentrates target analytes from complex biological matrices (e.g., serum, urine), reducing ion suppression and improving sensitivity [22]. | Mixed-mode cation-exchange cartridges for extraction of steroid hormones from urine prior to LC-MS/MS. |
| Tryptic Digestion Enzymes | Cleaves proteins into peptides for bottom-up proteomics and for the analysis of protein biomarkers (e.g., Thyroglobulin) [22]. | Sequencing-grade modified trypsin for digesting HCPs (Host Cell Proteins) in biopharmaceutical analysis [23]. |
| Anti-Peptide Antibodies | Enriches specific, low-abundance peptide analytes from complex digests to significantly improve detection sensitivity in targeted MS assays [19]. | Used in SISCAPA (Stable Isotope Standards and Capture by Anti-Peptide Antibodies) workflows for biomarker validation [19]. |
| High-Purity Solvents & Buffers | Ensures minimal background interference, maintains LC column performance, and provides consistent MS ionization efficiency. | LC-MS grade water, methanol, and acetonitrile; mass spectrometry-compatible ammonium bicarbonate buffer. |
The data and protocols presented herein demonstrate that mass spectrometry and immunoassays each occupy a distinct space in the endocrine researcher's arsenal. Immunoassays offer scalability and operational simplicity for high-throughput, single-analyte tests. However, for applications demanding high specificity, sensitivity for low-abundance analytes, or the ability to profile multiple analytes simultaneously, LC-MS/MS is the unequivocally superior technology. The integration of advanced techniques like immunoaffinity enrichment with MS detection further pushes the boundaries of sensitivity and multiplexing. As the field of endocrinology and drug development continues to evolve towards more precise and personalized medicine, the selection of an analytical platform based on rigorously defined performance metrics will be paramount to generating high-quality, clinically translatable data.
The Unique Advantage of Isotope Dilution Mass Spectrometry (IDMS) for Quantification
Accurate quantification of steroid hormones is fundamental to the diagnosis and treatment of endocrine disorders. For decades, immunoassays served as the primary analytical method in clinical endocrinology due to their rapid turnaround and automation capabilities. However, these methods demonstrate considerable limitations, particularly at low hormone concentrations found in females, children, and postmenopausal individuals [24] [25]. Cross-reactivity with structurally similar compounds frequently leads to overestimation of true analyte concentrations, while a narrow linear range can restrict clinical utility [26] [25].
The introduction of mass spectrometry (MS) to clinical laboratories addressed several limitations of immunoassays, offering superior specificity and sensitivity. Among MS techniques, Isotope Dilution Mass Spectrometry (IDMS) has emerged as the reference method for achieving the highest order of accuracy and precision [24] [27]. By employing stable isotope-labeled analogs of target analytes as internal standards, IDMS effectively corrects for analyte loss during sample preparation and minimizes matrix effects during ionization, establishing a foundation for traceability in hormone measurements [24] [27] [28].
This application note details the unique advantages of IDMS for endocrine measurements, providing validated protocols and performance data to guide researchers and drug development professionals in implementing this gold-standard methodology.
Principles and Advantages of IDMS
Fundamental Mechanism of Isotope Dilution
The core principle of IDMS involves adding a known quantity of a stable isotope-labeled internal standard (e.g., deuterated or 13C-labeled analyte) to each sample, calibrator, and quality control material at the initial stage of sample preparation [24]. This labeled analog possesses nearly identical chemical and physical properties to the native analyte, ensuring it experiences virtually the same extraction efficiency, chromatographic behavior, and ionization characteristics. The critical distinction lies in its different mass-to-charge ratio (m/z), allowing the mass spectrometer to differentiate and quantify the native and labeled species simultaneously [24].
The quantitative power of this approach stems from its ability to correct for both pre-analytical and analytical variables. Any losses of the native analyte during complex sample clean-up procedures are matched by proportional losses of the isotope-labeled standard, thereby preserving the original concentration ratio. Furthermore, during the ionization process in the mass spectrometer source, where co-eluting matrix components can suppress or enhance the analyte signal (a phenomenon known as matrix effect), the internal standard experiences the same suppression/enhancement, enabling accurate correction [26] [29].
Key Advantages Over Conventional Methods
The IDMS technique confers several distinct advantages that make it particularly suitable for endocrine measurements:
Unmatched Accuracy and Precision: ID-MS has been recommended as a reference measurement procedure by authoritative bodies and forms the basis for standardization programs, such as the CDC Steroid Hormones Standardization (HoSt) program [24] [27] [25]. The precision is exemplified by intra- and inter-assay coefficients of variation for testosterone quantification reported as low as 2.13% and 3.44%, respectively [24].
Superior Performance at Low Concentrations: IDMS methods maintain excellent accuracy and precision even at low physiological concentrations where immunoassays falter, such as measuring estradiol in postmenopausal women or testosterone in females and children [24] [27] [25].
Correction for Matrix Effects: The isotope-labeled standard compensates for ion suppression/enhancement in the mass spectrometer source, a common challenge in LC-MS/MS analysis of complex biological matrices like serum and plasma [26] [29].
The following diagram illustrates the logical workflow and core principle of IDMS, highlighting how the isotope-labeled internal standard corrects for variability throughout the analytical process.
IDMS in Practice: Application Protocols
Protocol: Determination of Serum Testosterone by ID-UPLC-MS/MS
The following detailed protocol for quantifying human serum testosterone, adapted from a validated method, demonstrates a robust IDMS application [24].
Research Reagent Solutions
Table 1: Essential Reagents and Materials for Serum Testosterone ID-UPLC-MS/MS
| Reagent/Material | Specification | Function/Purpose |
|---|---|---|
| Testosterone Standard | ≥99.6% purity (CRM) | Primary unlabeled analyte for calibration |
| d3-Testosterone (T-D3) | Isotopic purity ≥99.37% | Isotope-labeled Internal Standard (IS) |
| Methanol, Acetonitrile | HPLC Grade | Solvent for stock solutions & mobile phase |
| Ethyl Acetate/n-Hexane | HPLC Grade | Organic solvents for liquid-liquid extraction |
| Ammonium Acetate Buffer | 0.5 mol/L, pH 5.5 | Acidic buffer to release hormone from binding proteins |
| Sodium Carbonate Buffer | 0.2 mol/L, pH 9.8 | Basic buffer for back-extraction to remove polar impurities |
| UPLC-MS/MS System | e.g., Waters Xevo TQ-XS with UPLC I-Class PLUS | Instrumentation for separation and detection |
| UPLC Column | ACQUITY UPLC BEH C18 (2.1×100 mm, 1.7 µm) | Stationary phase for chromatographic separation |
Experimental Workflow
Calibrator and Internal Standard Preparation:
- Prepare a primary stock solution (PSS) of testosterone in anhydrous methanol at 1.00 mg/mL.
- Serially dilute the PSS with methanol to create calibrators covering the expected physiological range (e.g., 1.00 to 1,000.00 ng/dL).
- Prepare the internal standard working solution (d3-Testosterone) in methanol at 1,000.00 ng/dL.
Sample Preparation (Dual Liquid-Liquid Extraction):
- Pipette 100 µL of serum sample (calibrators, QCs, and patient samples) into a tube.
- Add 100 µL of the IS working solution to each tube and mix for 15 minutes at room temperature.
- Add 100 µL of 0.5 mol/L ammonium acetate buffer (pH 5.5) and mix for 2 hours to release testosterone from its binding proteins.
- Perform the first LLE: Add 500 µL of an ethyl acetate/n-hexane solution (3:2, v/v), vortex mix, and centrifuge. Transfer the organic layer. Repeat this step and combine the organic extracts.
- Evaporate the combined organic extracts to dryness under a gentle stream of nitrogen.
- Reconstitute the dry residue in 200 µL of 0.2 mol/L sodium carbonate buffer (pH 9.8).
- Perform the second LLE: Add 500 µL of n-hexane, vortex mix, and centrifuge. Transfer the organic (n-hexane) layer. Repeat and combine the layers. This step removes polar impurities.
- Evaporate the combined n-hexane layers to dryness and reconstitute in 100 µL of methanol for UPLC-MS/MS analysis.
UPLC-MS/MS Analysis:
- Chromatography: Use an ACQUITY UPLC BEH C18 column maintained at 40°C. Employ a gradient elution with 0.1% formic acid in water (Mobile Phase A) and acetonitrile (Mobile Phase B) at a flow rate of 0.4 mL/min.
- Mass Spectrometry: Operate the mass spectrometer in positive electrospray ionization (ESI+) mode and Multiple Reaction Monitoring (MRM). Monitor specific ion transitions for testosterone (m/z 289.2→97.0 and 289.2→108.9) and the IS d3-Testosterone (m/z 292.2→97.0). Optimize cone and collision energies for each transition.
The sample preparation workflow, involving the dual liquid-liquid extraction for optimal purification, is visualized below.
Advanced Application: Candidate Reference Method for Serum 17β-Estradiol
The need for high sensitivity IDMS is exemplified by methods developed for 17β-estradiol (E2), which must measure concentrations spanning four orders of magnitude (e.g., from postmenopausal to late pregnancy levels) [27]. A recent candidate reference measurement procedure addresses this challenge by employing two separate methods:
- A High Sensitivity (HS) Method (0.400–5.00 pg/mL) uses liquid-liquid extraction followed by chemical derivatization to enhance detection sensitivity.
- A Standard Range (SR) Method (5.00–5,000 pg/mL) utilizes a supported liquid extraction (SLE) protocol [27].
Both methods use a two-dimensional heart-cut LC approach for superior separation and confirm the method's trueness through the CDC HoSt program, demonstrating biases within -2.4% to 1.9% for the SR method and -3.0% to 2.9% for the HS method [27]. This highlights the adaptability of IDMS protocols to meet specific analytical challenges.
Performance Data and Comparison with Other Methods
Quantitative Performance of IDMS Methods
The rigorous validation data generated for IDMS methods underscores their suitability as reference methods for endocrine quantification.
Table 2: Analytical Performance Metrics of IDMS Methods for Steroid Hormone Quantification
| Analyte (Matrix) | Linear Range | Precision (CV%) | Accuracy (Recovery %) | Limit of Detection | Key Advantage Demonstrated |
|---|---|---|---|---|---|
| Testosterone (Serum) [24] | 1.00 – 1,000.00 ng/dL | Intra-assay: 1.40–2.77% | 94.32 – 108.60% | 0.50 ng/dL | High precision and accuracy across a wide range, suitable for all patient groups. |
| 17β-Estradiol (Serum) - SR Method [27] | 5.00 – 5,000 pg/mL | n/a | Mean Bias: -2.4 to 1.9% | n/a | Low bias and high-order trueness, suitable for standardization. |
| 17β-Estradiol (Serum) - HS Method [27] | 0.400 – 5.00 pg/mL | n/a | Mean Bias: -3.0 to 2.9% | n/a | Maintained accuracy at ultralow, clinically challenging concentrations. |
Comparative Analysis: IDMS vs. Immunoassay and Traditional LC-MS/MS
The limitations of conventional methods become apparent when compared to IDMS. Immunoassays for testosterone show significant inaccuracy, particularly at the low concentrations typical of females, children, and hypogonadal males [24]. A comparative evaluation of urinary free cortisol for Cushing's syndrome diagnosis found that, while newer direct immunoassays showed strong correlation with LC-MS/MS, they consistently exhibited a proportional positive bias [10] [30]. This systematic overestimation can lead to the establishment of higher clinical cut-off values (varying from 178.5 to 272.0 nmol/24h across immunoassays versus the reference LC-MS/MS method), potentially impacting diagnostic accuracy [30].
Innovative hybrid techniques like immunologic Mass Spectrometry (iMS) are emerging to bridge methodological gaps. The iMS approach uses monoclonal antibodies coupled to magnetic beads for automated, selective enrichment of target hormones from serum before LC-MS/MS analysis [26]. This method combines the high specificity of immunological capture with the detection power of MS, effectively overcoming matrix effects without the need for matrix-matched calibration. Studies show iMS achieves absolute recoveries of 93.9–110.8% for testosterone, progesterone, and estradiol, and calibration curves prepared in simple methanol solution, BSA solution, and blank serum show remarkable consistency—a feat unattainable with traditional LC-MS/MS sample preparation [26].
Isotope Dilution Mass Spectrometry represents the pinnacle of accuracy and precision for the quantification of steroid hormones and other small molecules in endocrine research and clinical diagnostics. Its unique capability to correct for analytical losses and matrix effects through the use of stable isotope-labeled internal standards makes it the undisputed reference method against which all other assays are judged.
The future of IDMS is directed toward several key areas:
- Increasing Automation and Throughput: Methods like immunologic MS (iMS) that use immunomagnetic beads for automated sample preparation are paving the way for more standardized and higher-throughput IDMS analyses in clinical laboratories [26].
- Standardization and Harmonization: Programs led by organizations like the CDC are crucial for improving the agreement between different MS methods and between MS and immunoassays, ensuring patient results are consistent regardless of the testing location or method used [27] [25].
- Expansion to Novel Biomarkers: The fundamental principles of IDMS continue to be applied to new classes of biomarkers, promising further advancements in endocrine and metabolic research [28] [31].
For researchers and drug development professionals requiring the highest level of confidence in their hormone concentration data, implementing a well-validated IDMS method is the definitive choice. The protocols and data presented herein provide a foundational template for developing such methods, ensuring reliable results that can drive scientific discovery and informed clinical decision-making.
Application in Action: Endocrine Disorder Case Studies and Workflows
Accurate measurement of estradiol and testosterone is critical for clinical and research endocrinology, yet it presents significant analytical challenges, particularly in postmenopausal women and pediatric populations. In these groups, steroid hormone concentrations are substantially lower than in premenopausal women or adult men, often falling below the reliable detection limits of conventional direct immunoassays [25]. This document frames these analytical challenges within the broader thesis of mass spectrometry versus immunoassay for endocrine measurements, providing detailed application notes and structured data to guide researchers and drug development professionals.
The core of the issue lies in the required sensitivity and specificity. In postmenopausal women, estradiol levels can be extremely low, a context where "immunoassays can provide clinically meaningful results, especially at high concentrations" but often lack accuracy at the low end [25]. Similarly, in pediatric patients, hormone levels can be 100 times lower than in adults, making most direct immunoassays unsuitable for accurate quantification [32] [33]. This application note provides a detailed comparison of these techniques and standardized protocols to address these specific analytical needs.
Performance Data Comparison: Immunoassay vs. Mass Spectrometry
Quantitative Performance in Pediatric Populations
Table 1: Method Comparison for Estradiol Measurement in Pediatric Sera [32] [33]
| Method | Sample Pool | Mean Concentration ± SD (pmol/L) | Inter-laboratory CV | Notes |
|---|---|---|---|---|
| LC-MS/MS (n=3 labs) | A (Prepubertal) | 4.9 ± 1.2 | 24.2% | High conformity between labs |
| C (Girls, Early-Mid Puberty) | 33.9 ± 1.6 | <24.2% | High conformity between labs | |
| Direct Immunoassays (n=18 labs) | A (Prepubertal) | 25.3 ± 18.1 | Up to 81.4% | Significant overestimation vs. LC-MS/MS |
| C (Girls, Early-Mid Puberty) | 45.7 ± 19.4 | Up to 81.4% | Significant overestimation vs. LC-MS/MS |
Table 2: Method Comparison for Testosterone Measurement in Pediatric Sera [32] [33]
| Method | Sample Pool | Mean Concentration ± SD (nmol/L) | Inter-laboratory CV | Notes |
|---|---|---|---|---|
| LC-MS/MS (n=3 labs) | A (Prepubertal) | 0.06 ± 0.00 | 13.4% | High conformity between labs |
| D (Boys, Early-Mid Puberty) | 1.00 ± 0.11 | <13.4% | High conformity between labs | |
| Direct Immunoassays (n=18 labs) | A (Prepubertal) | 0.12 ± 0.11 | Up to 95.8% | Significant overestimation vs. LC-MS/MS |
| D (Boys, Early-Mid Puberty) | 0.85 ± 0.23 | Up to 95.8% | Discrepancy between results |
Performance in Salivary Hormone Profiling and Postmenopausal Women
Table 3: Performance in Salivary Matrices and Low-Concentration Scenarios
| Scenario | Method | Key Finding | Reference |
|---|---|---|---|
| Salivary Sex Hormones (Healthy Adults) | ELISA (Salimetrics) | Poor performance for estradiol and progesterone; more valid for testosterone. | [9] |
| LC-MS/MS | Superior validity for steroid profiling of healthy adults. Machine-learning classification models revealed better results. | [9] | |
| Testosterone in Females & Pediatrics | Immunoassay | Tendency to overestimate concentrations when <100 ng/dL. | [34] |
| LC-MS/MS | Gold standard for measuring testosterone in these patient populations. | [34] | |
| Estradiol in Postmenopausal Women | Immunoassay | Struggles with accuracy at low concentrations (<2 pg/mL in breast cancer patients on aromatase inhibitors). | [34] [25] |
| LC-MS/MS | Considered a more accurate method for low-level estradiol. The CDC has established a standardization program using LC-MS/MS. | [34] [25] |
Detailed Experimental Protocols
Protocol for Steroid Profiling via Liquid Chromatography-Tandem Mass Spectrometry (LC-MS/MS)
This protocol is adapted for the simultaneous quantification of estradiol and testosterone in serum, suitable for low-concentration scenarios [34] [35].
Principle: Steroids are extracted from serum via liquid-liquid extraction, separated by liquid chromatography, and detected using tandem mass spectrometry with electrospray ionization (ESI) in positive multiple reaction monitoring (MRM) mode. The use of stable isotope-labeled internal standards (e.g., 13C3-estradiol, D3-testosterone) corrects for analytical variability and matrix effects [35].
Workflow Diagram: The following diagram illustrates the core LC-MS/MS analytical process.
Materials and Reagents:
- Calibrators and Quality Controls: Prepared in steroid-stripped human serum across the expected physiological range (e.g., 0.5-500 pg/mL for estradiol, 0.1-50 ng/dL for testosterone).
- Internal Standard Working Solution: Contains stable isotope-labeled analogs in methanol.
- Extraction Solvent: HPLC-grade methyl tert-butyl ether (MTBE) or hexane-ethyl acetate.
- Mobile Phases:
- Mobile Phase A: 0.1% Formic acid in water.
- Mobile Phase B: 0.1% Formic acid in methanol or acetonitrile.
- LC Column: Reversed-phase C18 column (e.g., 100 x 2.1 mm, 1.7-2.6 µm particle size).
Step-by-Step Procedure:
- Sample Preparation: Pipette 200-500 µL of serum, calibrator, or quality control into a glass tube. Add a fixed volume (e.g., 50 µL) of the internal standard working solution. Vortex mix thoroughly.
- Liquid-Liquid Extraction: Add 2-3 mL of ice-cold extraction solvent (MTBE). Vortex mix vigorously for 5-10 minutes. Centrifuge at >3000 g for 10 minutes to separate phases. Flash-freeze the aqueous layer in a dry ice/ethanol bath and decant the organic layer into a new tube. Evaporate the organic layer to dryness under a gentle stream of nitrogen in a warm water bath (~40°C).
- Reconstitution: Reconstitute the dry residue in 100-200 µL of a reconstitution solution (e.g., 30-50% methanol in water). Vortex mix thoroughly and transfer to an autosampler vial.
- LC-MS/MS Analysis:
- Chromatography: Inject an aliquot (5-25 µL) onto the LC column. Use a gradient elution program at a flow rate of 0.3-0.5 mL/min. A typical gradient starts at 30-40% B, ramping to 95-98% B over 5-10 minutes to elute the analytes, followed by re-equilibration.
- Mass Spectrometry: Operate the mass spectrometer in positive ESI mode with MRM. The instrument parameters (ion spray voltage, source temperature, gas flows) must be optimized for the specific platform. Monitor at least two MRM transitions per analyte for quantification and qualifier confirmation.
Protocol for Direct Immunoassay
This protocol outlines the typical procedure for a commercial chemiluminescent immunoassay (CLIA) on an automated platform, noting its limitations in low-concentration scenarios [32] [33].
Principle: The assay uses steroid-specific antibodies coupled to paramagnetic particles or plates. The analyte in the sample competes with a labeled analyte (e.g., chemiluminescent conjugate) for a limited number of antibody binding sites. The measured signal is inversely proportional to the concentration of the analyte in the sample.
Workflow Diagram: The following diagram illustrates the core competitive immunoassay process.
Materials and Reagents:
- Commercial Kit: Includes pre-diluted calibrators, quality controls, antibody-coated solid phase, chemiluminescent conjugate, and assay buffer.
- Automated Analyzer: Such as Roche cobas e series, Siemens Advia Centaur, or Abbott Alinity i.
Step-by-Step Procedure:
- Loading: Place patient samples, calibrators, and controls on the analyzer. Load the reagent kit according to the manufacturer's instructions.
- Automated Process: The instrument automatically performs the following:
- Pipettes a small sample volume (e.g., 25-150 µL) and reagent.
- Incubates the mixture to allow competitive binding.
- Washes the solid phase to separate bound from unbound conjugate.
- Triggers the chemiluminescent reaction and measures the resulting light signal.
- Calibration and Calculation: The analyzer software generates a calibration curve from the calibrators. Patient results are interpolated from this curve. Note that these assays are often standardized against manufacturer-specific standards, which can lead to significant between-method bias, especially at low concentrations [32] [34].
The Scientist's Toolkit: Essential Research Reagents and Materials
Table 4: Key Reagent Solutions for Steroid Hormone Profiling
| Item | Function/Application | Critical Notes |
|---|---|---|
| Stable Isotope-Labeled Internal Standards (e.g., 13C3-Estradiol, D3-Testosterone) | Corrects for losses during sample preparation and matrix effects during MS ionization; essential for accurate quantification in LC-MS/MS. | Considered mandatory for high-quality laboratory-developed tests (LDTs). |
| Certified Reference Material | Provides traceability and standardization for calibrators. | Sourced from organizations like NIST or the CDC's HoSt program to ensure accuracy. |
| Stripped/Synthetic Serum | Matrix for preparation of in-house calibrators and quality control materials. | Must be verified for low background levels of target analytes. |
| LC-MS/MS Grade Solvents | Used for mobile phases and sample extraction. | High purity minimizes background noise and ion suppression. |
| Solid-Phase Extraction Cartridges or Liquid-Liquid Solvents | Isolate and pre-concentrate analytes from complex biological matrices. | Choice depends on required specificity, recovery, and throughput. |
| Species-Specific Antibodies | Key component of immunoassays, defining specificity. | Cross-reactivity with structurally similar steroids is a major source of inaccuracy. |
| Automated Immunoassay Reagent Kits | Integrated, ready-to-use reagents for high-throughput clinical analyzers. | Performance characteristics (sensitivity, precision) are kit- and analyzer-specific. |
The data and protocols presented herein robustly support the overarching thesis that mass spectrometry, specifically LC-MS/MS, is the superior analytical technique for quantifying estradiol and testosterone in postmenopausal women and pediatric populations. While immunoassays offer valuable throughput and convenience for high-concentration scenarios, their documented lack of precision, accuracy, and specificity at low concentrations makes them unsuitable for critical applications in these specific demographic groups [9] [32] [33]. The transition to standardized, accurate LC-MS/MS methods is essential for generating reliable data in both clinical management and pharmaceutical research related to endocrine function.
Metabolomics has emerged as a powerful tool for identifying novel biomarkers and elucidating pathological mechanisms in complex endocrine and metabolic diseases. This application note explores the roles of branched-chain amino acids (BCAAs) and lysine in type 2 diabetes mellitus (T2DM) and osteoporosis, framing these discoveries within the critical context of analytical methodology. We demonstrate how advances in mass spectrometry (MS) have enabled more precise quantification of these metabolites compared to traditional immunoassays, revealing their significance in disease networks and early risk prediction. The protocols and data presented herein provide researchers with validated workflows for metabolite analysis, highlighting the essential transition toward MS-based techniques to drive innovations in biomarker discovery, clinical diagnostics, and therapeutic development.
The rising global prevalence of T2DM and osteoporosis presents substantial public health challenges, driving urgent need for better early detection and prevention strategies. Metabolomics, the comprehensive analysis of small molecule metabolites, has opened new avenues for understanding the complex pathophysiology of these conditions [36]. Unlike other omics approaches, metabolomics provides a direct snapshot of ongoing physiological processes and metabolic disturbances, often revealing alterations that precede clinical symptoms [37].
A critical yet often overlooked aspect of biomarker research is the analytical methodology employed. While immunoassays have historically been used for hormone and metabolite quantification, their limitations in specificity and accuracy—particularly at lower concentrations—have become increasingly apparent [4] [9]. Mass spectrometry has emerged as the gold standard, providing the precision necessary to detect subtle metabolic shifts that may serve as early warning signs of disease development [4].
This application note examines the discovery of BCAAs and lysine as significant biomarkers in T2DM and osteoporosis, detailing the experimental protocols and data analysis frameworks that have enabled these findings. By integrating quantitative metabolomic profiling with advanced network analysis, researchers can now identify central hubs in metabolic networks that offer the greatest potential for clinical translation.
Metabolic Biomarkers in Disease Context
Branched-Chain Amino Acids in Type 2 Diabetes
BCAAs (valine, leucine, and isoleucine) have consistently emerged as significant predictors of T2DM risk in large-scale metabolomic studies. Research involving 98,831 UK Biobank participants revealed that BCAAs exhibit distinct network characteristics in individuals with pre-diabetes, suggesting their potential as early indicators of diabetes development long before clinical diagnosis [37]. Network analysis demonstrated that BCAAs formed interconnected hubs with other diabetes-associated metabolites, with the topological properties of these networks differing significantly between healthy and pre-diabetic states.
A separate metabolome-wide association study conducted over a 12-year follow-up period identified 114 metabolites significantly associated with T2DM incidence, with BCAAs displaying particularly strong associations even after comprehensive adjustment for clinical covariates including age, gender, BMI, and hypertension status [37]. The consistency of these findings across diverse populations underscores the robustness of BCAAs as biomarkers of diabetic risk.
Table 1: BCAA and Lysine Associations in Metabolic Diseases
| Biomarker | Associated Disease | Direction of Change | Study Population | Key Findings |
|---|---|---|---|---|
| Branched-chain amino acids (BCAAs) | T2DM | Increased | 98,831 UK Biobank participants [37] | Small-world network characteristics in pre-T2DM; HR=1.48-1.62 across models |
| BCAAs | T2DM | Increased | Multi-cohort study [36] | Associated with insulin resistance years before onset |
| Lysine | Osteoporotic fracture | Decreased | 44 fracture cases, 88 controls [38] | Significant negative association (OR: 0.304; 95% CI: 0.117-0.794) |
| Total AAs | Osteoporotic fracture | Decreased | 44 fracture cases, 88 controls [38] | Inverse association with recent fracture, especially hip fracture |
Amino Acids in Osteoporosis
The relationship between amino acid profiles and bone health has gained increasing recognition in metabolomic research. A matched case-control study investigating recent osteoporotic fractures found significantly lower plasma levels of total, essential, and non-essential amino acids in fracture cases compared to healthy controls [38]. After adjusting for covariates including BMI, physical activity, milk intake, and falls history, each standard deviation increase in total amino acids was associated with a 70% reduction in fracture risk (OR: 0.304; 95% CI: 0.117-0.794) [38].
Among specific amino acids, lysine demonstrated particularly strong inverse associations with fracture risk, along with alanine, arginine, glutamine, histidine, and piperamide [38]. These relationships were more pronounced for hip fractures than non-hip fractures, suggesting that amino acid profiles may reflect particularly severe deficits in bone quality and metabolism. The consistency of these findings across multivariate models indicates the potential utility of amino acid profiling, particularly lysine, in fracture risk assessment.
Analytical Methodologies: Mass Spectrometry vs. Immunoassay
The accuracy of metabolite quantification fundamentally influences the validity of biomarker associations and their potential clinical translation. Comparative studies have consistently demonstrated the superiority of mass spectrometry over immunoassay techniques across multiple applications.
Technical Performance Comparisons
In the analysis of sex hormones, direct comparisons between enzyme-linked immunosorbent assay (ELISA) and liquid chromatography-tandem mass spectrometry (LC-MS/MS) revealed substantial methodological differences. While testosterone measurements showed reasonable correlation between techniques (r=0.76-0.85), estradiol and progesterone demonstrated poor agreement, with LC-MS/MS showing expected physiological differences between groups that were not detected by ELISA [9].
Similarly, a multicenter study evaluating estradiol measurements in men found only moderate correlations between immunoassay and MS techniques (Spearman r=0.53-0.76) [4]. Critically, immunoassay-based estradiol measurements showed significant interference from C-reactive protein (r=0.29, p<0.001), while MS measurements were unaffected by inflammatory state [4]. This confounding relationship led to spurious associations between immunoassay-estradiol and ankle-brachial index that disappeared after adjustment for CRP, whereas MS-estradiol showed no such artifactual associations [4].
Table 2: Comparison of Analytical Platforms for Metabolite Quantification
| Parameter | Immunoassay | Mass Spectrometry |
|---|---|---|
| Specificity | Subject to cross-reactivity [4] | High molecular specificity [4] [9] |
| Sensitivity in low concentration | Poor, especially in postmenopausal women and men [4] | Excellent detection limits [4] |
| Multiplexing capability | Limited | High (100+ metabolites simultaneously) [37] |
| Susceptibility to interference | Affected by CRP and other factors [4] | Minimal interference |
| Throughput | High | Moderate to high |
| Cost per sample | Low to moderate | Moderate to high |
| Dynamic range | Limited | Wide linear range |
Implications for Biomarker Research
These methodological differences have profound implications for metabolomic research and clinical translation. The interference observed in immunoassays can generate false-positive or false-negative associations, potentially misleading research conclusions and clinical decisions [4]. In contrast, the precision of MS-based measurements enables detection of subtle metabolic perturbations that may serve as early warning signs of disease development.
For BCAA and lysine quantification specifically, the multiplexing capability of MS platforms allows simultaneous measurement of multiple amino acids and related metabolites, providing comprehensive metabolic profiles from limited sample volumes [37] [38]. This capability is particularly valuable for constructing metabolic networks and identifying coordinated changes across multiple pathways.
Experimental Protocols
Metabolomic Profiling for Biomarker Discovery
Sample Preparation Protocol (Serum/Plasma)
- Collection: Collect fasting blood samples in appropriate collection tubes (EDTA plasma preferred for metabolomic studies). For fracture patients, collect samples before any surgical intervention or medication administration [38].
- Processing: Centrifuge samples at 3000 rpm for 10 minutes at 4°C within 60 minutes of collection. Aliquot 250 μL of supernatant into pre-labeled cryovials.
- Storage: Immediately store samples at -80°C, avoiding freeze-thaw cycles [38].
- Metabolite Extraction: Thaw samples on ice. Combine 50 μL sample with 300 μL extraction solution (acetonitrile:methanol, 1:4 v/v) containing internal standards. Vortex for 3 minutes [39].
- Protein Precipitation: Centrifuge at 12,000 rpm for 10 minutes at 4°C. Collect 200 μL supernatant and hold at -20°C for 30 minutes.
- Final Clarification: Centrifuge at 12,000 rpm for 3 minutes at 4°C. Transfer 180 μL supernatant for LC-MS analysis [39].
LC-MS/MS Analysis for Amino Acids
- Chromatography:
- Column: Waters ACQUITY Premier HSS T3 (1.8 μm, 2.1 mm × 100 mm) or equivalent [39]
- Mobile Phase: A) Water with 0.1% formic acid; B) Acetonitrile with 0.1% formic acid
- Gradient: Optimized for amino acid separation over 6-20 minute runtime
- Temperature: 40°C
- Injection Volume: 5-10 μL
Mass Spectrometry:
- Ionization: Electrospray ionization (ESI) in positive mode
- Mass Analyzer: Q Exactive HF-X or similar high-resolution instrument
- Scan Range: m/z 70-1050 for global profiling
- Resolution: 60,000-120,000 for targeted quantification
- Fragmentation: Data-dependent MS/MS for metabolite identification [39]
Quality Control:
- Include pooled quality control (QC) samples from all study samples
- Run QC samples at beginning (5x) and throughout sequence (every 3-6 samples)
- Monitor retention time stability and signal intensity [39]
Figure 1: Experimental workflow for metabolomic biomarker discovery from sample collection to validation.
Data Processing and Normalization
Metabolomic Data Preprocessing
- Raw Data Conversion: Convert mass spectrometer raw files to mzXML format using ProteoWizard or similar tools [39].
- Peak Detection and Alignment: Use XCMS or proprietary software for peak picking, alignment, and integration.
- Metabolite Identification: Match accurate mass and MS/MS spectra to reference databases (HMDB, METLIN).
- Normalization: Apply advanced normalization protocols to address interindividual variability:
- Quality Assessment: Remove metabolites with >30% missing values or high coefficient of variation (>15-20%) in QC samples.
Statistical Analysis Framework
- Univariate Analysis: Perform t-tests or Mann-Whitney tests with false discovery rate (FDR) correction for multiple comparisons [38].
- Multivariate Analysis:
- Network Analysis:
- Machine Learning:
- Implement XGBoost or Random Forest for classification
- Use recursive feature elimination to identify most predictive metabolites
- Validate models with independent test sets or cross-validation [37]
Biomarker Validation and Clinical Translation
Analytical Validation
Before clinical implementation, putative biomarkers require rigorous analytical validation:
- Precision: Intra- and inter-assay CV <15%
- Accuracy: Recovery of 85-115% from spiked samples
- Linearity: R² >0.99 across physiological range
- Stability: Evaluation under various storage conditions
- Reference Intervals: Establish sex- and age-specific normal ranges
Clinical Validation
For BCAA and lysine biomarkers, clinical validation should include:
- Prospective Studies: Evaluate predictive performance in independent cohorts
- Disease Staging: Assess biomarker levels across disease continuum (normal → pre-disease → established disease)
- Specificity Testing: Evaluate performance against relevant differential diagnoses
- Intervention Monitoring: Determine responsiveness to therapeutic interventions
Figure 2: Metabolic pathways for BCAA in diabetes development and lysine in bone metabolism.
The Scientist's Toolkit: Essential Research Reagents
Table 3: Essential Research Reagents for Metabolomic Studies
| Reagent/Kit | Application | Key Features | Example Use |
|---|---|---|---|
| AbsoluteIDQ p180 Kit | Targeted metabolomics | Quantification of 188 metabolites across 6 compound classes | Large cohort studies [40] |
| EDTA plasma collection tubes | Sample collection | Preserves metabolite stability | All metabolomic studies [37] |
| Isotope-labeled internal standards | Quantification | Correct for matrix effects and recovery | Amino acid quantification [38] |
| Quality control materials | Assay validation | Monitor analytical performance | Inter-laboratory standardization |
| UHPLC systems with HSS T3 columns | Separation | High resolution for polar metabolites | Amino acid separation [39] |
| High-resolution mass spectrometers | Detection | Accurate mass measurement | Metabolite identification [39] |
The integration of advanced metabolomic approaches with robust MS-based analytical platforms has revealed BCAA and lysine as significant biomarkers in T2DM and osteoporosis, respectively. These discoveries highlight the intricate connections between metabolic pathways and disease pathogenesis, offering new opportunities for early risk assessment and targeted interventions.
The methodological comparisons presented in this application note underscore the critical importance of analytical technique selection in biomarker research. The demonstrated superiority of mass spectrometry over immunoassay techniques necessitates a paradigm shift toward MS-based approaches in both research and clinical settings, particularly for endocrine measurements where precision and specificity are paramount.
As the field advances, the integration of metabolomic biomarkers with other omics data and clinical parameters will enable more comprehensive disease risk assessment and personalized intervention strategies. The protocols and methodologies detailed herein provide a foundation for rigorous metabolomic research that can drive meaningful advances in clinical practice and therapeutic development.
The measurement of 24-hour urinary free cortisol (UFC) represents a cornerstone biochemical test in the diagnostic workflow for Cushing's syndrome (CS), a rare endocrine disorder characterized by chronic hypercortisolism [41] [42]. For over four decades, this non-invasive test has served as a first-line screening tool, reflecting integrated tissue exposure to biologically active free cortisol over a 24-hour period [41]. The diagnostic landscape is currently shaped by two principal analytical methodologies: immunoassays and liquid chromatography-tandem mass spectrometry (LC-MS/MS) [20] [42]. Immunoassays offer widespread availability and operational simplicity but are plagued by antibody cross-reactivity with cortisol metabolites [41] [43]. Conversely, LC-MS/MS provides superior analytical specificity and sensitivity, emerging as the reference method despite requirements for significant technical expertise and infrastructure [20] [44] [42]. This protocol document details standardized procedures for UFC measurement, contextualized within a broader research framework comparing mass spectrometry and immunoassay performance for endocrine diagnostics.
Quantitative Method Comparison: Immunoassay vs. LC-MS/MS
Table 1: Diagnostic Performance of UFC Measurement Platforms for Cushing's Syndrome
| Analytical Platform | Spearman Correlation (r) with LC-MS/MS | AUC (95% CI) | Optimal Cut-off (nmol/24h) | Sensitivity (%) | Specificity (%) | Reference |
|---|---|---|---|---|---|---|
| LC-MS/MS (Reference) | - | 0.972 | 154.8 | 96.0 | 91.0 | [43] [45] |
| Autobio A6200 | 0.950 | 0.953 | 272.0 | 93.1 | 93.3 | [20] |
| Mindray CL-1200i | 0.998 | 0.969 | 220.0 | 89.7 | 96.7 | [20] |
| Snibe MAGLUMI X8 | 0.967 | 0.963 | 217.0 | 90.8 | 95.0 | [20] |
| Roche 8000 e801 | 0.951 | 0.958 | 178.5 | 89.7 | 96.7 | [20] |
| Abbott Architect (Direct) | 0.965 | 0.975 | 193.5 | 93.2 | 97.1 | [43] |
| Siemens Atellica (Extraction) | 0.922 | 0.966 | 305.5 | 84.1 | 93.0 | [43] |
| Beckman DxI800 (Extraction) | 0.922 | 0.955 | 1321.5 | 76.1 | 93.0 | [43] |
Table 2: Analytical Characteristics of UFC Measurement Methods
| Parameter | Traditional Immunoassays | Modern Direct Immunoassays | LC-MS/MS Methods |
|---|---|---|---|
| Sample Preparation | Often requires liquid-liquid extraction | Dilute-and-shoot (no extraction) | Liquid-liquid extraction or dilute-and-shoot |
| Cross-reactivity | High with cortisol metabolites | Reduced due to improved antibodies | Negligible |
| Reported Positive Bias vs. LC-MS/MS | Up to 225 nmol/L | Proportional positive bias observed | Reference method |
| Throughput | High | High | Moderate |
| Cost | Moderate | Moderate | High |
| Technical Demand | Low | Low | High |
| Reference Range | Method-dependent, generally higher | 178.5-272.0 nmol/24h | 43.7-154.8 nmol/24h |
Experimental Protocols
Pre-analytical Phase: Urine Collection and Storage
Principle: Accurate UFC measurement requires complete 24-hour urine collection to account for diurnal cortisol variation [42]. Proper handling preserves analyte integrity.
Materials:
- 3-5 liter clean collection container
- Cooler or refrigerator (4°C) for storage
- Aliquot tubes (15-50 mL)
- Written instructions for patients
Procedure:
- Patient Preparation: Instruct patients to discard the first morning void. Note the exact time as collection start.
- Collection: Collect all subsequent urine voids for 24 hours, including the first morning void of the next day.
- Storage: Keep the collection container refrigerated (4°C) throughout the 24-hour period.
- Post-collection: Mix the total urine collection thoroughly. Measure and record total volume.
- Aliquoting: Transfer 10-20 mL into a transport tube. Freeze aliquots at -20°C or below if not analyzed immediately.
- Documentation: Record total volume and collection duration. Measure urine creatinine to assess collection completeness [42].
Note: UFC remains stable for over three days regardless of storage temperature (4°C vs room temperature) or light exposure [42].
Analytical Phase: LC-MS/MS Protocol for UFC Quantification
Principle: LC-MS/MS provides specific cortisol measurement through chromatographic separation and mass-based detection, minimizing metabolic interference [44] [45].
Materials:
- Internal Standard: Cortisol-d4 (cortisol-9,11,12,12-d4)
- Solvents: HPLC-grade water, methanol, dichloromethane
- Calibrators: Certified cortisol reference material
- Equipment: SCIEX Triple Quad 6500+ LC-MS/MS system or equivalent
- Chromatography: ACQUITY UPLC BEH C8 column (1.7 µm, 2.1×100 mm)
Procedure:
- Sample Preparation: Aliquot 500 µL urine into extraction tube. Add 100 µL cortisol-d4 internal standard (200 ng/dL final concentration). Acidify with 20 µL H2SO4 to release protein-bound cortisol [45].
- Liquid-Liquid Extraction: Add 2 mL dichloromethane. Vortex mix for 10 minutes. Centrifuge at 3,000 × g for 5 minutes. Transfer organic layer to a clean tube.
- Stepwise Washing: Wash extract sequentially with acidic, basic, and neutral solutions to remove interferents [45].
- Evaporation and Reconstitution: Evaporate organic layer to dryness under nitrogen stream. Reconstitute in 100 µL mobile phase (water:methanol, 70:30, v/v).
- Liquid Chromatography: Inject 10 µL onto LC column. Use binary mobile phase: water (A) and methanol (B) with gradient elution (0-2 min: 30% B; 2-6 min: 30-95% B; 6-8 min: 95% B; 8-8.1 min: 95-30% B; 8.1-10 min: 30% B). Flow rate: 0.4 mL/min [43] [44].
- Mass Spectrometry Detection: Operate in positive electrospray ionization mode with multiple reaction monitoring (MRM). Use transitions: 363.2→121.0 (cortisol quantifier), 363.2→327.0 (cortisol qualifier), 367.2→121.0 (internal standard) [43].
- Quantification: Use internal standard calibration with 6-point calibration curve (5-5,000 ng/dL). Apply linear regression with 1/x weighting [45].
Validation Parameters:
- Precision: Intra-day CV <3.3%, inter-day CV <8.0% [45]
- Linearity: 10-10,000 ng/dL [45]
- Recovery: 100.43-103.10% [43]
- LOD/LOQ: Limit of detection <10 ng/dL [45]
Alternative Protocol: Direct Immunoassay Method
Principle: Modern automated immunoassays use competitive binding with chemiluminescent detection for high-throughput UFC analysis without extraction [20].
Materials:
- Automated immunoassay analyzer (e.g., Autobio A6200, Mindray CL-1200i, Snibe MAGLUMI X8, Roche 8000 e801)
- Manufacturer-specific cortisol reagent kits and calibrators
- Quality control materials
Procedure:
- Sample Pretreatment: For platforms requiring dilution, dilute urine samples with manufacturer-recommended diluent (sample diluent, phosphate buffered saline, or cortisol calibrator) [20].
- Calibration: Perform instrument calibration using manufacturer-provided calibrators according to platform-specific protocols.
- Quality Control: Assay two levels of quality control materials before patient samples.
- Automated Analysis: Load samples, reagents, and consumables. Initiate automated analysis protocol. The system performs:
- Competitive binding between urine cortisol and labeled cortisol tracer for antibody sites
- Wash steps to remove unbound material
- Chemiluminescent or electrochemiluminescent signal generation
- Signal measurement and cortisol concentration calculation
- Result Calculation: Instrument software automatically calculates UFC concentrations based on calibration curve [20].
Method-Specific Notes:
- Autobio, Mindray: Allow both direct and extraction methods; follow manufacturer instructions for dilution factors [20]
- Snibe, Roche: Designed for direct measurement without extraction [20]
- Platforms show strong correlation with LC-MS/MS (r=0.950-0.998) but exhibit proportional positive bias [20]
Method Selection Workflow
The Scientist's Toolkit: Research Reagent Solutions
Table 3: Essential Research Materials for UFC Method Development
| Reagent/Equipment | Specification/Function | Research Application |
|---|---|---|
| Certified Cortisol Reference Standard | ≥98% purity, traceable to reference method | Calibration curve preparation, method validation |
| Stable Isotope-Labeled Internal Standard (Cortisol-d4) | Cortisol-9,11,12,12-d4, 25 ng/mL working solution | Compensation for matrix effects and recovery variations in LC-MS/MS |
| Chromatography Column | ACQUITY UPLC BEH C8 (1.7 µm, 2.1×100 mm) | Steroid separation with high resolution |
| Mass Spectrometry System | Triple quadrupole LC-MS/MS with ESI source | Specific detection and quantification of cortisol |
| Liquid-Liquid Extraction Solvents | HPLC-grade dichloromethane or ethyl acetate | Sample cleanup and cortisol extraction prior to analysis |
| Quality Control Materials | Commercial urine QC pools at two cortisol levels | Monitoring assay precision and long-term performance |
| Automated Immunoassay Analyzers | Platforms: Roche, Abbott, Siemens, Beckman, Mindray | High-throughput clinical screening applications |
| Sample Diluents | Manufacturer-specific buffers or phosphate buffered saline | Matrix modification for direct immunoassays |
Discussion and Future Perspectives
The evolution of UFC measurement methodologies reflects broader trends in endocrine diagnostics, where mass spectrometry increasingly sets the standard for analytical specificity while immunoassays maintain clinical utility through technological improvements [41] [42]. Recent advancements in antibody engineering have yielded direct immunoassays with remarkable correlation to LC-MS/MS (r=0.950-0.998), potentially obviating the need for cumbersome extraction procedures [20]. However, method-specific reference ranges remain essential, as evidenced by the substantial variation in optimal cut-off values (154.8-1321.5 nmol/24h) across platforms [43].
Emerging research directions include the quantification of intact phase II cortisol metabolites (glucuro- and sulfo-conjugates) via novel dilute-and-shoot LC-MS/MS methods, which may improve diagnostic sensitivity for mild or cyclical Cushing's syndrome [44]. Additionally, the integration of cortisol measurements across multiple matrices (serum, saliva, urine, hair) provides complementary diagnostic information, with late-night salivary cortisol demonstrating particular utility for detecting recurrent disease [41] [42].
The endocrine testing market continues to evolve, with mass spectrometry representing the fastest-growing technology segment despite immunoassays maintaining dominant market share [46]. This dichotomy underscores the complementary roles of both methodologies: immunoassays for high-volume screening applications and mass spectrometry for reference testing, complex cases, and advanced research applications. As methodological standardization improves and novel biomarkers emerge, UFC measurement will continue to serve as a fundamental component in the diagnosis and monitoring of Cushing's syndrome.
Therapeutic monoclonal antibodies (mAbs) have revolutionized the treatment of various conditions, including cancers and autoimmune diseases [47]. Rituximab, a chimeric immunoglobulin G1-kappa (IgG1κ) antibody targeting the CD20 antigen on B-lymphocytes, is used in oncology for chronic lymphoid leukemia and non-Hodgkin's lymphoma, and for autoimmune diseases such as vasculitis and rheumatoid arthritis [48] [49]. The high interindividual variability in rituximab systemic exposure and the demonstrated relationship between its plasma concentrations and treatment efficacy underscore the critical need for Therapeutic Drug Monitoring (TDM) to optimize dosing regimens [48] [50].
While immunoassays like ELISA have been traditionally used for mAb quantification, liquid chromatography coupled with mass spectrometry (LC-MS) has emerged as a powerful alternative offering superior specificity, the ability to multiplex, and the capacity to quantify any therapeutic mAb without the need for mAb-specific reagents [51] [52]. This application note details robust LC-MS methods for quantifying rituximab in human plasma, providing researchers with validated protocols for implementing TDM in clinical and research settings.
Analytical Method Comparison: LC-MS vs. Immunoassay
The quantification of biologics like rituximab presents unique challenges due to their complex and heterogeneous structures [47]. Immunoassays can be limited by a lack of specificity, potential for cross-reactivity, and significant variability between different commercial kits [50]. In contrast, mass spectrometry-based methods leverage the unique molecular weight and specific signature peptides of mAbs for highly specific quantification.
Table 1: Comparison of Rituximab Quantification Methods
| Method | Principle | Dynamic Range | Key Advantages | Key Limitations |
|---|---|---|---|---|
| ELISA [50] | Antigen-antibody binding | Varies by kit (e.g., 2-50 µg/mL) [48] | High throughput; established workflows | Potential for cross-reactivity; significant bias between kits [50] |
| LC-MS/MS (Quadripolar) [48] [49] | Surrogate peptide detection (MRM) | 1 to 200 µg/mL [50] or 5 to 500 µg/mL [48] | High specificity; multiplexing capability | Requires extensive sample preparation |
| LC-MS/HRMS (Orbitrap) [48] [49] | Surrogate peptide detection (PRM) | 10 to 200 µg/mL [48] | High resolution and mass accuracy | Higher instrument cost; longer run times (16 min) [48] |
| LC-ESI-Q-TOF [51] | Intact light chain analysis | 0 to 250 µg/mL [52] | No need for digestion; can phenotype endogenous immunoglobulins | Lower limit of quantification (14.3 µg/mL) [52] |
A comparative study of two commercial ELISA kits versus an LC-MS/MS method revealed a negligible bias (4%) with one kit but a significant mean underestimation of 69% with the other, highlighting a concerning lack of interchangeability between immunoassays [50]. Furthermore, MS methods facilitate multiplexing, allowing for the simultaneous quantification of multiple therapeutic antibodies, such as rituximab and eculizumab, in a single analysis [50].
Detailed Experimental Protocols
Protocol 1: Rituximab Quantification via LC-MS/MS or LC-MS/HRMS Using Surrogate Peptides
This protocol, adapted from a 2021 study, describes the simultaneous quantification of rituximab using either LC-MS/MS or LC-MS/HRMS platforms [48] [49].
Sample Preparation:
- Internal Standard Addition: Add full-length stable isotope-labeled rituximab (SIL-RTX) to plasma samples.
- Sample Clean-up and Enrichment: Perform either albumin depletion or IgG immunocapture to isolate the antibody fraction from plasma proteins.
- Digestion: Subject the isolated IgG to tryptic digestion to generate surrogate peptides for MS analysis.
- LC-MS Analysis: Inject the digested sample onto the LC-MS system.
Key Reagents:
- Stable isotope-labeled full-length rituximab (SIL-RTX) as Internal Standard [48] [49]
- Trypsin (proteomic grade)
- Protein G or A beads for immunocapture, or albumin depletion columns
Chromatography and Mass Spectrometry Conditions:
- Chromatography: Use a step gradient of water and acetonitrile, each containing 0.1% formic acid. Run times are 9.5 min for LC-MS/MS and 16 min for LC-MS/HRMS [48].
- Surrogate Peptides: The primary quantitative peptide is the pyroglutaminated form of QVQLQQPGAELVKPGASVK (pQVQ), derived from the heavy chain [48] [49].
- Mass Spectrometry:
Table 2: Method Validation Data for Rituximab LC-MS Assays
| Validation Parameter | LC-MS/MS Performance [48] [49] | LC-MS/HRMS Performance [48] |
|---|---|---|
| Calibration Range | 5 to 500 µg/mL | 10 to 200 µg/mL |
| Within-run Precision | < 8.5% | < 11.5% |
| Between-run Precision | < 8.5% | < 11.5% |
| Limit of Quantification (LOQ) | 5 µg/mL | 2 µg/mL |
Protocol 2: Rituximab Quantification via Intact Light Chain Analysis Using LC-ESI-Q-TOF
This alternative protocol, based on the work of Mills et al., quantifies rituximab based on its intact light chain, eliminating the need for proteolytic digestion [51] [52].
Sample Preparation:
- IgG Enrichment: Enrich serum or plasma samples for total IgG.
- Reduction: Reduce the disulfide bonds linking heavy and light chains using a reducing agent like dithiothreitol (DTT).
- LC-MS Analysis: Inject the reduced sample.
Key Reagents:
- Vedolizumab can be used as an internal standard [48].
Chromatography and Mass Spectrometry Conditions:
- Chromatography: Microflow-liquid chromatography (LC).
- Mass Spectrometry: Electrospray Ionization-Quadrupole-Time-of-Flight (ESI-Q-TOF) MS.
- Quantification: The rituximab light chain is identified by its unique molecular mass and quantified using the peak areas of its multiply charged ions with specialized software [51] [52]. This method also allows for the simultaneous phenotyping of a patient's endogenous polyclonal immunoglobulin repertoire [51].
The Scientist's Toolkit: Essential Research Reagents
Successful implementation of MS-based mAb quantification requires specific reagents and materials. The table below lists key solutions for the protocols described.
Table 3: Key Research Reagent Solutions for mAb Quantification
| Research Reagent | Function / Application | Example / Note |
|---|---|---|
| Stable Isotope-Labeled mAb | Internal Standard for quantification | Full-length SIL-RTX [48] or SIL-adalimumab [50] |
| Immunocapture Beads | Selective enrichment of IgG from biofluids | Protein G or Protein A beads [48] [49] |
| Solid-Phase Extraction Plates | Peptide clean-up post-digestion | Various commercial C18 plates |
| Signature Peptides | Surrogate analytes for MS quantification | pQVQ (heavy chain) or FSGS (light chain) peptides [48] |
| Trypsin | Proteolytic enzyme for protein digestion | Proteomic-grade, sequencing-grade |
Workflow and Data Analysis
The following diagram illustrates the logical workflow for the selection and application of LC-MS methods for rituximab TDM, as discussed in the protocols.
Decision Workflow for Rituximab Quantification
Liquid chromatography-mass spectrometry provides a specific, accurate, and versatile platform for the therapeutic drug monitoring of monoclonal antibodies like rituximab. The protocols outlined here offer researchers validated paths to implement this technology, overcoming the limitations of traditional immunoassays. The ability to precisely quantify drug levels is fundamental to understanding pharmacokinetic variability and optimizing biologic therapies for improved patient outcomes, making robust LC-MS methods an indispensable tool in modern precision medicine.
Navigating Challenges: Accuracy, Standardization, and Technical Limitations
Accurate measurement of circulating estradiol (E2) is critical for clinical and research endocrinology, particularly in postmenopausal women where concentrations are typically below 30 pg/mL. This Application Note examines the fundamental limitations of immunoassay techniques in quantifying these low E2 levels and establishes mass spectrometry as the superior methodological approach. The content is framed within a broader thesis on endocrine measurement research, highlighting the necessity for methodological rigor in generating reliable data for drug development and clinical decision-making.
The central challenge stems from the substantially reduced specificity of direct immunoassays in the low concentration range characteristic of postmenopausal women and men [53]. These techniques demonstrate questionable specificity, making them unreliable for the precise quantification required in both epidemiologic studies and clinical practice.
The Analytical Challenge: Immunoassay vs. Mass Spectrometry
Fundamental Limitations of Immunoassays
Immunoassays, including radioimmunoassay (RIA) and enzyme-linked immunosorbent assay (ELISA), operate on the principle of antibody-antigen recognition. However, their fundamental weakness in measuring low-level E2 lies in cross-reactivity.
- Metabolite Interference: E2 is metabolized to over 100 different metabolites in the body, many of which share structural similarities and cross-react with E2 antibodies [53]. This lack of specificity causes immunoassays to substantially overestimate true E2 concentrations.
- Matrix Effects: The complex serum matrix contains numerous interfering substances, notably C-reactive protein (CRP), which has been shown to positively correlate with immunoassay-measured E2 but not with mass spectrometry measurements [4]. This suggests CRP or a CRP-associated factor causes analytical interference.
- Insufficient Sensitivity: Direct RIAs without purification steps lack the necessary sensitivity and specificity to accurately measure the low E2 levels (<30 pg/mL) found in postmenopausal women, making them invalid for epidemiologic studies or clinical applications in this population [53].
The Mass Spectrometry Advantage
Liquid chromatography-tandem mass spectrometry (LC-MS/MS) represents the current gold standard for steroid hormone quantification due to its superior analytical specificity.
- Physical Separation: LC-MS/MS first separates E2 from its metabolites and matrix interferents via liquid chromatography, eliminating the cross-reactivity problem inherent to immunoassays [54].
- Mass-Based Detection: The tandem mass spectrometer identifies E2 by its precise mass-to-charge ratio and confirms its identity through characteristic fragment ions, providing unequivocal molecular identification [54]. This method provides the sensitivity and specificity required for accurate low-level E2 measurement.
The Centers for Disease Control and Prevention (CDC) has recognized this need for improved accuracy and has established a program to standardize steroid hormone measurements, including E2, using LC-MS/MS methodologies [25].
Quantitative Data Comparison
Method Correlation and Bias
Table 1: Correlation between Immunoassay and Mass Spectrometry for Estradiol Measurement in Male Cohorts
| Cohort | Sample Size (n) | Spearman Correlation Coefficient (rS) | Reported Bias |
|---|---|---|---|
| MrOS US | 688 | 0.53 | Immunoassay lower than MS |
| MrOS Sweden | 2,599 | 0.64 | Immunoassay higher than MS |
| European Male Aging Study (EMAS) | 2,908 | 0.76 | Not Specified |
Data compiled from a large-scale comparison study [4]. The moderate correlations (rS 0.53–0.76) highlight the significant variability and lack of consistency between methods. The direction of bias was not uniform across studies, indicating that immunoassay inaccuracy is not merely a constant offset but is influenced by population-specific or laboratory-specific factors.
Impact on Clinical Associations
Table 2: Differential Associations of Immunoassay vs. MS-Estradiol with Clinical Phenotypes
| Clinical Phenotype | Association with Immunoassay E2 | Association with MS E2 | Impact of CRP Adjustment |
|---|---|---|---|
| Bone Mineral Density (BMD) | Positive association | Positive association | Association remains for both methods |
| Ankle-Brachial Index (ABI) | Significant inverse association | No association | Association lost for immunoassay E2 after CRP adjustment |
Data from the MrOS Sweden and EMAS cohorts [4]. The spurious inverse association between immunoassay-E2 and ABI, which disappears after adjusting for CRP, provides direct evidence of inflammatory interference in the immunoassay. This underscores how methodological artifacts can lead to biologically misleading conclusions.
Experimental Protocols
Protocol for LC-MS/MS Analysis of Serum Estradiol
This protocol outlines the detailed methodology for achieving accurate low-level E2 measurement, as referenced in comparative studies [4] [9].
Principle: Serum samples are subjected to liquid-chromatographic separation followed by detection and quantification via tandem mass spectrometry using stable isotope-labeled internal standardization.
Materials and Reagents:
- Calibrators and Controls: Gravimetrically prepared E2 calibrators and quality control materials.
- Internal Standard: Deuterated estradiol (e.g., E2-d5).
- Solid Phase Extraction (SPE) Plates: C18 or similar hydrophobic phase.
- LC-MS/MS System: Ultra-high-performance liquid chromatography system coupled to a triple quadrupole mass spectrometer.
- Derivatization Reagent: Dansyl chloride or similar to enhance ionization efficiency.
Procedure:
- Sample Preparation: Aliquot 0.5-1.0 mL of serum or plasma into a glass tube. Add a known amount of internal standard (E2-d5) to correct for recovery and ionization variability.
- Liquid-Liquid Extraction: Add organic solvent (e.g., methyl tert-butyl ether) to precipitate proteins and extract E2. Vortex mix and centrifuge. Transfer the organic layer and evaporate to dryness under a gentle nitrogen stream.
- Chemical Derivatization: Reconstitute the dry extract with dansyl chloride reagent in a buffered solution. Incubate at 60°C for several minutes to form E2-derivative, which improves MS sensitivity.
- Liquid Chromatography: Inject the derivatized extract onto a reversed-phase UHPLC column (e.g., C18, 2.1 x 50 mm, 1.7-1.8 µm). Elute E2 using a gradient of water and methanol or acetonitrile at a flow rate of 0.4-0.6 mL/min.
- Tandem Mass Spectrometry: Operate the mass spectrometer in positive electrospray ionization (ESI+) mode with multiple reaction monitoring (MRM). Monitor specific precursor ion → product ion transitions for both native E2 and the internal standard.
- Quantification: Plot the peak area ratio (analyte/internal standard) against the known concentration of the calibrators to generate a linear calibration curve. Calculate the concentration of E2 in unknown samples from this curve.
Protocol for Immunoassay Analysis of Serum Estradiol (for comparison)
Principle: A labeled E2 derivative competes with endogenous E2 in the sample for a limited amount of E2-specific antibody. The measured signal is inversely proportional to the E2 concentration.
Materials and Reagents:
- Commercial E2 immunoassay kit (e.g., electrochemiluminescence immunoassay, ECLIA).
- Kit-specific E2 calibrators and controls.
- Automated immunoassay analyzer.
Procedure:
- Sample Allocation: Pipette patient serum, calibrators, and controls directly into the designated reaction vessels.
- Automated Analysis: Load the samples and reagents onto the automated platform. The assay typically involves incubating the sample with a biotinylated E2 derivative and a ruthenium-labeled E2 antibody to form a complex. Streptavidin-coated magnetic particles then capture this complex.
- Signal Measurement: The application of a voltage to the electrode induces chemiluminescent emission, which is measured by a photodetector.
- Quantification: The instrument software calculates E2 concentration in unknowns by interpolation from the calibrator curve.
Visualizing Methodological Differences and Interference
Analytical Workflow Comparison
CRP Interference Mechanism in Immunoassay
The Scientist's Toolkit: Essential Research Reagents & Materials
Table 3: Key Reagent Solutions for Low-Level Estradiol Analysis
| Item | Function/Description | Critical Consideration |
|---|---|---|
| Stable Isotope-Labeled Internal Standard (e.g., E2-d5) | Corrects for analyte loss during preparation and ionization suppression/enhancement in the MS source. | Essential for achieving accurate quantification in LC-MS/MS. |
| High-Purity E2 Calibrators | Gravimetrically prepared solutions used to construct the analytical calibration curve. | Must be prepared in a matrix similar to the sample to avoid matrix effects. |
| Solid Phase Extraction (SPE) Cartridges/Plates | For selective extraction and purification of E2 from complex biological matrices. | C18 or similar hydrophobic phases are commonly used; automation-compatible formats save time. |
| Chemical Derivatization Reagent (e.g., Dansyl Chloride) | Reacts with estradiol to form a derivative with enhanced ionization efficiency. | Crucial for achieving the sensitivity required for low pg/mL level detection in MS. |
| Chromatography Column (C18, sub-2µm) | Provides high-resolution separation of E2 from isobaric interferences prior to MS detection. | UHPLC technology with sub-2µm particles provides superior resolution and speed. |
| Quality Control Materials (Pooled Human Serum) | Monitors the precision and long-term stability of the analytical method. | Should contain low (postmenopausal), medium, and high levels of E2. |
The evidence firmly establishes that direct immunoassays are inadequate for measuring estradiol in postmenopausal women due to profound inaccuracies at low concentrations. These inaccuracies, driven by metabolite cross-reactivity and matrix interference, can generate spurious clinical associations and compromise research findings. LC-MS/MS, with its superior specificity and sensitivity, represents the only reliable method for generating accurate data in this context. The ongoing standardization efforts led by organizations like the CDC underscore the critical importance of methodological rigor. For researchers, clinicians, and drug development professionals, the adoption of mass spectrometry-based methods is imperative for advancing our understanding of estrogen's role in postmenopausal health and disease.
Immunoassays have been the preferred method for steroid hormone analysis for more than 50 years, offering high throughput, rapid data turnaround, and low cost for measuring hormone concentrations in biological samples [55]. However, a fundamental limitation of these assays is their susceptibility to interference caused by compounds with structural similarity to the target steroid molecule against which the assay antibodies were generated [56]. This application note examines the clinical significance of cross-reactivity and interference in immunoassays, framed within the broader context of method selection for endocrine measurements in research and drug development.
The persistence of immunoassays in clinical laboratories, despite known limitations, stems from their practical advantages: they can be performed on various standard clinical chemistry analyzers, allowing even small laboratories to conduct analyses on-site [56]. Nevertheless, when compared to liquid chromatography–tandem mass spectrometry (LC-MS/MS)—which provides greater specificity and selectivity for individual steroids—immunoassays demonstrate significant analytical challenges that may compromise research outcomes and clinical decisions [55].
Comparative Method Performance
Quantitative Analysis of Method Agreement
Table 1: Method Comparison Between Immunoassay and LC-MS/MS for Steroid Hormone Measurement
| Hormone | Sample Population | Correlation (r) | Systematic Biases | Clinical Context | Citation |
|---|---|---|---|---|---|
| Estradiol (E2) | 12 Rhesus Macaques | Excellent agreement (Passing-Bablok) | AIA overestimated E2 at >140 pg/mL | Menstrual cycle monitoring | [55] |
| Progesterone (P4) | 12 Rhesus Macaques | Excellent agreement (Passing-Bablok) | AIA underestimated P4 at >4 ng/mL | Menstrual cycle monitoring | [55] |
| Testosterone (T) | 12 Rhesus Macaques | Significantly different | AIA consistently underestimated concentrations | Reproductive hormone assessment | [55] |
| Estradiol (E2) | 6,195 European Men | Moderate (r=0.53-0.76) | Variable by cohort (both over/under-estimation) | Aging male studies | [4] |
| Urinary Free Cortisol | 337 Patients | Strong (r=0.950-0.998) | Proportionally positive bias across all immunoassays | Cushing's syndrome diagnosis | [20] |
Direct comparisons between automated immunoassays (AIAs) and LC-MS/MS reveal complex performance patterns. While some steroid hormones show excellent agreement between methods, others demonstrate significant discrepancies. For example, a study measuring sex hormones in rhesus macaques found excellent agreement for estradiol and progesterone, but significantly different results for testosterone, with AIA consistently underestimating concentrations relative to LC-MS/MS [55]. This indicates that interference effects are hormone-specific and cannot be generalized across all steroid measurements.
In large human studies, moderate correlations between methods have been observed. For estradiol measurements in male subjects, Spearman rank correlation coefficients ranged from 0.53 to 0.76 across three cohorts, demonstrating only moderate agreement between immunoassay and mass spectrometry techniques [4]. These findings highlight the potential for misclassification of hormonal status in research settings, particularly when using immunoassays for low-concentration analytes.
Diagnostic Performance in Clinical Applications
Table 2: Diagnostic Performance of Immunoassays for Urinary Free Cortisol in Cushing's Syndrome Identification
| Analytical Platform | Area Under Curve (AUC) | Cut-off Value (nmol/24 h) | Sensitivity (%) | Specificity (%) | Correlation with LC-MS/MS (r) |
|---|---|---|---|---|---|
| Autobio A6200 | 0.953 | 178.5 | 89.66 | 93.33 | 0.950 |
| Mindray CL-1200i | 0.969 | 272.0 | 93.10 | 96.67 | 0.998 |
| Snibe MAGLUMI X8 | 0.963 | 210.0 | 92.53 | 94.44 | 0.967 |
| Roche 8000 e801 | 0.958 | 235.5 | 90.32 | 95.56 | 0.951 |
| LC-MS/MS (Reference) | - | 150.0 | 94.00 | 93.00 | 1.000 |
Despite analytical limitations, immunoassays can maintain high diagnostic accuracy when properly validated. Recent studies of four new direct immunoassays for urinary free cortisol measurement demonstrated area under the curve (AUC) values exceeding 0.95 for Cushing's syndrome identification, comparable to LC-MS/MS performance [20]. All immunoassays showed strong correlations with LC-MS/MS (Spearman coefficient r = 0.950-0.998), though with proportionally positive biases [20]. This suggests that with appropriate method-specific cut-off values, immunoassays can remain clinically useful while acknowledging their analytical limitations.
Structural Similarity and Cross-Reactivity
The fundamental mechanism underlying immunoassay cross-reactivity is structural similarity between the target analyte and interfering compounds. Cross-reactivity occurs when antibodies bind to molecules that share similar molecular epitopes with the target hormone [56]. Using two-dimensional molecular similarity calculations, researchers have demonstrated that compounds with high cross-reactivity generally show a high degree of structural similarity to the target molecule of the immunoassay [56].
For the Roche Elecsys Cortisol assay, compounds producing strong cross-reactivity (≥5%) include 6β-hydroxycortisol, allotetrahydrocortisol, 21-deoxycortisol, fludrocortisone, prednisolone, and 6-methylprednisolone [56]. These compounds share high structural similarity with cortisol, leading to potentially clinically significant interference, particularly in patients administered synthetic glucocorticoids or with certain endocrine disorders.
Endogenous and Exogenous Interferents
Table 3: Clinically Significant Cross-Reactivity in Steroid Hormone Immunoassays
| Target Assay | Interfering Compound | Cross-Reactivity | Clinical Scenario for Interference | Potential Impact |
|---|---|---|---|---|
| Cortisol | Prednisolone | ≥5% | Patients on glucocorticoid therapy | Falsely elevated cortisol |
| Cortisol | 21-Deoxycortisol | ≥5% | 21-hydroxylase deficiency | Falsely elevated cortisol |
| Cortisol | 11-Deoxycortisol | 0.5-4.9% | 11β-hydroxylase deficiency or metyrapone challenge | Falsely elevated cortisol |
| Testosterone | Methyltestosterone | ≥5% | Patients on anabolic steroids | Falsely elevated testosterone |
| Testosterone | Norethindrone | 0.5-4.9% | Women on progestin therapy | Falsely elevated testosterone |
| Vitamin D | 3-epi-25-OH-D3 | Significant | Newborns, infants, pregnant women | Overestimation of vitamin D status |
| HIV Ag/Ab | SARS-CoV-2 antibodies | Notable correlation | Post-COVID-19 infection or vaccination | False-positive HIV results |
Interference can be categorized by source into endogenous and exogenous compounds. Endogenous interferents include structurally related hormones and their metabolites that accumulate in certain disease states. For example, 21-deoxycortisol produces clinically relevant cross-reactivity for cortisol immunoassays in patients with 21-hydroxylase deficiency, while 11-deoxycortisol may interfere following metyrapone challenge or in 11β-hydroxylase deficiency [56].
Exogenous interferents include pharmaceutical compounds and their metabolites. Prednisolone and 6-methylprednisolone show high cross-reactivity with cortisol immunoassays, potentially causing falsely elevated readings in patients administered these drugs [56]. Similarly, anabolic steroids such as methyltestosterone may produce clinically significant false positives on testosterone immunoassays [56].
Beyond steroid hormones, interference has been documented in other assay systems. A notable example is the cross-reactivity between SARS-CoV-2 antibodies and HIV antigen/antibody assays, which led to increased false-positive HIV results during the COVID-19 pandemic [57]. This demonstrates how immunological responses to unrelated pathogens can create analytical challenges for immunoassay methods.
Experimental Approaches for Interference Assessment
Protocol for Cross-Reactivity Testing
Experimental Protocol 1: Determination of Immunoassay Cross-Reactivity
Principle: Cross-reactivity testing evaluates the ability of structurally similar compounds to produce a signal in the target immunoassay. The percentage cross-reactivity is calculated as the ratio of observed "target" concentration to the amount of test compound added, multiplied by 100.
Materials:
- Test compounds of interest (endogenous metabolites, commonly administered drugs)
- Normal human plasma or serum (preferably pooled from multiple donors)
- Target immunoassay reagents and instrumentation
- Reference standard for target analyte
Procedure:
- Prepare stock solutions of test compounds in appropriate solvent
- Spike test compounds into normal human plasma at clinically relevant concentrations
- Include unadulterated plasma sample as negative control
- Analyze spiked samples and controls using target immunoassay
- Calculate percent cross-reactivity using formula: (measured target concentration / concentration of test compound) × 100
Interpretation:
- Strong Cross-Reactivity: ≥5%
- Weak Cross-Reactivity: 0.5-4.9%
- Very Weak Cross-Reactivity: 0.05-0.49%
- Not Cross-Reactive: <0.05%
Quality Control: Test each sample in duplicate or triplicate to ensure reproducibility. Include quality control materials provided by the manufacturer to verify assay performance [56].
Protocol for Method Comparison Studies
Experimental Protocol 2: Method Comparison Between Immunoassay and LC-MS/MS
Principle: Method comparison studies evaluate the agreement between immunoassay and reference LC-MS/MS methods across clinically relevant concentration ranges.
Materials:
- Patient samples representing the analytical measurement range
- Immunoassay platform with appropriate reagents
- LC-MS/MS system with validated method
- Statistical analysis software (e.g., MedCalc, SPSS)
Procedure:
- Select patient samples covering expected pathological range (e.g., 94 Cushing's syndrome patients and 243 non-CS patients for UFC measurement) [20]
- Analyze all samples using both immunoassay and LC-MS/MS methods within a timeframe that ensures sample stability
- For immunoassay: Follow manufacturer's instructions for calibration and quality control
- For LC-MS/MS: Use validated chromatographic separation with multiple reaction monitoring (MRM) for specific detection [20]
- Apply statistical methods including Passing-Bablok regression, Bland-Altman plots, and Spearman correlation coefficients
Statistical Analysis:
- Passing-Bablok regression: Assess method agreement and systematic differences
- Bland-Altman plots: Visualize bias across concentration range
- Spearman correlation: Evaluate monotonic relationship between methods
- ROC analysis: Compare diagnostic performance for clinical endpoints
Interpretation: Evaluate both analytical performance (correlation, bias) and clinical utility (diagnostic sensitivity/specificity) to determine appropriate applications for each method [55] [20].
The Scientist's Toolkit: Research Reagent Solutions
Table 4: Essential Research Reagents for Interference Assessment Studies
| Reagent / Material | Function | Application Example | Considerations |
|---|---|---|---|
| Stable Isotope-Labeled Internal Standards | Normalization of extraction efficiency and ionization variation in MS | Testosterone-2,3,4-13C3 for LC-MS/MS analysis | Essential for accurate quantification in MS methods |
| Characterized Antibodies | Selective recognition of target analyte in immunoassays | Roche Elecsys assay antibodies | Specificity varies by manufacturer and lot |
| Reference Materials | Method calibration and standardization | NIST Standard Reference Material 972a for vitamin D | Certified reference materials ensure accuracy |
| Structured Analog Compounds | Cross-reactivity assessment | 21-deoxycortisol for cortisol assay interference testing | Should include endogenous metabolites and common drugs |
| Quality Control Materials | Monitoring assay performance over time | Human serum pools spiked with target analytes | Should represent clinically relevant concentrations |
| Sample Preparation Reagents | Extraction and purification of analytes | Ethyl acetate for steroid extraction in UFC measurements | Reduces interference but adds complexity |
Implications for Research and Clinical Practice
The documented limitations of immunoassays have significant implications for both research and clinical practice. In research settings, cross-reactivity and interference can compromise data quality and lead to erroneous conclusions, particularly in studies investigating subtle hormonal differences or drug effects. The finding that C-reactive protein levels associate significantly with immunoassay-measured estradiol but not with MS-measured estradiol in men suggests that inflammation-related factors may interfere with immunoassay performance [4]. This type of interference could potentially confound studies examining relationships between hormonal status and inflammatory conditions.
In clinical practice, awareness of potential interference is essential for appropriate test interpretation. For example, the observation that 3-epi-25-OH-vitamin D3 causes significant cross-reactivity in both immunoassays and non-epimer-separating MS methods highlights the importance of method selection for specific patient populations [58] [59]. This is particularly relevant for pediatric samples, where epimer concentrations are typically higher.
Cross-reactivity and interference represent fundamental limitations of immunoassays that researchers and clinicians must acknowledge in study design and result interpretation. While immunoassays offer practical advantages of throughput, cost, and accessibility, their limitations become particularly significant in scenarios involving low hormone concentrations, specific patient populations, or potential interferents. LC-MS/MS provides superior specificity and should be considered the reference method for research endpoints and clinical scenarios where analytical accuracy is paramount.
The decision between immunoassay and mass spectrometry methods should be guided by the specific research question, required precision, sample matrix, population characteristics, and available resources. As technological advances continue to improve both immunoassay specificity and mass spectrometry accessibility, ongoing comparative studies will remain essential for establishing appropriate application boundaries for each method.
Technical Complexity and Cost-Benefit Analysis of Mass Spectrometry Implementation
The choice of analytical technique is pivotal in endocrine research, directly impacting the reliability, scope, and cost of scientific and clinical findings. For decades, immunoassays have been the cornerstone for hormone measurement due to their operational simplicity and high throughput. However, challenges with specificity, standardization, and limited multiplexing capabilities have prompted the exploration of more robust technologies [5] [60]. Mass spectrometry (MS), particularly liquid chromatography-tandem mass spectrometry (LC-MS/MS), has emerged as a powerful alternative, offering superior specificity, accuracy, and the ability to simultaneously analyze multiple analytes. This application note provides a detailed technical and economic comparison of these platforms, framed within the context of endocrine research, to guide researchers and drug development professionals in making informed implementation decisions.
Technical Comparison: Mass Spectrometry vs. Immunoassay
A direct comparative study of salivary sex hormone analysis revealed fundamental performance differences between the two techniques. The study found poor performance of enzyme-linked immunosorbent assay (ELISA) for measuring salivary estradiol and progesterone, with these hormones being "much less valid than testosterone." Despite its technical challenges, LC-MS/MS was found to be superior, underscoring the importance of methodological rigor for generating reliable data on the relationships between hormones, brain, behavior, and mental health [5].
Performance Characteristics
The table below summarizes the core technical characteristics of each platform relevant to endocrine measurements.
Table 1: Technical Performance Characteristics for Endocrine Measurements
| Characteristic | Mass Spectrometry (LC-MS/MS) | Immunoassay (e.g., ELISA, CLIA) |
|---|---|---|
| Specificity | High (separates by chromatographic retention time and mass) | Moderate (subject to antibody cross-reactivity) |
| Sensitivity | High (capable of detecting low pg/mL levels) | High (capable of detecting low pg/mL levels) |
| Multiplexing Capability | High (can simultaneously quantify dozens of analytes) | Low to Moderate (typically single-analyte or limited panels) |
| Throughput | Moderate (requires chromatographic separation) | High (amenable to full automation in 96/384-well plates) |
| Sample Volume | Low (typically 10-100 µL) | Low to Moderate (typically 50-200 µL) |
| Dynamic Range | Wide (4-5 orders of magnitude) | Narrow (2-3 orders of magnitude) |
Data Quality and Measurement Uncertainty
The technical differences significantly impact data quality. A multicentric study evaluating 25-hydroxyvitamin D (25-(OH)D) assays found that LC-MS/MS methods consistently met all analytical performance specifications (APS). While several immunoassays also achieved acceptable measurement uncertainty, others exhibited significant bias or inter-laboratory variability [60]. The study highlighted that measurement uncertainty remains a major challenge for 25-(OH)D immunoassays, with only slightly more than half meeting the desirable measurement uncertainty threshold of ≤10%, while four exceeded the minimum acceptable limit of ≤15% [60]. This variability can obscure clinically meaningful changes, such as the 31.6% physiological increase in 25-(OH)D concentrations observed over 10 weeks due to seasonal sun exposure [60].
Cost-Benefit Analysis
Implementing a new technology requires a thorough understanding of both initial investment and ongoing operational costs.
Economic Cost Breakdown
A 2024 micro-costing study for a quantitative proteomics diagnostic test provides a detailed breakdown of MS-based analysis. The mean cost per patient was $897 AUD (approximately $607 USD), with labor constituting the largest portion at 53% of the total costs [61]. The single most expensive non-salary component was the LC-MS/MS analysis itself, at $342 AUD (approximately $228 USD) per patient [61]. These figures encompass the entire workflow from sample isolation to data reporting.
Table 2: Cost Structure of a Mass Spectrometry-Based Proteomics Test
| Cost Component | Approximate Percentage of Total Cost | Key Elements |
|---|---|---|
| Labor | 53% | Sample preparation, instrument operation, data analysis, reporting. |
| Consumables | Part of 47% | Plasticware, reagents, buffers, chromatography columns. |
| Equipment & Depreciation | Part of 47% | LC-MS/MS instrument, centrifuges, incubators; cost is per sample based on equipment lifetime and utilization. |
| LC-MS/MS Analysis (Sub-total) | ~38% of total cost | Instrument time, consumables, and labor specific to the LC-MS/MS step. |
Market Context and Growth Trends
The market dynamics for both technologies reflect their evolving roles. The global mass spectrometry market is projected to grow from USD 6.33 billion in 2024 to USD 9.62 billion by 2030, at a compound annual growth rate (CAGR) of 7.2% [62]. This growth is driven by its applications in drug discovery, omics research, and environmental testing [62] [63]. In contrast, the U.S. immunoassay market, valued at USD 9.43 billion in 2025, is expected to grow at a slightly slower CAGR of 4.93% through 2034, reaching USD 14.22 billion [64]. The immunoassay market's growth is fueled by factors including the launch of more compact and efficient systems, the rising prevalence of chronic and infectious diseases, and expansion in point-of-care testing [64] [65].
Experimental Protocols for Endocrine Research
This section provides a foundational protocol for MS-based analysis of steroid hormones in biological fluids, adapted from general proteomics and quantitative imaging protocols [66] [67].
Sample Preparation for Quantitative Analysis of Steroid Hormones
Principle: Proteins in a sample are precipitated, and steroids are extracted using organic solvents. The extract is then analyzed by LC-MS/MS.
Materials & Reagents:
- Internal Standards: Deuterated or 13C-labeled analogues of target steroid hormones (e.g., d5-testosterone, d9-progesterone).
- Precipitation Solvent: HPLC-grade methanol or acetonitrile.
- Solid Phase Extraction (SPE) Cartridges: C18 or mixed-phase cartridges.
- LC-MS/MS Mobile Phases: Water and methanol or acetonitrile, both with 0.1% formic acid.
- Calibrators: Pure steroid hormone standards at known concentrations.
Protocol Steps:
- Sample Aliquot: Transfer 100-200 µL of serum, plasma, or saliva to a microcentrifuge tube.
- Protein Precipitation: Add a 3:1 volume of ice-cold methanol containing the internal standards. Vortex vigorously for 60 seconds.
- Centrifugation: Centrifuge at >14,000 x g for 10 minutes at 4°C to pellet precipitated proteins.
- Supernatant Transfer: Transfer the clear supernatant to a new tube.
- Evaporation: Evaporate the supernatant to dryness under a gentle stream of nitrogen gas in a 37°C water bath.
- Reconstitution: Reconstitute the dry residue in 100 µL of a 20:80 (v/v) methanol/water mixture. Vortex thoroughly.
- LC-MS/MS Analysis: Inject the reconstituted sample into the LC-MS/MS system.
Liquid Chromatography-Tandem Mass Spectrometry (LC-MS/MS) Analysis
Instrumentation: Triple quadrupole mass spectrometer coupled to an ultra-high-performance liquid chromatography (UHPLC) system.
Chromatography Conditions:
- Column: C18 reversed-phase column (e.g., 2.1 x 50 mm, 1.8 µm).
- Mobile Phase A: Water with 0.1% formic acid.
- Mobile Phase B: Methanol with 0.1% formic acid.
- Gradient: 30% B to 95% B over 5-10 minutes.
- Flow Rate: 0.4 mL/min.
- Column Temperature: 40°C.
Mass Spectrometry Conditions:
- Ionization Mode: Electrospray Ionization (ESI), positive mode.
- Data Acquisition: Multiple Reaction Monitoring (MRM).
- Source Parameters: Optimize for gas flow, temperature, and ion spray voltage.
- MRM Transitions: Define precursor ion > product ion transitions for each target steroid and its corresponding internal standard.
Quantification:
- Generate a calibration curve by analyzing calibrators at a minimum of six concentration levels.
- The ratio of the analyte peak area to the internal standard peak area is used for quantification against the calibration curve.
Workflow Visualization
The following diagrams illustrate the core workflows and decision-making process for implementing these technologies.
MS-based Hormone Analysis Workflow
Diagram 1: MS Hormone Analysis Workflow. The process from sample preparation to final reporting.
Platform Selection Decision Tree
Diagram 2: Platform Selection Guide. A decision tree for choosing between MS and immunoassay.
The Scientist's Toolkit: Essential Research Reagent Solutions
Successful implementation of mass spectrometry for endocrine analysis relies on a suite of specialized reagents and materials.
Table 3: Essential Research Reagents for MS-based Endocrine Analysis
| Reagent/Material | Function | Key Considerations |
|---|---|---|
| Stable Isotope-Labeled Internal Standards (SIL-IS) | Corrects for matrix effects and losses during sample preparation; enables precise quantification. | Deuterated (d) or 13C-labeled analogues of target analytes (e.g., d5-Testosterone). Purity and isotopic enrichment are critical. |
| LC-MS/MS Grade Solvents | Used for sample preparation, extraction, and as mobile phases for chromatography. | High purity (e.g., Optima LC/MS grade) minimizes background noise and ion suppression. |
| Solid Phase Extraction (SPE) Cartridges | Purify and concentrate analytes from complex biological matrices. | Choice of sorbent (e.g., C18, mixed-mode) depends on the chemical properties of the target steroids. |
| Chromatography Columns | Separate analytes from each other and from matrix interferences prior to MS detection. | Reversed-phase C18 columns are standard. Particle size (e.g., 1.8 µm) and column dimensions affect resolution and speed. |
| Calibrators & Quality Controls (QCs) | Establish the calibration curve and monitor assay performance. | Prepared in stripped matrix. QCs at low, medium, and high concentrations are run with each batch. |
The decision to implement mass spectrometry over immunoassay for endocrine measurements involves a careful trade-off between analytical performance and economic factors. MS provides unmatched specificity, the ability to conduct multiplexed analyses, and a lower potential for measurement uncertainty, making it the superior choice for research requiring high data fidelity, discovery of novel biomarkers, or resolution of complex clinical cases [5] [60]. However, this comes with a higher initial capital investment, increased operational complexity, and a need for specialized expertise [61].
Immunoassays remain a powerful tool for high-throughput, routine testing where established assays demonstrate sufficient specificity and where the lower per-test cost and operational simplicity are primary concerns. The emerging trend of automation and the integration of artificial intelligence (AI) in immunoassays is helping to improve their data analysis and operational efficiency, ensuring their continued relevance [64]. Ultimately, the choice of platform should be guided by the specific analytical questions, required data quality, available budget, and technical infrastructure. For laboratories embarking on new endocrine research programs where precision and multiplexing are critical, investing in mass spectrometry capabilities offers a compelling long-term advantage.
In the field of clinical endocrinology, the debate between mass spectrometry and immunoassay for hormone measurement is central to research and diagnostic accuracy. Immunoassays, while widely used, are often plagued by issues of specificity and standardization, particularly for steroid hormones [10]. Liquid chromatography-tandem mass spectrometry (LC-MS/MS) has emerged as a reference method, offering superior specificity and sensitivity, which is critical for accurate diagnosis and patient monitoring [68] [10]. The Centers for Disease Control and Prevention's Clinical Standardization Programs (CDC CSP) play a pivotal role in ensuring the accuracy and reliability of these measurements through rigorous standardization programs. These initiatives are vital for establishing metrological traceability to the highest reference standards, thereby enabling comparable and trustworthy results across different laboratory methods and platforms [68] [69] [70]. This application note details the protocols and frameworks established by the CDC CSP to support method comparison and validation in endocrine research.
CDC Standardization Programs for Hormone Measurements
The CDC CSP operates comprehensive programs specifically designed to improve the analytical performance of hormone tests. The primary goals are to provide metrological reference measurements and to assess and certify the performance of routine methods used in patient care, research, and public health [68]. The programs are structured into distinct phases and services to achieve this.
The HoSt (Hormone Standardization) Program is a two-phase process for verifying the traceability of laboratory measurements. HoSt Phase 1 involves an initial assessment of a method's accuracy, while HoSt Phase 2 verifies its long-term performance [68]. Alongside this, the Accuracy-Based Monitoring Program (AMP) allows for continuous surveillance of measurement accuracy over time as laboratories analyze provided samples alongside their regular patient specimens [68].
A core activity of the CDC CSP is the operation of the Hormones Reference Laboratory, which maintains highly precise and accurate Reference Measurement Procedures (RMPs) for total testosterone and estradiol in serum [69]. These RMPs, which employ High Performance Liquid Chromatography (HPLC) coupled with tandem mass spectrometry (MS/MS), are calibrated using certified reference materials from national metrology institutes. This establishes traceability to the International System of Units (SI), in accordance with international standards like ISO 17511 [69]. The reference laboratory uses these RMPs to assign target values to serum samples, which are then used by manufacturers and laboratories to calibrate their own routine methods, thereby establishing a chain of traceability [69] [70].
For researchers, the CDC CSP offers critical services, including providing single-donor materials with reference information for self-assessment and supplying customized blinded quality control samples to monitor the accuracy of measurements within research studies [68] [71].
Table 1: Key CDC Clinical Standardization Programs and Services for Hormone Testing
| Program/Service Name | Primary Function | Target Analytes | Key Features |
|---|---|---|---|
| HoSt Program [68] | Certification of analytical performance | Testosterone, Estradiol | Two independent phases (1 & 2) for initial and ongoing verification of traceability |
| Accuracy-Based Monitoring (AMP) [68] | Long-term accuracy monitoring | Testosterone, Estradiol | Blinded samples analyzed with patient specimens to monitor performance over time |
| Hormones Reference Laboratory [69] | Provide reference measurement services | Testosterone, Estradiol | SI-traceable RMPs using HPLC-MS/MS; assigns values to calibration materials |
| Quality Control Materials [71] | Method verification & characterization | Testosterone, Estradiol, 25-OH-Vitamin D, others | Includes sample sets for detailed method validation; customization available |
Figure 1: Hierarchy of Metrological Traceability and CDC Monitoring in Hormone Testing. This diagram illustrates the flow from highest-level reference materials to standardized patient results, showing how CDC programs ensure accuracy across the calibration chain.
Reference Measurement Procedures and LC-MS/MS Methodology
The cornerstone of the CDC's standardization effort is its reference measurement procedures based on LC-MS/MS technology. This section outlines the experimental protocol for such a reference method, using the measurement of total testosterone in human serum as an exemplar.
Experimental Protocol: Determination of Total Testosterone in Human Serum by LC-MS/MS
Principle: Serum samples are subjected to liquid-liquid extraction to isolate testosterone. The extract is then chromatographically separated using high-performance liquid chromatography and detected via tandem mass spectrometry using stable isotope-labeled testosterone as an internal standard for accurate quantification [69].
Materials and Reagents:
- Calibrators: Certified reference materials (e.g., A-NMI M914b for testosterone) [69].
- Internal Standard: Testosterone-13C3 or testosterone-d3.
- Quality Controls: Charcoal-stripped human serum spiked with known concentrations of testosterone.
- Solvents: High-purity methanol, ethanol, methyl-tert-butyl ether (MTBE).
- Water: Type I, HPLC grade.
- Mobile Phases: Ammonium acetate buffer, methanol, and/or acetonitrile (HPLC grade).
Instrumentation:
- HPLC System: Binary or quaternary pump, autosampler, and column oven.
- Analytical Column: Reversed-phase C18 column (e.g., 100 x 2.1 mm, 1.8 µm particle size).
- Mass Spectrometer: Triple quadrupole mass spectrometer with electrospray ionization (ESI) source operating in positive ion mode.
Procedure:
- Sample Preparation: Aliquot 500 µL of serum sample, calibrator, or quality control into a labeled tube.
- Internal Standard Addition: Add a known volume (e.g., 25 µL) of the internal standard working solution to each tube.
- Liquid-Liquid Extraction:
- Add 2 mL of MTBE to each tube.
- Vortex mix for 10 minutes.
- Centrifuge at 3500 rpm for 5 minutes to separate phases.
- Transfer the organic (upper) layer to a new clean tube.
- Evaporate the extract to dryness under a gentle stream of nitrogen in a water bath at 40°C.
- Reconstitution: Reconstitute the dry residue with 100 µL of methanol/water (50:50, v/v) and vortex mix thoroughly.
- LC-MS/MS Analysis:
- Chromatography: Inject an aliquot (e.g., 10 µL) onto the HPLC column. Use a gradient elution with water and methanol at a flow rate of 0.4 mL/min and a column temperature of 40°C.
- Mass Spectrometry: Analyze using multiple reaction monitoring (MRM). The precursor ion for testosterone is m/z 289.2. The primary product ions for quantification are m/z 97.0 and 109.0.
- Quantification: Plot the peak area ratio (analyte/internal standard) of the calibrators against their known concentrations to generate a linear calibration curve. The concentration of testosterone in unknown samples is calculated from this curve.
Table 2: Research Reagent Solutions for LC-MS/MS Hormone Analysis
| Item Name | Function/Description | Critical Specifications |
|---|---|---|
| Certified Reference Material (CRM) [69] | Primary calibrator for establishing SI-traceability | Certified purity and concentration; e.g., A-NMI M914b for testosterone |
| Stable Isotope-Labeled Internal Standard | Corrects for sample loss and ion suppression during MS analysis | Isotopic purity >99%; e.g., Testosterone-d3 |
| Charcoal-Stripped Serum | Matrix for preparing calibration standards and quality controls | Confirmed low endogenous hormone levels |
| High-Purity Solvents | Used for extraction, reconstitution, and mobile phases | HPLC or MS-grade to minimize background interference |
| Quality Control (QC) Materials | Monitors analytical performance across batches | Three levels (low, medium, high) covering clinical decision points |
Comparative Evaluation of Immunoassay and LC-MS/MS Performance
Robust method comparison studies are essential for validating new assays or understanding the limitations of existing platforms. The following protocol and data illustrate a standardized approach for such an evaluation.
Experimental Protocol: Method Comparison for Urinary Free Cortisol
Objective: To compare the analytical performance of four new direct immunoassays against a reference LC-MS/MS method for diagnosing Cushing's syndrome [10].
Study Design:
- Sample Collection: Obtain 24-hour urine samples from a cohort of participants, including both patients with Cushing's syndrome and non-CS controls (e.g., n=337 total: 94 CS, 243 non-CS) [10]. Secure ethical approval and informed consent.
- Sample Analysis: Measure urinary free cortisol (UFC) in all samples using the following methods:
- Reference Method: A laboratory-developed LC-MS/MS method.
- Test Methods: Four new direct immunoassays on automated platforms (e.g., Autobio A6200, Mindray CL-1200i, Snibe MAGLUMI X8, Roche 8000 e801).
- Statistical Analysis:
- Correlation: Assess the relationship between each immunoassay and LC-MS/MS using Spearman's rank correlation coefficient.
- Bias Estimation: Use Passing-Bablok regression and Bland-Altman plots to determine systematic and proportional bias.
- Diagnostic Accuracy: Perform Receiver Operating Characteristic (ROC) curve analysis to determine the optimal cut-off value, sensitivity, and specificity for each assay in identifying Cushing's syndrome.
Results from a Representative Study (Zhang et al.): The quantitative outcomes from the cited study are summarized in the table below [10].
Table 3: Quantitative Comparison of Immunoassays vs. LC-MS/MS for Urinary Free Cortisol
| Measurement Platform | Correlation with LC-MS/MS (Spearman r) | Observed Bias | ROC Area Under Curve (AUC) | Diagnostic Cut-off (nmol/24h) | Sensitivity (%) | Specificity (%) |
|---|---|---|---|---|---|---|
| Autobio A6200 | 0.950 | Proportional positive bias | 0.953 | 178.5 | 89.66 | 93.33 |
| Mindray CL-1200i | 0.998 | Proportional positive bias | 0.969 | 272.0 | 93.10 | 96.67 |
| Snibe MAGLUMI X8 | 0.967 | Proportional positive bias | 0.963 | 211.5 | 89.66 | 95.00 |
| Roche 8000 e801 | 0.951 | Proportional positive bias | 0.958 | 211.5 | 89.66 | 95.00 |
| Reference LC-MS/MS | 1.000 (Reference) | N/A | N/A | Varies by lab | N/A | N/A |
Conclusion: While all four immunoassays showed strong correlation and high diagnostic accuracy for Cushing's syndrome, they consistently exhibited a proportional positive bias compared to the LC-MS/MS reference method. This underscores the critical need for method-specific cut-off values for clinical decision-making and highlights the role of LC-MS/MS as the arbiter of analytical accuracy [10].
Considerations for Research Study Design
When incorporating endocrine measurements into research, controlling for biological and procedural-analytic variance is paramount to obtaining valid results. Key factors to consider include [72]:
- Biologic Variation: Factors such as sex, age, body composition, and mental health status can significantly influence resting hormonal levels and their responses to interventions. Participant groups should be matched for these variables to reduce inter-individual variability [72].
- Circadian Rhythms: Many hormones, such as cortisol, exhibit strong diurnal fluctuations. Consistent timing of sample collection across all participants is essential for valid comparisons [72].
- Menstrual Cycle Status: In premenopausal females, the phase of the menstrual cycle profoundly affects reproductive hormone levels. Researchers should either test participants in a standardized phase or account for cycle phase in the statistical analysis [72].
- Specimen Handling: Procedures for sample collection, processing, and storage must be standardized to prevent pre-analytical degradation of labile analytes.
Figure 2: Key Factors Influencing Variance in Endocrine Research Measurements. Controlling for both biologic and procedural-analytic factors is essential to reduce variance and ensure the validity of hormonal data in research studies.
The standardization efforts led by the CDC CSP, anchored by SI-traceable reference measurement procedures using LC-MS/MS, are fundamental to advancing endocrine research and diagnostics. While modern immunoassays show good diagnostic concordance, the proportional positive biases observed in comparative studies reinforce the necessity of LC-MS/MS as the reference standard for achieving the highest order of accuracy [10]. Researchers are strongly encouraged to utilize the CDC's resources—including reference materials, certification programs (HoSt), and monitoring services (AMP)—to validate their analytical methods, ensure the comparability of their data, and contribute to the broader goal of standardized, reliable hormone measurement across all platforms [68] [71]. Future directions of the CDC CSP include developing reference methods for emerging biomarkers such as parathyroid hormone (PTH) and free testosterone, which will further refine our ability to make accurate clinical assessments [71].
Head-to-Head Validation: Performance Data and Diagnostic Accuracy
The accurate measurement of 24-hour urinary free cortisol (UFC) is a critical component in the diagnostic workflow for Cushing's syndrome (CS), a rare endocrine disorder characterized by chronic cortisol excess [43]. For decades, immunoassays have served as the primary methodological approach for UFC determination in clinical laboratories, though these assays have been hampered by issues of specificity due to cross-reactivity with structurally similar steroid metabolites [43] [73]. Liquid chromatography-tandem mass spectrometry (LC-MS/MS) has emerged as a reference method due to its superior specificity, yet its adoption is limited by cost, complexity, and throughput constraints [20] [74].
A significant advancement in immunoassay technology has been the development of high-specificity antibodies and improved standardization. This study provides a direct comparative evaluation of four new, commercially available immunoassays—Autobio A6200, Mindray CL-1200i, Snibe MAGLUMI X8, and Roche 8000 e801—against a laboratory-developed LC-MS/MS method for UFC measurement, assessing both their analytical agreement and diagnostic performance for identifying Cushing's syndrome [20] [10] [30].
Methodologies and Experimental Protocols
Patient Cohort and Sample Collection
The study utilized residual 24-hour urine samples from a well-characterized patient cohort [20] [30].
- Participants: 337 patients, comprising 94 with confirmed Cushing's syndrome and 243 non-CS patients (controls).
- Diagnostic Criteria: CS diagnosis was established per Endocrine Society guidelines, based on clinical symptoms, abnormal circadian cortisol rhythms, and at least two confirmatory tests (e.g., elevated UFC, lack of cortisol suppression with dexamethasone, imaging findings, and/or histopathology) [43] [20].
- Sample Handling: Urine samples were aliquoted and stored at -80°C until analysis to preserve analyte integrity [20].
Liquid Chromatography-Tandem Mass Spectrometry (LC-MS/MS) Protocol
The LC-MS/MS method served as the reference procedure due to its high specificity [43] [20].
- Sample Preparation: Urine samples were diluted 20-fold with pure water. A 200 µL aliquot of the diluted sample was mixed with 20 µL of internal standard (cortisol-d4, 25 ng/mL).
- Instrumentation: Analysis was performed using a SCIEX Triple Quad 6500+ LC-MS/MS system.
- Chromatography: Separation was achieved on an ACQUITY UPLC BEH C8 column (1.7 µm, 2.1 × 100 mm) with a mobile phase of water (A) and methanol (B).
- Mass Spectrometry: Detection employed positive electrospray ionization with multiple reaction monitoring (MRM). The quantifier transitions were m/z 363.2→121.0 for cortisol and m/z 367.2→121.0 for the internal standard.
- Method Validation: The assay demonstrated a linear range of 0.69–11,040.00 nmol/L, with imprecision (CV) of less than 2.27% and recovery between 100.43% and 103.10% [43] [20].
Immunoassay Protocols
The four evaluated immunoassays were all direct methods, requiring no organic solvent extraction prior to analysis [20] [30]. Key characteristics are summarized in Table 1, and the general workflow is illustrated in Figure 1.
Table 1: Characteristics of the Four Evaluated Direct Immunoassays
| Platform | Assay Principle | Traceability | Linear Range (nmol/L) | Reported CV |
|---|---|---|---|---|
| Autobio A6200 | Competitive Chemiluminescence | Manufacturer's Calibrator | 2.76 – 1,655.16 | ≤ 2.59 % |
| Mindray CL-1200i | Sandwich Chemiluminescence | NIST 921A | 11.03 – 1,655.16 | ≤ 5 % |
| Snibe MAGLUMI X8 | Competitive Chemiluminescence | Manufacturer's Calibrator | 11.03 – 1,655.16 | ≤ 5 % |
| Roche 8000 e801 | Competitive Electrochemiluminescence | NIST 921A | 7.5 – 500 | ≤ 3.1 % |
Figure 1: Experimental workflow for the simultaneous analysis of urinary free cortisol by direct immunoassays and LC-MS/MS.
Data Analysis
- Method Comparison: Passing-Bablok regression and Bland-Altman plot analyses were used to assess the agreement between each immunoassay and the LC-MS/MS reference method. The Spearman correlation coefficient (r) was calculated.
- Diagnostic Performance: Receiver operating characteristic (ROC) curve analysis was performed to evaluate the ability of each method to discriminate between CS and non-CS patients. The area under the curve (AUC), optimal cut-off value (determined by Youden's index), sensitivity, and specificity were calculated [20] [30].
Results and Data Analysis
Analytical Performance and Method Comparison
All four new direct immunoassays showed strong correlations with LC-MS/MS, as detailed in Table 2. The Mindray assay demonstrated near-perfect correlation (r=0.998), while the others also exhibited strong agreement (r ≥ 0.950) [20] [10] [30]. Despite this strong correlation, all immunoassays exhibited a proportional positive bias compared to LC-MS/MS, meaning they consistently yielded higher UFC values [20]. This is a known phenomenon attributed to residual cross-reactivity with cortisol metabolites in immunoassays [73].
Table 2: Analytical and Diagnostic Performance of UFC Measurement Methods
| Method | Spearman's r vs. LC-MS/MS | ROC AUC | Optimal Cut-off (nmol/24h) | Sensitivity (%) | Specificity (%) |
|---|---|---|---|---|---|
| LC-MS/MS (Reference) | - | 0.972 [43] | - | - | - |
| Autobio A6200 | 0.950 | 0.953 | 221.0 | 89.7 | 93.3 |
| Mindray CL-1200i | 0.998 | 0.969 | 178.5 | 93.1 | 96.7 |
| Snibe MAGLUMI X8 | 0.967 | 0.963 | 272.0 | 89.7 | 95.0 |
| Roche 8000 e801 | 0.951 | 0.958 | 221.0 | 89.7 | 95.0 |
| Abbott Architect (from prior study) | 0.965 [43] | 0.975 [43] | 154.8 [43] | - | - |
Diagnostic Accuracy for Cushing's Syndrome
The diagnostic performance of all four immunoassays for identifying CS was high and comparable to that of LC-MS/MS, as reflected by AUC values all exceeding 0.95 [20] [30]. The Mindray assay showed the highest AUC (0.969), sensitivity (93.1%), and specificity (96.7%) among the four new platforms. A key finding was the significant variation in optimal diagnostic cut-off values across the different immunoassays, ranging from 178.5 to 272.0 nmol/24h (Table 2). This underscores the critical importance of using method-specific reference intervals in clinical practice [20].
The Scientist's Toolkit: Research Reagent Solutions
Table 3: Essential Materials and Reagents for UFC Measurement
| Item | Function & Application | Example/Note |
|---|---|---|
| Anti-Cortisol Antibodies | Core binding reagent in immunoassays; specificity is paramount. | New assays use high-specificity monoclonal antibodies to reduce cross-reactivity [20]. |
| Stable Isotope-Labeled Internal Standard (Cortisol-d4) | Essential for LC-MS/MS; corrects for sample loss and matrix effects. | Toronto Research Chemicals; used for accurate quantification [43] [74]. |
| Chromatography Column | Separates cortisol from interfering substances in the urine matrix. | ACQUITY UPLC BEH C8 (1.7 µm, 2.1×100 mm) [43] [20]. |
| Certified Reference Materials & Calibrators | Establishes the analytical measurement traceability and calibration curve. | Traceable to manufacturer's standard or NIST SRM 921a [20]. |
| Quality Control (QC) Materials | Monitors daily assay precision and accuracy. | Commercial QC sera at multiple levels (e.g., Bio-Rad Liquichek) [43]. |
This direct comparison demonstrates that the latest generation of direct immunoassays for UFC measurement exhibits excellent analytical consistency and high diagnostic accuracy for Cushing's syndrome compared to the LC-MS/MS reference method [20] [30]. The elimination of the laborious and hazardous organic solvent extraction step simplifies laboratory workflows significantly without compromising diagnostic utility, making these assays highly suitable for high-volume clinical laboratories [20].
The persistent positive bias observed with immunoassays, while not negating their diagnostic power, highlights that UFC values are method-dependent [73]. Consequently, the establishment and application of method-specific reference intervals and diagnostic cut-offs are non-negotiable for ensuring correct clinical interpretation [20] [30]. The findings indicate that for CS identification, these new direct immunoassays are reliable alternatives to LC-MS/MS, improving accessibility to accurate UFC testing.
Future efforts should focus on multi-center studies to further validate these findings across diverse populations and laboratory settings. Furthermore, continuous improvement of antibody specificity and ongoing standardization programs will be crucial to further minimize inter-method differences and improve the harmonization of UFC results worldwide [20].
Accurate measurement of serum 25-hydroxyvitamin D (25-(OH)D) is essential for clinical evaluations of vitamin D status. The growing demand for vitamin D testing has highlighted significant methodological challenges, particularly concerning measurement uncertainty (MU) and the reliability of results across different testing platforms [75]. Liquid chromatography-tandem mass spectrometry (LC-MS/MS) is recognized for its high specificity and sensitivity, serving as a reference method for 25-(OH)D quantification [76]. However, automated immunoassays remain widely used in clinical laboratories due to their operational convenience and high throughput, despite concerns about their performance relative to reference methods [77].
This document provides detailed Application Notes and Protocols for evaluating 25-(OH)D assay performance, focusing on the critical assessment of measurement uncertainty. It synthesizes findings from recent multicentre studies to guide researchers, scientists, and drug development professionals in selecting, validating, and interpreting vitamin D testing methods within the broader context of endocrine measurement research.
Key Concepts and Performance Specifications
Measurement Uncertainty and Standardization Initiatives
Measurement Uncertainty (MU) provides a quantitative indicator of the reliability of a test result, integrating both random (imprecision) and systematic (bias) errors into a single metric. It offers a more comprehensive performance assessment than evaluating bias or imprecision alone [75] [78]. For 25-(OH)D testing, understanding MU is crucial for determining whether observed changes in serial measurements represent true physiological changes or merely analytical variation [78].
Major standardization programs, including the Vitamin D Standardization Program (VDSP) and its certification arm (VDSCP), work to minimize inter-assay variability and improve result comparability across laboratories and methods [75] [78]. These programs establish stringent Analytical Performance Specifications (APS). For certification, the VDSP requires a method's calibration bias to be within ±5% of the Centers for Disease Control and Prevention (CDC) Reference Measurement Procedure (RMP), with an imprecision (coefficient of variation, CV) of less than 10% [78].
Establishing Performance Goals Based on Biological Variation
The IFCC–IOF Committee on Bone Metabolism has proposed a novel approach for deriving APS based on the physiological variation of 25-(OH)D. Data from the European Biological Variation Study (EuBIVAS) show that 25-(OH)D concentrations in healthy individuals naturally increase by approximately 31.6% over a 10-week period (April–June) due to seasonal sun exposure [78].
An assay must have sufficiently low MU to detect this physiologically relevant change with statistical confidence. The required MU can be calculated for different probabilities of detection (p), with corresponding Z-scores determining the maximum permissible MU [78]:
- Likely detection (p > 0.80) → Z = 0.84 → MU ≤ 26.5%
- More than likely detection (p > 0.90) → Z = 1.28 → MU ≤ 17.4%
- Very likely detection (p > 0.95) → Z = 1.65 → MU ≤ 13.6%
- Virtually certain detection (p > 0.99) → Z = 2.33 → MU ≤ 9.6%
The Joint Committee for Traceability in Laboratory Medicine Task Force (JCTLM TF-RMSI) has set formal MU thresholds: a desirable MU of ≤10% and a minimum acceptable MU of ≤15% for clinical samples [75] [78].
Experimental Protocols for Method Comparison
The following protocol is adapted from a recent multicentre evaluation study designed to rigorously assess the measurement uncertainty of various 25-(OH)D assays [75] [78].
Sample Preparation and Panel Design
- Pooled Serum Samples: Prepare a collection of 17 pooled serum samples by combining at least 10 remnant fresh patient samples per pool. Select samples to create a concentration range from the limit of quantification (LOQ) of most methods to approximately 100 μg/L.
- Single-Donor Samples: Acquire eight single-donor serum samples from a commercial biobank, selected based on nominal 25-(OH)D concentrations to supplement the pooled panel.
- Aliquoting and Storage: Centrifuge pools at 4,000 × g for 10 minutes after thawing and homogenization. Aliquot 500 μL of each sample into cryogenic tubes. Store all aliquots at -80°C until shipment on dry ice to participating laboratories.
Testing Methodology and Laboratory Network
- Reference Method: Use the University of Ghent's reference measurement procedure (RMP) as the primary reference method. Measure all samples in duplicate for 25-(OH)D3 concentration. (Note: 25-(OH)D2 may be omitted if sample volume is limited) [78].
- LC-MS/MS Methods: Include at least two distinct LC-MS/MS methods, developed and operated by independent clinical laboratories (e.g., CHU de Liège, Amsterdam UMC). These methods should separately quantify 25-(OH)D3 and 25-(OH)D2 where possible [75] [78].
- Immunoassays: Evaluate a wide range of automated immunoassays (e.g., from Abbott, DiaSorin, Roche, Siemens, Beckman-Coulter). Each method should be tested in two independent laboratories to assess inter-laboratory variability. Manual methods should be performed by two different experienced technicians [78].
- Replication Scheme: Each participating laboratory receives two aliquots of each sample and performs measurements in duplicate over two consecutive days, yielding n=4 determinations per sample per laboratory/method [78].
Data Analysis and MU Calculation
- Imprecision and Bias: Calculate the imprecision (as CV%) and bias (%) for each method relative to the assigned RMP value for each sample.
- Measurement Uncertainty: Compute the expanded measurement uncertainty (U) for each method. This is derived from the combined standard uncertainty (uc), which itself incorporates both standard uncertainty due to imprecision (uIMP) and bias (uBIAS), following the ISO 20914 guideline [78].
- Graphical Representation: Implement a novel graphical approach to visualize the MU of each method across the tested concentration range, overlaying the clinical decision thresholds for vitamin D deficiency and sufficiency. This provides an intuitive tool for assessing clinical reliability [75] [79].
Comparative Performance Data
The following tables summarize key quantitative findings from recent studies comparing the performance of LC-MS/MS and immunoassay methods.
Table 1: Performance of 25-(OH)D Assays Against Analytical Performance Specifications (2025 Multicentre Study) [75] [78]
| Method Category | Number of Methods Evaluated | Met VDSP APS (Bias ±5%, CV <10%) | Met JCTLM Desirable MU (≤10%) | Met JCTLM Minimum MU (≤15%) | Met IFCC Physiological MU (≤13.6% for p>0.95) |
|---|---|---|---|---|---|
| LC-MS/MS | 2 | 2/2 (100%) | 2/2 (100%) | 2/2 (100%) | 2/2 (100%) |
| All Immunoassays | 13 | Not Reported | ~50% | ~70% | Similar subset as JCTLM |
| Exemplar Immunoassays | |||||
| ∟ DiaSorin Liaison | 1 | Yes | Yes | Yes | Yes |
| ∟ Roche Cobas | 1 | Yes | Yes | Yes | Yes |
| ∟ Abbott Architect | 1 | No (Significant Bias) | No | No | No |
Table 2: Historical Method Comparison Data (2012 & 2015 Studies) [77] [76]
| Method (Study) | Correlation with LC-MS/MS (CCC) | Mean Bias vs. LC-MS/MS | Intercept (Passing-Bablok) | Slope (Passing-Bablok) |
|---|---|---|---|---|
| LC-MS/MS (2012) | 0.99 (to other LC-MS/MS) | +0.56 μg/L | - | - |
| DiaSorin RIA (2012) | 0.97 | +1.1 μg/L | - | - |
| DiaSorin Liaison (2012) | 0.95 | +0.2 μg/L | - | - |
| Abbott Architect (2012) | 0.85 | +4.56 μg/L | - | - |
| Roche E170 (D3 only) (2012) | 0.66 | -2.7 μg/L | - | - |
| Roche Cobas (2015) | - | -14.1% | -5.23 nmol/L | 0.97 |
| Abbott Architect (2015) | - | +15.1% | +17.08 nmol/L | 0.77 |
Notes: CCC = Concordance Correlation Coefficient; nmol/L to μg/L conversion factor is approximately 0.4 (e.g., 50 nmol/L ≈ 20 μg/L).
Visualizing Workflows and Uncertainty
The following diagrams illustrate the experimental workflow and the conceptual relationship between measurement uncertainty and clinical detection.
Experimental Workflow for Method Comparison
Method Comparison Workflow
Assessing Clinical Detection Capability
MU and Change Detection
The Scientist's Toolkit: Research Reagent Solutions
Table 3: Essential Materials and Reagents for 25-(OH)D Method Evaluation
| Item | Function & Importance | Example Sources / Notes |
|---|---|---|
| Reference Serum Pools | Serve as commutable materials with values assigned by a RMP for bias determination. Crucial for standardization. | SLR Research Corporation [78]; NIST Standard Reference Material (SRM) 972 [76]. |
| Stable Isotope-Labeled Internal Standards | Used in LC-MS/MS to correct for losses during sample preparation and matrix effects, ensuring accuracy and precision. | Deuterated 25-(OH)D3 (e.g., D6-25(OH)D3) [76]. |
| Immunoassay Kits | Automated reagent sets for high-throughput clinical labs. Performance varies significantly between manufacturers. | Kits from Abbott, DiaSorin, Roche, Siemens, Beckman-Coulter [75] [77] [78]. |
| Calibrators | Define the analytical measurement curve. Traceability to reference methods is critical for minimizing bias. | Manufacturer-provided, multi-level calibrators. Lot-to-lot variability can impact performance [78] [76]. |
| Quality Control (QC) Materials | Monitor assay precision and stability over time. Should be assayed at least daily. | Commercial QC sera at multiple concentrations (low, medium, high) [78]. |
The choice between LC-MS/MS and immunoassays for 25-(OH)D testing involves a careful balance between analytical performance and operational practicality. LC-MS/MS methods demonstrate superior accuracy, specificity, and lower measurement uncertainty, consistently meeting all stringent performance specifications [75]. They remain the gold standard for research and reference laboratory applications.
However, recent advancements show that several automated immunoassays can also achieve acceptable measurement uncertainty, making them suitable for many clinical settings where speed and throughput are paramount [75] [79]. A critical finding from recent studies is the significant inter-laboratory variability observed for some immunoassays, underscoring that the performance of a method is not solely determined by the manufacturer's kit but also by individual laboratory practices [78].
The integration of measurement uncertainty-based APS and the use of graphical tools for visualizing MU provide a powerful, comprehensive framework for evaluating assay performance. These approaches empower researchers and clinicians to select methods capable of reliably detecting clinically meaningful changes in vitamin D status, thereby bridging the gap between laboratory performance and optimal patient care [75] [79].
The quantitative analysis of biomarkers and drugs in biological fluids such as plasma and serum is fundamental to pharmaceutical development and clinical diagnostics. These matrices are chemically complex, containing proteins, lipids, salts, and numerous other endogenous compounds that can interfere with analytical measurements. Matrix effects present a significant challenge, potentially compromising the accuracy, sensitivity, and reproducibility of analytical results [80] [81]. These effects manifest differently across analytical platforms. In mass spectrometry (MS), co-eluting matrix components can suppress or enhance analyte ionization, a phenomenon known as ionization suppression [82] [83]. In immunoassays, interference can arise from cross-reacting molecules or endogenous antibodies [2]. Understanding and mitigating these effects is crucial for generating reliable data, particularly in endocrine research where precise hormone measurement is critical. This application note details practical strategies for overcoming matrix effects in plasma and serum analysis using liquid chromatography-mass spectrometry (LC-MS).
Matrix Effects: MS vs. Immunoassay
Mass Spectrometry and Ionization Suppression
In LC-MS, matrix effects primarily occur through ionization suppression in the electrospray ionization (ESI) source. Phospholipids, a major component of cell membranes, are particularly notorious interferents. They co-extract with analytes during sample preparation and co-elute during chromatography, leading to charge competition and diminished analyte response [82]. The consequences are multifaceted: reduced sensitivity (leading to higher limits of quantitation), irreproducible analyte response, and shortened HPLC column lifetime due to erratic elution of retained phospholipids [82]. The mechanism is thought to involve competition for charge and space on the surface of ESI droplets, or an increase in droplet viscosity and surface tension that reduces the efficiency of ion evaporation [83]. It is important to note that even with the high selectivity of tandem mass spectrometry, ion suppression remains a major concern because it occurs during the initial ion formation, before mass analysis [83].
Immunoassay and Specificity Challenges
Immunoassays suffer from a different set of interferences related to the specificity of antibody-antigen interactions. Common interferents include:
- Cross-reacting substances: Structurally similar molecules, such as metabolite precursors or drug metabolites, that are recognized by the assay antibody [2].
- Heterophile antibodies: Endogenous human antibodies that can bridge the capture and detection antibodies in a sandwich immunoassay, leading to false-positive results [2].
- Biotin: High concentrations of biotin can interfere with assays that use the biotin-streptavidin complex for separation [2].
- Other endogenous components: Proteins like C-reactive protein have been shown to cause spurious correlations in immunoassay-measured estradiol that are not observed with MS, suggesting a method-specific interference [4].
Comparative Analysis
Table 1: Comparison of Matrix Effect Challenges in Mass Spectrometry and Immunoassay
| Feature | Mass Spectrometry | Immunoassay |
|---|---|---|
| Primary Interferents | Phospholipids, salts, dosing vehicles, non-volatile compounds [82] [84] [83] | Heterophile antibodies, cross-reactants, biotin, rheumatoid factor [2] |
| Mechanism of Interference | Ionization competition in the MS source; altered droplet formation/evaporation [82] [83] | Non-specific binding or cross-reactivity with assay antibodies [2] |
| Impact on Results | Signal suppression or enhancement; affects precision and accuracy [81] [84] | False positive or false negative results; inaccurate quantification [2] |
| Key Advantage | High specificity; ability to chromatographically separate interferents [81] | High throughput; no requirement for extensive sample prep [2] |
Experimental Protocols for Overcoming Matrix Effects in LC-MS
Protocol 1: Targeted Phospholipid Depletion using HybridSPE-Phospholipid
This protocol utilizes zirconia-coated silica particles to selectively bind and remove phospholipids from plasma or serum samples [82].
Workflow:
- Preparation: Transfer 50-100 µL of plasma or serum sample to a well of a HybridSPE-Phospholipid 96-well plate.
- Protein Precipitation: Add a precipitation solvent (e.g., acetonitrile containing 1% formic acid) at a 3:1 solvent-to-sample ratio.
- Mixing: Mix thoroughly via vortex agitation or a draw-dispense method for 1-2 minutes to ensure complete protein precipitation.
- Filtration & Depletion: Apply positive or vacuum pressure to pass the entire sample-solvent mixture through the HybridSPE sorbent. The zirconia-based sorbent selectively retains phospholipids via Lewis acid/base interactions between the zirconia atoms and the phosphate groups on the phospholipids.
- Collection: Collect the eluent, which now contains the target analytes with significantly reduced phospholipid content.
- Analysis: Evaporate the eluent under a stream of nitrogen and reconstitute in a suitable LC-MS compatible solvent prior to injection.
Application Note: This technique has been shown to dramatically increase analyte response (e.g., for propranolol) by eliminating the co-eluting phospholipids that cause ionization suppression, thereby improving method accuracy and precision [82].
Protocol 2: Analyte Enrichment using Biocompatible Solid-Phase Microextraction (BioSPME)
This protocol concentrates analytes while excluding larger matrix components, using fibers coated with C18-modified silica in a biocompatible binder [82].
Workflow:
- Equilibration: Condition the bioSPME fiber (tip or probe configuration) by incubating in a conditioning solvent.
- Extraction: Immerse the conditioned fiber directly into the plasma or serum sample. Incubate with agitation for a predetermined time (e.g., 30-60 minutes) to allow analytes to reach an equilibrium distribution between the sample and the fiber coating. The binder physically shields large biomolecules from adhering.
- Washing: Remove the fiber and briefly rinse it in a wash solution (e.g., water or a mild buffer) to remove any loosely adsorbed matrix components.
- Desorption: Immerse the fiber into a standard HPLC vial containing a desorption solvent (typically a strong organic solvent like methanol or acetonitrile). The solvent releases the concentrated analytes from the fiber coating.
- Analysis: Inject the desorption solvent directly into the LC-MS system.
Application Note: This non-destructive technique can provide over twice the analyte response while yielding only one-tenth the phospholipid response compared to protein precipitation, effectively concentrating analytes without concurrent concentration of matrix interferents [82].
Protocol 3: Assessment and Mitigation of Matrix Effects
This protocol outlines the steps for detecting and evaluating matrix effects during method development [84] [83].
A. Post-Column Infusion for Qualitative Assessment
- Setup: Connect a syringe pump to the LC effluent line, post-column but prior to the MS inlet.
- Infusion: Continuously infuse a solution of the analyte of interest at a constant rate.
- Injection: Inject a prepared blank matrix extract (e.g., processed plasma without the analyte) onto the LC column.
- Monitoring: Monitor the MRM channel for the infused analyte. A dip or disturbance in the otherwise stable baseline indicates the retention time window where ion suppression occurs due to co-eluting matrix components [83].
B. Post-Extraction Spiking for Quantitative Assessment
- Preparation: Prepare at least six lots of blank matrix from individual donors. Process these blanks through the entire sample preparation protocol.
- Spiking: Spike the analyte of interest and the internal standard into the processed blank extracts at low and high concentrations.
- Analysis: Analyze these samples and compare their peak areas (Amatrix) to the peak areas of the same analytes spiked into pure mobile phase (Aneat) at the same concentrations.
- Calculation: Calculate the Matrix Factor (MF) as MF = Amatrix / Aneat. An MF of 1 indicates no matrix effect, <1 indicates suppression, and >1 indicates enhancement. The CV of the MF across the different matrix lots should be <15% to demonstrate consistency. The IS-normalized MF (MFanalyte / MFIS) should be close to 1 [84].
Essential Research Reagent Solutions
A curated selection of reagents and materials is critical for implementing robust protocols to mitigate matrix effects.
Table 2: Key Research Reagent Solutions for Mitigating Matrix Effects
| Reagent/Material | Function & Application | Key Characteristic |
|---|---|---|
| HybridSPE-Phospholipid Plates | Selective depletion of phospholipids from plasma/serum during protein precipitation [82] | Zirconia-silica particle chemistry for Lewis acid/base binding of phosphate groups |
| Biocompatible SPME (BioSPME) Fibers | Equilibrium-based extraction and concentration of analytes from biological fluids with minimal matrix co-extraction [82] | C18-modified silica particles in a shielding binder; tip and probe configurations |
| Stable Isotope-Labeled Internal Standards (SIL-IS) | Internal calibration to compensate for residual matrix effects and variability in sample preparation [81] [84] | 13C-, 15N-labeled analogs of the analyte; nearly identical chemical and chromatographic behavior |
| Phospholipid Removal Plates | High-capacity removal of phospholipids for cleaner extracts and reduced ion suppression [82] | Various proprietary sorbents designed for specific phospholipid binding |
Workflow and Strategy Diagrams
Sample Preparation Strategy Workflow
The following diagram illustrates the logical decision process for selecting an appropriate sample preparation strategy to overcome matrix effects in MS analysis.
Matrix Effect Assessment Protocol
This diagram outlines the experimental workflow for the qualitative and quantitative assessment of matrix effects.
Matrix effects present a formidable but manageable challenge in the analysis of plasma and serum. LC-MS platforms, while susceptible to ionization suppression, offer a versatile toolkit for overcoming these interferences. The strategic combination of advanced sample preparation techniques like HybridSPE and bioSPME, robust chromatographic separation, and the use of stable isotope-labeled internal standards provides a multi-layered defense. Furthermore, systematic assessment protocols, such as post-column infusion and post-extraction spiking, are indispensable for method development and validation. For endocrine research, where the accurate quantification of hormones is paramount, the superior specificity of LC-MS over immunoassays for many analytes makes it the preferred technology, provided that matrix effects are proactively addressed. By implementing the detailed protocols and strategies outlined in this application note, researchers can ensure the generation of precise, accurate, and reliable bioanalytical data.
The quantitative analysis of low-abundance biomarkers, particularly in the field of endocrinology, presents a significant challenge for researchers and drug development professionals. Traditional methods often force a choice between the high throughput of immunoassays and the superior specificity of mass spectrometry (MS). Immunoassays, while automated and widely used in clinical settings, are often plagued by cross-reactivity with structurally similar molecules, leading to inaccurate results [4] [26] [9]. This is especially problematic for steroid hormones and peptide analogs like ACTH, where distinguishing between endogenous and synthetic forms is crucial for pharmacokinetic/pharmacodynamic (PK/PD) modeling [85]. Conversely, traditional liquid chromatography-tandem mass spectrometry (LC-MS/MS) methods, though highly specific, can be hampered by matrix effects and require extensive, manual sample preparation, limiting their clinical utility [26].
To overcome these limitations, hybrid techniques known as immunologic Mass Spectrometry (iMS) or immunoaffinity-LC-MS/MS have emerged. These methods synergistically combine the selective enrichment power of immunoaffinity capture with the precise detection capability of MS [85] [26] [86]. This approach effectively minimizes matrix interference and eliminates cross-reactivity, enabling the accurate, multiplexed quantification of biomarkers that was previously unattainable [26] [87]. This application note details the principles, protocols, and key applications of this powerful technology within the context of endocrine research and drug development.
Core Principles and Key Advantages
The fundamental principle of hybrid immunoaffinity-MS is the use of antibodies, immobilized on solid supports like magnetic beads, to selectively isolate target analytes from a complex biological matrix [26] [86]. Following capture and wash steps, the analytes are eluted and introduced into an LC-MS/MS system for separation and quantification. This workflow directly addresses the shortcomings of its parent technologies.
- Overcoming Matrix Effects: By selectively pulling the target analyte out of the sample matrix, the immunoaffinity enrichment step removes the vast majority of interfering substances that can suppress or enhance ionization in the MS source. This allows for the use of cleaner calibration standards prepared in simple solutions (e.g., methanol or buffer), eliminating the need for hard-to-source matrix-matched standards [26].
- Eliminating Cross-Reactivity: The specificity of the hybrid approach is two-fold. The immunoaffinity step provides the first level of specificity, and the subsequent LC-MS/MS analysis provides a second, orthogonal level of specificity by distinguishing analytes based on mass-to-charge ratio and fragmentation pattern [85] [86]. This is critical for differentiating between closely related molecules, such as endogenous ACTH(1–39) and synthetic ACTH(1–24) in PK/PD studies [85].
- Enabling Multiplexed, Sensitive Quantification: These assays can be designed to capture multiple analytes simultaneously from a single sample. For instance, a single iMS method has been developed for the simultaneous quantification of testosterone, progesterone, and estradiol in human serum [26]. The enrichment step also concentrates the analytes, significantly lowering the limit of quantification and enabling the measurement of low-abundance biomarkers [85] [86].
The table below summarizes a direct comparison of analytical techniques, highlighting the unique position of hybrid immunoaffinity-MS.
Table 1: Comparison of Analytical Techniques for Biomarker Quantification
| Feature | Traditional Immunoassay (e.g., ELISA, CLIA) | Traditional LC-MS/MS | Hybrid Immunoaffinity-MS |
|---|---|---|---|
| Specificity | Moderate; susceptible to cross-reactivity [4] [9] | High | Very High; dual specificity from antibody and MS [85] [26] |
| Matrix Effect | Minimal | Significant; requires matrix-matched calibration [26] | Negligible; removed by enrichment [26] |
| Multiplexing Capability | Low (typically one analyte per test) [26] | High | High for targeted panels [26] [87] |
| Sensitivity | Good for many analytes | Good to Excellent | Excellent; enhanced by enrichment [85] [86] |
| Throughput & Automation | High and standardized [26] | Low to Moderate; often manual prep | Moderate to High; amenable to automation [26] |
| Isoform Differentiation | Poor | Good | Excellent [85] [86] |
Visualizing the Hybrid Workflow
The following diagram illustrates the streamlined process of a typical hybrid immunoaffinity-MS workflow, from sample to result.
Application in Endocrine Research and Drug Development
Pharmacodynamic Studies and Signaling Networks
Hybrid immunoaffinity-MS is exceptionally powerful for multiplexed, quantitative pharmacodynamic (PD) studies. For example, a 69-plex immuno-MRM assay was developed to target the DNA damage response (DDR) network, enabling the simultaneous quantification of phosphorylated and non-modified peptides [87]. This assay demonstrated a linear range of ≥3 orders of magnitude, with median intra- and inter-assay variabilities of 10% and 16% CV, respectively. It was successfully applied to immortalized cells, primary human cells, and surgically excised cancer tissues to quantify exposure-response relationships and the effects of kinase inhibitors [87]. This highlights the method's utility in understanding complex cell signaling networks and supporting targeted therapy development.
Quantification of Therapeutic Peptides and Steroid Hormones
In drug development for endocrine disorders, these hybrid techniques are invaluable. A recent study developed a hybrid IA-LC-MS/MS method to measure ACTH(1–24), a synthetic peptide used in stimulation tests, in the presence of endogenous ACTH(1–39). This was critical for assessing the PK/PD profile of a new ACTH receptor antagonist. The assay achieved a lower limit of quantification (LLOQ) of 10 pg/mL, with accurate and precise results despite the presence of the similar endogenous hormone [85].
For steroid hormone analysis, an automated iMS method was developed for the simultaneous quantification of testosterone, progesterone, and estradiol in human serum. The method showed absolute recoveries of 93.9%–110.8% and effectively minimized matrix effects, as calibration curves prepared in different matrices showed excellent consistency [26]. This level of performance is crucial for accurate diagnosis and monitoring of endocrine diseases like polycystic ovary syndrome (PCOS) and congenital adrenal hyperplasia (CAH).
Table 2: Quantitative Performance of Representative Hybrid Immunoaffinity-MS Assays
| Analytic | Biological Matrix | Linear Range | LLOQ | Key Application | Citation |
|---|---|---|---|---|---|
| ACTH(1-24) | Human Plasma | 10 - 400 pg/mL | 10 pg/mL | PK/PD modeling for ACTH antagonist drug development [85] | |
| Testosterone, Progesterone, Estradiol | Human Serum | Not Specified | Not Specified | Automated, multiplexed steroid profiling in pregnancy [26] | |
| 69-plex DDR Phosphopeptides | Cell Lysates, Tissue | ≥3 orders of magnitude | Median 2.0 fmol/mg | Quantitative phospho-pharmacodynamic studies [87] | |
| Parathyroid Hormone (PTH) | Human Plasma/Serum | Not Specified | 10-fold lower than bead method | Specific quantification of PTH(1-84) vs. truncated variants [86] |
The Scientist's Toolkit: Essential Research Reagents
Table 3: Key Research Reagent Solutions for Hybrid Immunoaffinity-MS
| Item | Function | Example from Literature |
|---|---|---|
| Capture Antibody | Selective enrichment of the target analyte(s) from the complex sample matrix. | Monoclonal antibodies for testosterone, progesterone, estradiol [26]; antibody from commercial Elecsys ACTH Kit [85]. |
| Magnetic Beads | Solid support for antibody conjugation, enabling automated separation and washing steps. | Streptavidin-coated magnetic beads [85]; immunomagnetic beads (IMBs) [26]. |
| Stable Isotope-Labeled Internal Standards (SIS) | Normalization for variability in sample processing, digestion, and MS ionization. | Heavy isotope-labeled peptides [88] [86]; murine ACTH(1-39) as internal standard for ACTH(1-24) [85]. |
| Cross-linking Reagents | Covalently coupling antibodies to magnetic beads for a stable, reusable affinity surface. | Dimethyl pimelimidate (DMP) for cross-linking antibodies to beads [88]. |
| LC-MS/MS System | Chromatographic separation followed by highly specific and sensitive mass spectrometric detection and quantification. | Triple quadrupole MS for MRM [88] [87]; high-resolution MS platforms (e.g., Orbitrap) for discovery [89]. |
Detailed Experimental Protocol: Immunoaffinity Enrichment and LC-MS/MS for Peptides
The following protocol is adapted from methods used for ACTH(1-24) and phosphopeptide analysis, providing a general framework for peptide quantification [85] [88].
Materials and Reagents
- Samples: Human plasma or serum (e.g., derived from K2EDTA whole blood).
- Synthetic Analytes and Internal Standards: High-purity target peptide (e.g., ACTH(1-24)) and a stable isotope-labeled analog.
- Capture Antibody: Specific to the target peptide, preferably monoclonal.
- Magnetic Beads: Tosylactivated or streptavidin-coated magnetic beads.
- Buffers: Phosphate-buffered saline (PBS), Tris-buffered saline (TBS), and elution buffers (e.g., low-pH solutions or 3% ACN/5% acetic acid/50 mM citrate) [85] [88].
- LC-MS/MS System: UHPLC system coupled to a triple quadrupole mass spectrometer.
Step-by-Step Procedure
Step 1: Antibody-Bead Conjugation
- Wash the magnetic beads according to the manufacturer's instructions.
- Incubate the capture antibody with the beads in a suitable conjugation buffer. For tosylactivated beads, this is typically done in a alkaline buffer. For streptavidin-biotin interactions, incubate biotinylated antibody with streptavidin beads.
- Block any remaining active sites on the beads using a blocking buffer (e.g., containing BSA or ethanolamine).
- Wash the conjugated beads and resuspend in a storage buffer (e.g., PBS with 0.03% CHAPS and 0.1% sodium azide) [88]. Store at 4°C.
Step 2: Sample Preparation and Immunoaffinity Enrichment
- Spike Internal Standard: Add a known amount of stable isotope-labeled internal standard to the plasma/serum sample. This corrects for losses throughout the entire process [85] [86].
- Immunoaffinity Capture: Add the antibody-conjugated magnetic beads to the sample. Incubate with mixing for a predetermined time (e.g., 2 hours) to allow for antigen-antibody binding.
- Magnetic Separation and Washing: Place the sample tube on a magnetic separator to pellet the beads. Discard the supernatant. Wash the beads multiple times with appropriate buffers (e.g., PBS with 0.01% CHAPS) to remove non-specifically bound contaminants [85] [88].
- Elution: Elute the captured peptides from the beads using a low-pH elution buffer (e.g., citric acid) or a solution of organic solvent and acid. The eluate is collected for LC-MS/MS analysis.
Step 3: LC-MS/MS Analysis and Quantification
- Liquid Chromatography: Inject the eluate onto a reverse-phase UHPLC column. Separate the target peptide using a gradient of water and organic solvent (e.g., acetonitrile), both modified with 0.1% formic acid.
- Mass Spectrometry Detection: The eluting peptide is ionized and introduced into the mass spectrometer. Using multiple reaction monitoring (MRM), the instrument is set to detect specific precursor-to-product ion transitions for both the native analyte and the internal standard.
- Quantification: The peak area of the native analyte is compared to the peak area of the internal standard. Quantification is achieved by interpolation from a calibration curve prepared with known concentrations of the synthetic standard [85] [88] [87].
Critical Steps and Troubleshooting
- Antibody Specificity: The success of the entire assay hinges on the specificity and affinity of the capture antibody. Cross-reactivity must be tested against potential interferents.
- Elution Efficiency: The elution conditions must be strong enough to release the captured analyte but not so harsh as to damage the antibody-bead complex for potential reuse. Optimization is required.
- Matrix Tolerance: While the method is robust to matrix effects, extremely lipemic or hemolyzed samples should be evaluated for potential interference during the binding step.
Hybrid immunoaffinity-mass spectrometry techniques represent a significant advancement in bioanalytical chemistry, effectively creating a new class of assays that surpass the limitations of both immunoassays and stand-alone MS. By combining the best features of both technologies, iMS provides a pathway to highly specific, sensitive, and multiplexed quantification of proteins, peptides, and small molecules in complex matrices. For researchers and drug developers in the endocrine field, this enables more reliable biomarker validation, more precise PK/PD modeling for novel therapeutics, and ultimately, the potential for improved diagnostic and treatment strategies for patients. As automation and standardization of these workflows continue to improve, their adoption in clinical and translational research settings is poised to grow substantially.
Conclusion
The choice between mass spectrometry and immunoassay is not a simple binary but a strategic decision dictated by clinical and research needs. While immunoassays remain indispensable for high-throughput screening, mass spectrometry is the unequivocal gold standard for diagnostic confirmation, biomarker discovery, and measuring analytes at low concentrations due to its superior specificity, sensitivity, and multiplexing capabilities. The future of endocrine diagnostics lies in the continued standardization of methods, increased automation of MS to enhance accessibility, and the strategic development of hybrid techniques that leverage the strengths of both platforms. For researchers and drug developers, this evolution promises more reliable data, refined personalized treatment regimens, and accelerated translation of novel biomarkers into clinical practice, ultimately solidifying the foundation of precision medicine in endocrinology.
References
- 1. Immunoassay [https://en.wikipedia.org/wiki/Immunoassay]
- 2. Hormone Immunoassay Interference: A 2021 Update - PMC [https://pmc.ncbi.nlm.nih.gov/articles/PMC8368230/]
- 3. Immunoassay - an overview | ScienceDirect Topics [https://www.sciencedirect.com/topics/medicine-and-dentistry/immunoassay]
- 4. Comparisons of Immunoassay and Mass Spectrometry ... [https://pmc.ncbi.nlm.nih.gov/articles/PMC3667264/]
- 5. Comparing immunoassay and mass spectrometry ... [https://pubmed.ncbi.nlm.nih.gov/39933211/]
- 6. Immunoassay Methods - Assay Guidance Manual - NCBI - NIH [https://www.ncbi.nlm.nih.gov/books/NBK92434/]
- 7. Chemiluminescent Immunoassay (CLIA) Kits [https://www.lsbio.com/products/elisakits/clia]
- 8. Enzyme-Linked Immunosorbent Assay versus ... [https://gjmpbu.org/enzyme-linked-immunosorbent-assay-versus-chemiluminescent-immunoassay-a-general-overview/]
- 9. Comparing immunoassay and mass spectrometry ... [https://www.sciencedirect.com/science/article/pii/S0306453025001027]
- 10. Comparative evaluation of four new immunoassays and LC ... [https://pubmed.ncbi.nlm.nih.gov/40584217/]
- 11. Development and validation of a UHPLC-MS/MS method ... [https://www.sciencedirect.com/science/article/pii/S1570023225000212]
- 12. Chromatography 2025: Sample Preparation Goes Automated [https://www.sepscience.com/chromatography-2025-sample-preparation-goes-automated-11259]
- 13. Proteomics Workflow: Sample Prep to LC-MS Data Analysis [https://www.technologynetworks.com/analysis/articles/navigating-the-modern-proteomics-workflow-key-technical-considerations-406576]
- 14. Recent Advances in Liquid Chromatography–Mass ... [https://pmc.ncbi.nlm.nih.gov/articles/PMC12204688/]
- 15. Making chromatography smarter with integrated data ... [https://www.drugdiscoverynews.com/making-chromatography-smarter-with-integrated-data-platforms-16425]
- 16. NULISA: a proteomic liquid biopsy platform with attomolar ... [https://www.nature.com/articles/s41467-023-42834-x]
- 17. Leveraging mass spectrometry for pediatric endocrine ... [https://diagnostics.roche.com/global/en/article-listing/lab-leaders/article/pediatric-endocrine-disorders-mass-spectrometry.html]
- 18. Mass spectrometry-based proteomics as an emerging tool in ... [https://clinicalproteomicsjournal.biomedcentral.com/articles/10.1186/s12014-023-09424-x]
- 19. Conjugating immunoassays to mass spectrometry [https://pmc.ncbi.nlm.nih.gov/articles/PMC7539833/]
- 20. Comparative evaluation of four new immunoassays and LC ... [https://pmc.ncbi.nlm.nih.gov/articles/PMC12205834/]
- 21. Comparison of immunoassay and mass spectrometry ... [https://www.endocrine-abstracts.org/ea/0029/ea0029p1476]
- 22. Recent developments in mass-spectrometry-based targeted ... [https://pmc.ncbi.nlm.nih.gov/articles/PMC10826105/]
- 23. Advanced mass spectrometry techniques for monitoring ... [https://www.sciencedirect.com/science/article/pii/S0167779925003117]
- 24. Quantitative determination of human serum testosterone ... [https://pmc.ncbi.nlm.nih.gov/articles/PMC7339657/]
- 25. Challenges in developing accurate assays for the ... [https://pubmed.ncbi.nlm.nih.gov/40729212/]
- 26. Steroid hormones as the example [https://www.sciencedirect.com/science/article/abs/pii/S0039914024014206]
- 27. An isotope dilution-liquid chromatography-tandem mass ... [https://pubmed.ncbi.nlm.nih.gov/40433676/]
- 28. Mapping endocrine networks by stable isotope tracing - PMC [https://pmc.ncbi.nlm.nih.gov/articles/PMC11344083/]
- 29. Method development and validation for the determination of ... [https://pubs.rsc.org/en/content/articlehtml/2016/ay/c6ay00221h]
- 30. Comparative evaluation of four new immunoassays and LC ... [https://www.sciencedirect.com/science/article/pii/S235255172500037X]
- 31. A brief update on mass spectrometry applications to routine ... [https://www.sciencedirect.com/science/article/pii/S2376999819300108]
- 32. Methodological considerations in determining sex steroids ... [https://pubmed.ncbi.nlm.nih.gov/37540832/]
- 33. Methodological considerations in determining sex steroids... [https://www.degruyterbrill.com/document/doi/10.1515/cclm-2023-0344/html?lang=en&srsltid=AfmBOor8gvsXaXZCz52gRxwMEKnJqZQwaM1UND1i9nN1JR6HIcepkNqM]
- 34. Clinical utility of laboratory developed mass spectrometry ... [https://pmc.ncbi.nlm.nih.gov/articles/PMC9900367/]
- 35. Steroid measurement with LC–MS/MS in pediatric ... [https://www.sciencedirect.com/science/article/abs/pii/S0303720708004668]
- 36. Clinical metabolomics in type 2 diabetes mellitus [https://www.frontiersin.org/journals/endocrinology/articles/10.3389/fendo.2025.1501305/full]
- 37. Metabolomic network reveals novel biomarkers for type 2 ... [https://pmc.ncbi.nlm.nih.gov/articles/PMC12046487/]
- 38. Association between amino acids and recent osteoporotic ... [https://www.frontiersin.org/journals/nutrition/articles/10.3389/fnut.2024.1360959/full]
- 39. Integrative analysis of serum microorganisms and ... [https://pmc.ncbi.nlm.nih.gov/articles/PMC12504294/]
- 40. Novel protocol for metabolomics data normalization and ... [https://pubmed.ncbi.nlm.nih.gov/40097363/]
- 41. Urine Free Cortisol in the Diagnosis of Cushing's Syndrome [https://pmc.ncbi.nlm.nih.gov/articles/PMC4318888/]
- 42. Immunoassay or Mass Spectrometry?Cortisol ... [https://synapse.koreamed.org/articles/1143289]
- 43. Comparison of Direct and Extraction Immunoassay ... [https://pmc.ncbi.nlm.nih.gov/articles/PMC10485861/]
- 44. Determination of human urinary cortisol, cortisone and ... [https://www.sciencedirect.com/science/article/pii/S0009898125002037]
- 45. Clinical utility of an ultrasensitive urinary free cortisol assay ... [https://www.sciencedirect.com/science/article/abs/pii/S0039128X19300650]
- 46. Endocrine Testing Market Size to Surge USD 32.83 Bn ... [https://www.precedenceresearch.com/endocrine-testing-market]
- 47. Biopharmaceutical analysis — current analytical ... [https://link.springer.com/article/10.1007/s00216-025-06036-2]
- 48. Development, Validation, and Comparison of Two Mass ... [https://pmc.ncbi.nlm.nih.gov/articles/PMC7961417/]
- 49. Development, Validation, and Comparison of Two Mass ... [https://www.mdpi.com/1420-3049/26/5/1383]
- 50. Simultaneous quantification of rituximab and eculizumab in ... [https://www.sciencedirect.com/science/article/abs/pii/S0009912020308699]
- 51. Using Mass Spectrometry to Quantify Rituximab and Perform ... [https://pubmed.ncbi.nlm.nih.gov/27228216/]
- 52. OP0058 Using Mass Spectrometry To Quantify Rituximab ... [https://www.sciencedirect.com/science/article/abs/pii/S0003496724566377]
- 53. Limitations of direct immunoassays for measuring ... [https://pubmed.ncbi.nlm.nih.gov/20332268/]
- 54. Analytical Methodologies for the Determination of Endocrine ... [https://pmc.ncbi.nlm.nih.gov/articles/PMC3662172/]
- 55. Comparison of assay methods for quantifying sex hormone ... [https://pmc.ncbi.nlm.nih.gov/articles/PMC11327312/]
- 56. Cross-reactivity of steroid hormone immunoassays [https://bmcclinpathol.biomedcentral.com/articles/10.1186/1472-6890-14-33]
- 57. Cross-reactivity mediated by SARS-CoV-2 antibodies: ... [https://www.sciencedirect.com/science/article/abs/pii/S0732889325004110]
- 58. Multicenter comparison of analytical interferences of 25-OH ... [https://pubmed.ncbi.nlm.nih.gov/38188654/]
- 59. Multicenter comparison of analytical interferences of 25-OH ... [https://www.sciencedirect.com/science/article/pii/S2352551723000410]
- 60. Assessment of measurement uncertainty of immunoassays ... [https://www.degruyterbrill.com/document/doi/10.1515/cclm-2025-0554/html?srsltid=AfmBOorVIT-iSDMlEQ2xc_xYt8ZPX45PaOG0UD2DInT6jN5SQjRh4_m_]
- 61. A micro-costing study of mass-spectrometry based ... [https://pmc.ncbi.nlm.nih.gov/articles/PMC11605922/]
- 62. Mass Spectrometry Market Analysis 2025-2030 by Product ... [https://finance.yahoo.com/news/mass-spectrometry-market-analysis-2025-093300234.html]
- 63. Mass Spectrometry Market Size 2025-2029 [https://www.technavio.com/report/mass-spectrometry-market-industry-analysis]
- 64. U.S. Immunoassay Market Surges USD 9.43 Bn in 2025 [https://www.towardshealthcare.com/insights/us-immunoassay-market-sizing]
- 65. Immunoassays Market Size to Hit USD 42.77 Billion by 2034 [https://www.globenewswire.com/news-release/2025/11/05/3181291/0/en/Immunoassays-Market-Size-to-Hit-USD-42-77-Billion-by-2034.html]
- 66. Sample Preparation for Quantitative Whole Cell Proteome ... [https://www.protocols.io/view/sample-preparation-for-quantitative-whole-cell-pro-em3bbc8ip.html]
- 67. Quantitative Mass Spectrometry Imaging Protocols for ... [https://pubmed.ncbi.nlm.nih.gov/40404577/]
- 68. Steroid Hormones Standardization Programs | CSP [https://www.cdc.gov/clinical-standardization-programs/php/hormones/index.html]
- 69. Hormones Reference Laboratory | CSP [https://www.cdc.gov/clinical-standardization-programs/php/hormones/hormone-reference-laboratory.html]
- 70. Reference measurement systems in clinical chemistry [https://www.sciencedirect.com/science/article/abs/pii/S0009898102001882]
- 71. What do CDC CSPs Offer? | CSP [https://www.cdc.gov/clinical-standardization-programs/about/csp-offerings.html]
- 72. Research Methodology: Endocrinologic Measurements in ... [https://pmc.ncbi.nlm.nih.gov/articles/PMC2582556/]
- 73. Performance of LC–MS/MS and immunoassay based 24-h ... [https://www.sciencedirect.com/science/article/abs/pii/S0960076018305788]
- 74. Tandem mass spectrometry method for urinary cortisol and ... [https://mayoclinic.elsevierpure.com/en/publications/validation-of-a-high-throughput-liquid-chromatography-tandem-mass/]
- 75. Assessment of measurement uncertainty of immunoassays ... [https://pubmed.ncbi.nlm.nih.gov/40785082/]
- 76. A comparison between two different automated total 25 ... [https://pmc.ncbi.nlm.nih.gov/articles/PMC4622190/]
- 77. State-of-the-art vitamin D assays: a comparison ... [https://pubmed.ncbi.nlm.nih.gov/22230812/]
- 78. Assessment of measurement uncertainty of immunoassays ... [https://www.degruyterbrill.com/document/doi/10.1515/cclm-2025-0554/html?srsltid=AfmBOoo8pusbJljY0qlBBHPwWNcZbzQuB7jn7aygWk5X1k_FzRRNjIYU]
- 79. A practical tool to support harmonization and quality ... [https://www.osteoporosis.foundation/news/practical-tool-support-harmonization-and-quality-improvement-vitamin-d-testing-20250911-1100]
- 80. Matrix Effects—A Challenge toward Automation of ... [https://www.sciencedirect.com/science/article/pii/S1535553510000158]
- 81. Strategies for the Detection and Elimination of Matrix ... [https://www.chromatographyonline.com/view/strategies-detection-and-elimination-matrix-effects-quantitative-lc-ms-analysis]
- 82. Two Distinct Sample Prep Approaches to Overcome Matrix ... [https://www.sigmaaldrich.com/US/en/technical-documents/technical-article/analytical-chemistry/solid-phase-extraction/sample-prep-overcome-matrix-effect?srsltid=AfmBOooPT324Uz5TJpaNC3pifWL3IpqJ6fWRdnkv3eRN0Ton_rAuuP-w]
- 83. Ion Suppression: A Major Concern in Mass Spectrometry [https://www.chromatographyonline.com/view/ion-suppression-major-concern-mass-spectrometry]
- 84. Assessment of matrix effect in quantitative LC-MS bioanalysis [https://pmc.ncbi.nlm.nih.gov/articles/PMC11352789/]
- 85. A hybrid IA-LC-MS/MS method for adrenocorticotropic ... [https://pmc.ncbi.nlm.nih.gov/articles/PMC11389734/]
- 86. An Enhanced Immunoaffinity Enrichment Method for Mass ... [https://www.spectroscopyonline.com/view/enhanced-immunoaffinity-enrichment-method-mass-spectrometry-based-translational-proteomics]
- 87. Peptide Immunoaffinity Enrichment and Targeted Mass ... [https://www.sciencedirect.com/science/article/pii/S1535947620326748]
- 88. Peptide Immunoaffinity Enrichment with Targeted Mass ... [https://pmc.ncbi.nlm.nih.gov/articles/PMC5555734/]
- 89. Mass Spectrometry for the Masses [https://www.genengnews.com/topics/omics/mass-spectrometry-for-the-masses/]