LC-MS/MS vs Immunoassay: A Precision Guide to Circadian Hormone Analysis in Biomedical Research
Accurate measurement of circadian hormones like melatonin and cortisol is pivotal for understanding their role in health, disease, and chronotherapy.
LC-MS/MS vs Immunoassay: A Precision Guide to Circadian Hormone Analysis in Biomedical Research
Abstract
Accurate measurement of circadian hormones like melatonin and cortisol is pivotal for understanding their role in health, disease, and chronotherapy. This article provides a comprehensive comparison between Liquid Chromatography-Tandem Mass Spectrometry (LC-MS/MS) and immunoassays for researchers and drug development professionals. We explore the foundational biology of key circadian biomarkers, detail methodological approaches for their precise quantification, address common analytical challenges, and present validation data. By synthesizing current evidence, this review serves as an essential resource for selecting the optimal analytical platform to advance circadian research and diagnostics, emphasizing the superior specificity and growing accessibility of LC-MS/MS.
The Circadian Clock and Its Key Hormonal Biomarkers
The Biological Framework of Circadian Rhythms
Circadian rhythms are intrinsic, roughly 24-hour oscillations that govern a vast array of physiological processes, from gene expression to behavior. These rhythms are orchestrated by a hierarchical network of biological clocks, enabling organisms to anticipate and adapt to daily environmental changes.
The central pacemaker, located in the suprachiasmatic nucleus (SCN) of the hypothalamus, is primarily entrained by external light cues. It synchronizes countless peripheral clocks found in tissues throughout the body, including the liver, kidneys, and adipose tissue [1]. This master-slave relationship ensures temporal coordination of physiological functions.
At the molecular level, the core clock mechanism is a transcriptional-translational feedback loop (TTFL). The key components include:
- CLOCK and BMAL1 proteins form a heterodimer that activates the transcription of Period (Per) and Cryptochrome (Cry) genes.
- PER and CRY proteins accumulate, multimerize, and translocate back to the nucleus to inhibit CLOCK-BMAL1 activity, thus closing the feedback loop with a period of approximately 24 hours [1]. Disruption of these rhythms, through factors like shift work or irregular lifestyle, is increasingly linked to an elevated risk of neurodegenerative diseases, psychiatric disorders, metabolic syndrome, and certain cancers [2].
Key Circadian Biomarkers and Their Clinical Significance
Accurately assessing circadian phase is crucial for both research and clinical practice. Hormonal biomarkers provide a reliable window into the internal timing of the organism.
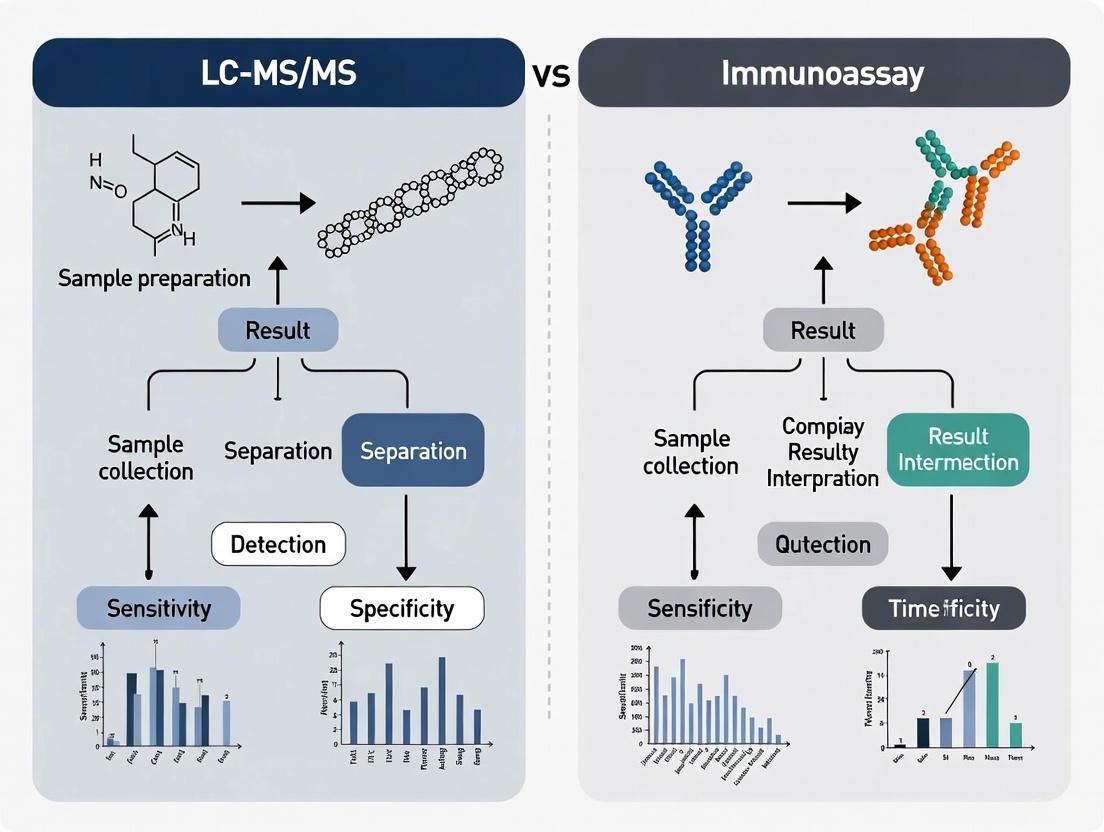
The diagram above illustrates the pathway of two primary circadian hormone rhythms. The most reliable markers are:
- Dim Light Melatonin Onset (DLMO): The time in the evening when melatonin concentration begins to rise persistently under dim light conditions. It is considered the gold standard marker for assessing the phase of the central circadian clock [2].
- Cortisol Awakening Response (CAR): The sharp increase in cortisol levels that occurs within 30-45 minutes after waking. It provides a stable marker of hypothalamic-pituitary-adrenal (HPA) axis activity and circadian phase [2].
Table 1: Primary Hormonal Biomarkers of the Circadian System
| Biomarker | Rhythmic Profile | Primary Significance | Common Assessment |
|---|---|---|---|
| Melatonin | Low during day, peaks during night | Phase marker of central clock; initiates sleep | DLMO in saliva/plasma [2] |
| Cortisol | Peaks after waking, declines through day | HPA axis activity; stress response; energy metabolism | CAR in saliva [2] [1] |
Analytical Methodologies: LC-MS/MS vs. Immunoassay
The choice of analytical platform is critical for the accurate quantification of circadian hormones, each with distinct advantages and limitations.
Liquid Chromatography-Tandem Mass Spectrometry (LC-MS/MS)
LC-MS/MS is increasingly regarded as the reference method for hormone quantification due to its high specificity and accuracy. It physically separates and detects analytes based on their mass-to-charge ratio, minimizing cross-reactivity with structurally similar compounds [2] [3].
Protocol: LC-MS/MS Analysis of Salivary Melatonin and Cortisol
- Sample Collection: Collect saliva samples using specialized synthetic polymer swabs under dim light (<10-30 lux) to prevent melatonin suppression. Record exact collection times.
- Storage: Immediately freeze samples at -20°C or -80°C until analysis.
- Sample Preparation:
- Thaw samples on ice and centrifuge at 10,000 × g for 10 minutes to precipitate mucins.
- Perform solid-phase extraction (SPE) to concentrate analytes and remove interfering matrix components.
- Reconstitute the dried extract in a suitable mobile phase (e.g., water/methanol with 0.1% formic acid).
- LC-MS/MS Analysis:
- Chromatography: Use a reverse-phase C18 column. Employ a gradient elution with mobile phase A (water with 0.1% formic acid) and B (methanol or acetonitrile with 0.1% formic acid) to achieve optimal separation.
- Mass Spectrometry: Operate in multiple reaction monitoring (MRM) mode with electrospray ionization (ESI).
- Key MS Transitions:
- Melatonin: m/z 233.2 → 174.2 (quantifier) and 233.2 → 159.1 (qualifier)
- Cortisol: m/z 363.2 → 121.2 (quantifier) and 363.2 → 327.2 (qualifier)
- Quantification: Use stable isotope-labeled internal standards (e.g., d4-melatonin, d8-cortisol) for precise calibration and build a calibration curve with known standards to calculate sample concentrations [2].
Immunoassays
Immunoassays, such as ELISA, are widely used due to their lower cost, higher throughput, and simpler workflow. They rely on the binding of an antibody to the target hormone. However, they can be susceptible to cross-reactivity with metabolites, potentially leading to analytical inaccuracy [2] [3].
Protocol: ELISA for Salivary Cortisol
- Sample Collection: Follow the same initial collection and storage procedures as for LC-MS/MS.
- Assay Procedure:
- Coat a microtiter plate with a capture antibody specific for cortisol.
- Add samples, standards, and controls to the wells. Cortisol in the sample competes with a fixed amount of enzyme-labeled cortisol (conjugate) for binding sites on the antibody.
- Incubate, then wash the plate to remove unbound materials.
- Add a substrate solution that reacts with the enzyme to produce a colored product.
- Stop the reaction and measure the absorbance. The intensity of color is inversely proportional to the concentration of cortisol in the sample.
- Calculation: Generate a standard curve from the absorbance of the known standards and interpolate the concentration of unknown samples.
Table 2: Comparative Analysis of Immunoassay and LC-MS/MS Platforms
| Parameter | Immunoassay (e.g., ELISA) | LC-MS/MS |
|---|---|---|
| Specificity | Moderate (subject to cross-reactivity) [3] | High (minimal cross-reactivity) [2] [3] |
| Sensitivity | Good for most applications | Excellent (superior for low concentrations) [2] |
| Sample Throughput | High (can be automated) | Moderate (analysis time longer) |
| Cost per Sample | Lower | Higher (instrument cost, expertise) |
| Multiplexing | Built for single analyte | Requires method development, but can be designed for multiple analytes |
| Workflow Complexity | Lower | Higher (requires specialized training) |
A 2025 study comparing immunoassays to LC-MS/MS for urinary free cortisol found that while immunoassays showed strong correlation, they exhibited a proportionally positive bias, meaning they tended to overestimate concentrations compared to the reference LC-MS/MS method [3]. This underscores the importance of method selection based on the required precision.
The Scientist's Toolkit: Research Reagent Solutions
Table 3: Essential Reagents and Materials for Circadian Hormone Analysis
| Item | Function/Description | Example Application |
|---|---|---|
| Stable Isotope-Labeled Internal Standards | Chemical analogs of the analyte (e.g., d4-melatonin); correct for matrix effects and loss during sample prep in LC-MS/MS [4] | Quantification of melatonin via LC-MS/MS |
| SPE Cartridges (C18) | Purify and concentrate analytes from biological matrices like saliva or urine prior to LC-MS/MS | Sample preparation for cortisol/melatonin |
| Antibody-Coated Microplates | Solid phase for capturing target hormone in immunoassays | Salivary cortisol ELISA |
| LC-MS/MS Calibrators | A series of solutions with known concentrations of the pure analyte to create a calibration curve | Generating quantitative results in LC-MS/MS |
| Salivette Collection Devices | Inert synthetic swabs for hygienic and efficient saliva sample collection | Standardized DLMO assessment |
Emerging Frontiers and Novel Approaches
The field of circadian biology is rapidly evolving with new technologies that promise to transform research and clinical monitoring.
- Wearable Biosensors: Recent advancements enable non-invasive, continuous monitoring of circadian hormones. A 2025 study validated a wearable sensor that measures cortisol and melatonin in passive perspiration, showing strong agreement with salivary levels (Pearson r = 0.92 for cortisol, r = 0.90 for melatonin) [5]. This facilitates long-term, dynamic circadian assessment in real-world settings.
- Digital Circadian Markers: Researchers are deriving rhythmic digital markers (RDMs) from data collected via wearable devices or smartphones. These markers, such as the continuous wavelet circadian rhythm energy (CCE) derived from heart rate signals, have shown high diagnostic utility for conditions like metabolic syndrome, offering a cost-effective and low-burden alternative [6].
- Standardized Protocols: There is a growing emphasis on the need for strict, standardized protocols for circadian assessments. Key factors that must be controlled include ambient light exposure, body posture, and precise sampling times to ensure the reliability of measured biomarkers like DLMO and CAR [2].
Circadian rhythms are endogenous, near-24-hour cycles that orchestrate a wide range of physiological processes in humans, including the sleep-wake cycle, hormone secretion, metabolism, and behavior [7]. The suprachiasmatic nucleus (SCN), the master pacemaker located in the hypothalamus, integrates light signals to synchronize these rhythms with the solar day [7]. As a direct output of the SCN, melatonin serves as a crucial hormonal signal of the internal circadian clock. Its secretion, tightly controlled by the light-dark cycle, peaks during the night and is suppressed by light, earning it the title "Hormone of Darkness" [8].
The Dim Light Melatonin Onset (DLMO) is widely recognized as the most reliable marker of internal circadian timing [7]. It represents the time in the evening when melatonin concentrations begin to rise under dim light conditions, typically occurring 2-3 hours before habitual sleep onset [7] [8]. Accurate determination of DLMO is essential for diagnosing circadian rhythm sleep-wake disorders, such as delayed and advanced sleep-phase disorders, and for investigating the impact of circadian disruption on health outcomes, including neurodegenerative diseases, metabolic syndrome, and mood disorders [7] [9].
Within the broader context of analytical research on circadian hormones, a central thesis is the critical comparison of measurement techniques. While immunoassays have been traditionally used for hormone quantification, liquid chromatography-tandem mass spectrometry (LC-MS/MS) has emerged as a superior technology, offering enhanced specificity, sensitivity, and the capability for multiplexing [7] [10] [11]. This application note details the pivotal role of DLMO and provides structured protocols for its precise assessment, with a focus on the advantages of LC-MS/MS for circadian biomarker analysis.
Melatonin as a Circadian Phase Marker
Secretion Rhythm and Physiological Role
Melatonin (N-acetyl-methoxytryptamine) is an indoleamine hormone primarily synthesized and secreted by the pineal gland [8]. Its production is initiated in response to darkness, following a complex neural pathway from the SCN via the sympathetic nervous system [8] [9]. The hormone is not stored but diffuses immediately into the bloodstream and cerebrospinal fluid upon secretion [8]. Nocturnal melatonin concentrations in plasma are typically 10-20 times higher than daytime levels, with peak levels (often 50-100 pg/mL in plasma) occurring between 3:00 and 4:00 AM [8]. The hormone's half-life is relatively short, estimated at 20 to 60 minutes [8].
Beyond its role in sleep regulation, melatonin exerts pleiotropic effects, including free radical scavenging, antioxidant activity, and modulation of immune, cardiovascular, and reproductive functions [7]. Its rhythm provides a crucial timing signal that synchronizes peripheral oscillators throughout the body, making it an ideal candidate for assessing the phase of the master circadian clock.
The Dim Light Melatonin Onset (DLMO)
DLMO represents the phase of the endogenous circadian pacemaker and is defined as the time at which melatonin concentrations start to rise persistently under dim light conditions. Assessment typically requires sampling over a 4-7 hour window in the evening, from about 5 hours before to 1 hour after habitual bedtime [7] [8]. Several methods exist for determining DLMO from partial melatonin profiles:
- Fixed Threshold: DLMO is the time when interpolated melatonin concentrations cross an absolute threshold (e.g., 3-4 pg/mL in saliva or 10 pg/mL in serum) [7] [8].
- Dynamic Threshold: DLMO is defined as the time when levels exceed two standard deviations above the mean of three or more baseline (pre-rise) values [7].
- "Hockey-Stick" Algorithm: An objective, automated method that estimates the point of change from baseline to the rising phase of melatonin secretion [7].
No universal standard has been established, and the choice of method can influence the calculated DLMO by 20-30 minutes [7] [8]. The fixed threshold method is often favored for its practicality, especially in studies with partial melatonin profiles [8].
Analytical Methodologies: LC-MS/MS vs. Immunoassay
The accurate quantification of low, physiologically relevant concentrations of melatonin is analytically challenging. The following section compares the two primary methodological approaches.
Technical Comparison
Table 1: Comparison of Immunoassay and LC-MS/MS for Melatonin Quantification
| Feature | Immunoassay (ELISA, ECLIA) | LC-MS/MS |
|---|---|---|
| Principle | Antibody-antigen binding | Physical separation and mass detection |
| Specificity | Moderate; susceptible to cross-reactivity with metabolites | High; based on molecular mass and fragmentation pattern |
| Sensitivity (LLOQ) | Often insufficient for low salivary melatonin [10] | 2.15 pmol/L in saliva (approx. 0.5 pg/mL) [10] |
| Multiplexing | Single analyte per assay | Simultaneous quantification of melatonin, cortisol, and others [7] [10] |
| Sample Volume | Larger total volume if multiple analytes | Small volume for multiple analytes |
| Throughput | High | Moderate to high |
| Cost per Sample | Lower initial investment | Higher capital and operational cost |
| Data Provided | Concentration only | Concentration with structural confirmation |
Performance and Data Validation
Substantial evidence demonstrates the superior performance of LC-MS/MS. A direct comparative study measuring salivary melatonin and cortisol showed that, while immunoassays and LC-MS/MS were strongly correlated (Pearson’s r=0.910 for melatonin), immunoassays exhibited a significant positive mean bias of 23.2% for melatonin and 48.9% for cortisol [10]. This bias is largely attributed to antibody cross-reactivity with structurally similar compounds in the sample matrix [10] [11].
Another study on salivary sex hormones concluded that LC-MS/MS was a more reliable option compared to ELISA, which showed poor validity for estradiol and progesterone [11]. For cortisol, LC-MS/MS achieves a lower limit of quantification (LLOQ) of 0.14 nmol/L, which is crucial for accurately assessing the low late-night concentrations critical for diagnosing Cushing's syndrome [10].
Detailed Experimental Protocols
Protocol 1: Sample Collection for DLMO Assessment
Objective: To collect salivary samples for the reliable determination of Dim Light Melatonin Onset.
Materials:
- Saliva Collection Tubes: Polypropylene tubes; avoid cotton-based swabs as they can adsorb melatonin and lower measured levels [8].
- Parafilm: For passive drooling stimulation without interfering assays [10].
- Dim Red Light: Light source with wavelength >620 nm, which does not suppress melatonin [8].
- Light Meter: To verify ambient light intensity remains <50 lux [8] [12].
- Freezer (-20°C or lower): For sample storage immediately after collection.
Pre-Collection Participant Guidelines:
- Maintain a regular sleep-wake schedule for at least 3 days prior to sampling.
- Avoid the following for the specified periods before and during collection:
- Abstain from non-steroidal anti-inflammatory drugs (NSAIDs) and beta-blockers for an appropriate period, as they can suppress melatonin production [7].
Collection Procedure:
- Begin sampling 5-6 hours before the participant's habitual bedtime.
- Ensure the participant is in a dimly lit room (<50 lux) for at least 1 hour prior to the first sample.
- Collect samples at a consistent frequency (e.g., every 30 or 60 minutes) [8].
- For each sample, have the participant passively drool into a polypropylene tube (aim for >2 mL) while chewing inert Parafilm if needed [10].
- Record the exact clock time of each sample collection.
- Immediately freeze samples at -20°C after collection until analysis.
Protocol 2: Simultaneous Analysis of Melatonin and Cortisol by LC-MS/MS
Objective: To quantitatively measure melatonin and cortisol concentrations in human saliva using a validated LC-MS/MS method.
Materials & Reagents:
- LC-MS/MS System: Triple quadrupole or similar mass spectrometer equipped with an electrospray ionization (ESI) source.
- HPLC Column: C18 column (e.g., 2.1 x 50 mm, 2.6 μm) [10].
- Analytical Standards: Pure melatonin, cortisol, and their stable isotope-labeled internal standards (e.g., melatonin-d4, cortisol-d4) [10].
- Solvents: High-purity methanol, acetonitrile, methyl tert-butyl ether (MTBE), and formic acid.
- Mobile Phase A: 2-mmol/L ammonium acetate in deionized water.
- Mobile Phase B: 0.1% (v/v) formic acid in acetonitrile.
Sample Preparation (Liquid-Liquid Extraction):
- Thaw saliva samples and centrifuge to precipitate any particulates.
- Aliquot 300 μL of saliva into an Eppendorf tube.
- Add 20 μL of internal standard solution (e.g., melatonin-d4 and cortisol-d4).
- Add 1,000 μL of methyl tert-butyl ether (MTBE) as the extraction solvent.
- Vortex the mixture vigorously for 30 minutes.
- Centrifuge at 20,600 × g for 10 minutes to separate phases.
- Transfer 930 μL of the organic (upper) layer to a new deep-well plate.
- Evaporate the solvent to dryness under a stream of nitrogen or using a microplate evaporator.
- Reconstitute the dry residue in 100 μL of 20% (v/v) methanol and vortex for 30 minutes prior to LC-MS/MS injection [10].
LC-MS/MS Analysis:
- Injection Volume: 20 μL.
- Flow Rate: 250 μL/min.
- Gradient:
- Initial: 30% B
- Ramp to 95% B over 4 minutes
- Hold for 1 minute
- Re-equilibrate to 30% B for 1 minute (Total run time: 6 minutes) [10].
- Mass Spectrometer Settings:
- Ionization Mode: Positive electrospray ionization (ESI+)
- Data Acquisition: Multiple Reaction Monitoring (MRM)
- Ion Transitions (Examples):
- Melatonin: 233.2 → 174.2
- Melatonin-d4 (IS): 237.2 → 178.2
- Cortisol: 363.2 → 121.2
- Cortisol-d4 (IS): 367.2 → 121.2 [10]
Data Processing:
- Quantification is performed using the peak area ratio of the analyte to its corresponding internal standard.
- Generate a calibration curve using at least 5 concentration levels for each analyte. The method demonstrates excellent linearity (r > 0.99) for melatonin (2.15–430 pmol/L) and cortisol (0.14–27.6 nmol/L) [10].
Table 2: Key Validation Parameters for a Salivary Melatonin and Cortisol LC-MS/MS Assay
| Validation Parameter | Melatonin | Cortisol |
|---|---|---|
| Linear Range | 2.15 – 430 pmol/L | 0.14 – 27.6 nmol/L |
| Lower Limit of Quantification (LLOQ) | 2.15 pmol/L | 0.14 nmol/L |
| Intra-Assay Precision (CV%) | 3.3 - 4.9% | 2.6 - 3.1% |
| Inter-Assay Precision (CV%) | 3.5 - 6.8% | 3.7 - 4.7% |
| Accuracy (% Recovery) | 100.3 - 102.2% | 96.9 - 107.8% |
| Extraction Recovery | 100.9 - 102.6% | 100.1 - 103.7% |
| Matrix Effect | 92.1 - 97.7% | 98.8 - 99.0% |
Data adapted from [10].
The Scientist's Toolkit: Essential Research Reagent Solutions
Table 3: Key Reagents and Materials for Circadian Hormone Analysis
| Item | Function / Application | Examples / Notes |
|---|---|---|
| Stable Isotope-Labeled Internal Standards | Corrects for matrix effects and loss during sample preparation; essential for accurate LC-MS/MS quantification. | Melatonin-d4, Cortisol-d4 [10] |
| LC-MS/MS Grade Solvents | Ensures low background noise and prevents ion suppression in the mass spectrometer. | Methanol, Acetonitrile, Formic Acid [10] |
| Specialized Saliva Collection Kits | Non-invasive sample collection for circadian profiles. | Use polypropylene tubes; avoid cotton swabs [8]. |
| Certified Reference Standards | For precise calibration of the analytical instrument. | Pure Melatonin and Cortisol (e.g., Sigma-Aldrich) [10] |
| Immunoassay Kits | For comparative studies or when LC-MS/MS is not available. | ELISA kits (e.g., Bühlmann Laboratories) [10] |
| LC-MS/MS Data Processing Software | For instrument control, data acquisition, and quantitative analysis. | Thermo Scientific TraceFinder, Xcalibur [13] [14] |
Visualized Workflows and Signaling
Diagram 1: From Light to DLMO - The workflow illustrates the physiological pathway of melatonin secretion from light stimulation through the neural pathway to the pineal gland, and the subsequent analytical process for DLMO determination.
Diagram 2: LC-MS/MS Workflow - The process for simultaneous analysis of melatonin and cortisol, from sample preparation through LC separation to specific detection and quantification via MRM, highlighting the multiplexing advantage.
Cortisol, a primary glucocorticoid hormone produced by the adrenal cortex, plays a fundamental role in the body's response to stress, metabolism regulation, and immune function. Its secretion follows a distinct diurnal rhythm, regulated by the hypothalamic-pituitary-adrenal (HPA) axis, with peak levels typically occurring in the morning and nadir at night. The Cortisol Awakening Response (CAR) refers to the sharp increase in cortisol levels—a rise of approximately 50-100%—that occurs within 30-45 minutes after waking. This phenomenon is a crucial non-invasive marker for assessing HPA axis dynamics and is increasingly relevant for research in stress physiology, psychiatry, and circadian biology [15] [16].
In clinical and research settings, accurate measurement of cortisol is paramount. The current landscape is dominated by two primary analytical techniques: immunoassays (IA) and liquid chromatography-tandem mass spectrometry (LC-MS/MS). The choice between these methods involves a critical trade-off between analytical specificity and practical applicability, a central theme in modern circadian hormone analysis [15].
Analytical Method Comparison: LC-MS/MS vs. Immunoassay
The accurate measurement of cortisol, particularly for dynamic assessments like the CAR, depends heavily on the chosen analytical platform. The table below summarizes a direct comparison of these methodologies using urinary free cortisol (UFC) as a model analyte, a common approach for assessing overall cortisol output [3] [17] [18].
Table 1: Quantitative Comparison of Cortisol Immunoassays vs. LC-MS/MS
| Analytical Platform | Correlation with LC-MS/MS (Spearman's r) | Proportional Bias | Diagnostic Accuracy (AUC for Cushing's Syndrome) | Reported Sensitivity | Reported Specificity |
|---|---|---|---|---|---|
| Mindray CL-1200i | 0.998 | Positive | 0.969 | 89.66% - 93.10% | 93.33% - 96.67% |
| Snibe MAGLUMI X8 | 0.967 | Positive | 0.963 | 89.66% - 93.10% | 93.33% - 96.67% |
| Roche 8000 e801 | 0.951 | Positive | 0.958 | 89.66% - 93.10% | 93.33% - 96.67% |
| Autobio A6200 | 0.950 | Positive | 0.953 | 89.66% - 93.10% | 93.33% - 96.67% |
Key Findings from Comparative Studies
- Strong Correlation but Systematic Bias: Recent studies demonstrate that modern, direct (extraction-free) immunoassays show strong correlations with the reference LC-MS/MS method. However, they consistently exhibit a proportionally positive bias, meaning they tend to report higher cortisol concentrations than LC-MS/MS [3] [18]. This underscores the necessity of using method-specific reference ranges.
- High Diagnostic Accuracy: Despite the systematic bias, the diagnostic accuracy of these immunoassays for conditions like Cushing's syndrome remains high, with Area Under the Curve (AUC) values all exceeding 0.95 [17]. This makes them suitable for many clinical applications.
- Salivary Cortisol Parallels: This bias is not unique to urine measurements. Studies comparing IA and LC-MS/MS for salivary cortisol—the preferred matrix for CAR assessment—have found identical patterns: IA yields consistently higher concentrations due to potential cross-reactivity with other steroids, though both methods capture the same circadian rhythm profile [15].
The following diagram illustrates the logical decision process for selecting an analytical method in cortisol research.
Diagram 1: Method selection logic for cortisol analysis.
Experimental Protocols for Circadian Cortisol Assessment
This section provides detailed application notes for conducting robust circadian cortisol profiling, with a specific focus on the Cortisol Awakening Response.
Protocol: Salivary Cortisol Collection for CAR
Principle: Salivary cortisol reflects the biologically active, free fraction of serum cortisol and is collected non-invasively, making it ideal for frequent sampling in ambulatory settings to assess the CAR and diurnal rhythm [15].
Materials:
- Salivette collection devices (or similar salivary collection aids)
- Cooler bag with ice packs or a home freezer (~20°C)
- Permanent marker for labeling
- Participant instruction sheet and sample log
- Freezer (~80°C) for long-term storage
Procedure:
- Participant Preparation: Provide participants with clear, written instructions. They should refrain from eating, drinking (except water), brushing teeth, or smoking for at least 30 minutes before each sample collection.
- Sample Collection Schedule: Participants collect saliva samples at multiple time points:
- Immediately upon waking (Time 0)
- 30 minutes post-awakening
- 45 minutes post-awakening
- Before bedtime Participants should record the exact time of waking and each sample collection.
- Collection Technique: The participant places the synthetic swab from the Salivette in their mouth and chews gently for 1-2 minutes until it is saturated with saliva.
- Storage and Transport: The used swab is placed back into the Salivette tube without touching it and stored in a provided cooler or the participant's freezer immediately after collection. Samples should be transported on ice to the laboratory.
- Laboratory Processing: Upon receipt, samples are centrifuged to separate saliva from the swab. The clear saliva is aliquoted and stored at -80°C until analysis.
Protocol: Urinary Free Cortiffol (UFC) Collection
Principle: The 24-hour UFC excretion is a gold-standard test for assessing integrated cortisol production over a full day, commonly used in diagnosing Cushing's syndrome [3] [18].
Materials:
- Large, 3-5 liter plastic collection jug
- Laboratory-provided preservative (if required) or pre-prepared jug
- Cold storage facility (refrigerator or cooler)
- Instruction sheet for the patient
Procedure:
- Jug Preparation: Provide the patient with a pre-treated collection jug, if applicable, and clear instructions.
- 24-Hour Collection: The patient discards the first morning urine. For all subsequent urinations over the next 24 hours, the patient collects the entire volume into the jug, which is kept refrigerated or on ice.
- Final Collection: The patient includes the first morning urine of the following day, completing the 24-hour cycle.
- Transport and Processing: The patient returns the jug to the clinic or lab. The total volume of the 24-hour collection is measured and recorded. A representative aliquot is taken and stored frozen at -20°C or below until analysis.
Protocol: Analytical Measurement by Immunoassay and LC-MS/MS
Principle: Cortisol in biological matrices can be quantified using either automated immunoassays or the reference method LC-MS/MS. The workflow differs significantly between the two, as detailed below and illustrated in Diagram 2.
Table 2: The Scientist's Toolkit: Key Reagents and Materials
| Item | Function/Description | Example Platforms/Notes |
|---|---|---|
| Cortisol Immunoassay Reagent Kit | Contains antibodies, chemiluminescent substrates, and calibrators for cortisol detection. | Autobio, Mindray, Snibe, Roche [18] |
| LC-MS/MS System | High-specificity reference method for hormone analysis. | SCIEX Triple Quad 6500+; Waters UPLC BEH C8 column [18] |
| Internal Standard (Cortisol-d4) | Isotopically-labeled cortisol for precise quantification in LC-MS/MS. | Corrects for sample loss and ion suppression [18] |
| Salivette Collection Device | A device with a synthetic swab and tube for hygienic saliva collection. | Ideal for home-based CAR sampling [15] |
| 24-Hour Urine Collection Jug | A large, often pre-preserved, container for total urine collection. | Essential for accurate UFC measurement [3] |
Procedure A: Immunoassay (e.g., Roche e801)
- Calibration: Perform a full calibration of the analyzer using manufacturer-provided calibrators.
- Quality Control: Assay low and high QC materials to ensure the run is within acceptable parameters.
- Sample Preparation: For urinary cortisol, samples may require dilution with manufacturer-specified diluent (e.g., phosphate-buffered saline) if concentration exceeds the linear range. Saliva samples are often analyzed directly after centrifugation.
- Analysis: Load samples, reagents, and consumables onto the automated platform. The assay uses a competitive electrochemiluminescence principle. Results are calculated automatically against the calibration curve [18].
Procedure B: Liquid Chromatography-Tandem Mass Spectrometry (LC-MS/MS)
- Sample Preparation: Dilute urine samples (e.g., 20-fold with pure water). Add a fixed volume of internal standard solution (e.g., cortisol-d4) to an aliquot of the diluted sample. Vortex mix and centrifuge to precipitate particulates [18].
- Chromatographic Separation: Inject the supernatant into the LC system. Separation is achieved on a reversed-phase C8 or C18 column using a gradient of water and methanol as the mobile phase.
- Mass Spectrometric Detection: The eluent is ionized using electrospray ionization (ESI) in positive mode. Cortisol and the internal standard are detected and quantified using Multiple Reaction Monitoring (MRM) by monitoring specific ion transitions (e.g., 363.2 → 121.0 for cortisol) [18].
Diagram 2: Comparative analytical workflows for cortisol measurement.
Data Analysis and Interpretation
- CAR Calculation: The CAR is typically expressed as the area under the curve with respect to increase (AUCi) from the waking sample to 30-45 minutes post-awakening. The simple rise from waking to peak (nmol/L) is also commonly reported.
- Diurnal Rhythm Analysis: The diurnal slope can be calculated from multiple samples across the day. The Dim Light Melatonin Onset (DLMO) is a more robust marker of circadian phase but requires melatonin measurement [1].
- Method-Specific Cut-Offs: As established in Table 1, cut-off values for clinical decision-making are method-dependent. For example, the optimal UFC cut-off for diagnosing Cushing's syndrome ranged from 178.5 to 272.0 nmol/24h across different immunoassays [3] [17]. Therefore, laboratories must establish and validate their own reference ranges.
The accurate assessment of the Cortisol Awakening Response and diurnal cortisol rhythm is a critical tool for researchers and clinicians. While LC-MS/MS remains the gold standard for specificity, particularly in research settings requiring the highest accuracy, modern direct immunoassays offer a robust, high-throughput alternative for clinical practice. The consistent finding of a positive bias in immunoassays necessitates the use of method-specific reference intervals and cautions against the direct comparison of absolute values between different platforms. Future advancements in antibody specificity and multi-center standardization efforts will further enhance the reliability and clinical utility of cortisol measurements in circadian biology and stress research.
Circadian rhythms are intrinsic, near-24-hour cycles that regulate critical physiological processes, including sleep-wake cycles, hormone secretion, metabolism, and immune function [19]. The suprachiasmatic nucleus (SCN) in the hypothalamus acts as the master pacemaker, synchronizing peripheral clocks throughout the body [20]. At the molecular level, circadian rhythms are governed by transcriptional-translational feedback loops involving core clock genes such as BMAL1, CLOCK, PERIOD (PER), and CRYPTOCHROME (CRY) [20] [19].
Disruption of these precise rhythms is increasingly recognized as a significant contributor to disease pathogenesis across multiple organ systems. This application note explores the critical link between circadian disruption and disease, with a specific focus on the analytical methodologies advancing research in this field. Within the context of a broader thesis comparing LC-MS/MS and immunoassay for circadian hormone analysis, this document provides detailed protocols and data frameworks to support researchers and drug development professionals in this evolving discipline.
Circadian Disruption in Disease Pathogenesis
The relationship between circadian dysfunction and disease is bidirectional: circadian disruption can exacerbate disease pathology, while disease states can further disrupt circadian rhythms. The following sections detail key disease associations.
Neurodegenerative Diseases
Strong evidence links circadian rhythm disruption to age-related neurodegenerative diseases, including Alzheimer's disease (AD), Parkinson's disease (PD), and Huntington's disease (HD) [20]. Core clock genes regulate critical processes such as redox balance, mitochondrial function, and neuroinflammation, which are commonly disrupted in these conditions [20]. In AD, sleep disturbances often emerge early and can predict β-amyloid (Aβ) plaque formation [20]. Chronic sleep restriction aggravates key pathological processes, including the accumulation of Aβ plaques and tau protein tangles [20]. A study on acute intracerebral hemorrhage (ICH) patients found significantly disrupted circadian rhythms, with reductions in interdaily stability (IS), intradaily variability (IV), and relative amplitude (RA) compared to controls [21].
Endocrine and Metabolic Disorders
Cushing's syndrome (CS), a serious endocrine disorder characterized by prolonged elevated cortisol levels, relies on 24-hour urinary free cortisol (UFC) measurement as an initial diagnostic test [3] [18]. Shift work, which disrupts normal circadian rhythms, is associated with an increased risk of metabolic disorders, diabetes, and mood disorders [22]. The intricate relationship between circadian hormones is highlighted by research showing a clear correlation between melatonin metabolites and endogenous metabolites upstream and downstream of cortisol [22].
Oncology
Disrupted circadian rhythms are predictive of poor outcomes in patients with localized and advanced cancer, including survivors of breast, lung, and colorectal cancer [23]. The Blood Clock Correlation Distance (BloodCCD), a novel biomarker derived from RNA-sequencing of blood, assesses circadian disruption by analyzing a correlation matrix of 42 rhythmically oscillating genes [23]. Cancer survivors exhibit higher (worse) BloodCCD scores compared to healthy individuals, and insomnia severity significantly correlates with worse BloodCCD scores [23].
Analytical Methodologies for Circadian Biomarkers
Accurate assessment of circadian biomarkers is foundational to understanding their role in disease. The two primary analytical platforms are immunoassay and liquid chromatography-tandem mass spectrometry (LC-MS/MS).
Key Circadian Biomarkers
The hormones melatonin and cortisol represent crucial biochemical markers of circadian phase [19].
- Melatonin: The Dim Light Melatonin Onset (DLMO), the time when melatonin levels rise in the evening under dim light, is considered the most reliable marker of internal circadian timing [19].
- Cortisol: This hormone shows a characteristic diurnal rhythm with a morning peak. The Cortisol Awakening Response (CAR), a sharp rise within 30–45 minutes after waking, serves as an index of hypothalamic-pituitary-adrenal (HPA) axis activity [19].
LC-MS/MS vs. Immunoassay: A Comparative Analysis
The choice between LC-MS/MS and immunoassay involves trade-offs between specificity, throughput, cost, and accessibility.
Table 1: Comparison of Immunoassay and LC-MS/MS for Circadian Hormone Analysis
| Feature | Immunoassay | LC-MS/MS |
|---|---|---|
| Principle | Competitive or sandwich-based antibody binding [3] [18] | Physical separation and mass-based detection [3] [22] |
| Specificity | Moderate to low; prone to cross-reactivity [19] | High; minimal cross-reactivity [19] [22] |
| Multiplexing | Typically single-analyte | High; capable of simultaneous quantification of multiple hormones [22] |
| Sensitivity | Good for most clinical applications | Excellent; suitable for low-abundance analytes in saliva [19] |
| Throughput | High; automated platforms available [3] [18] | Moderate; requires longer analysis time |
| Cost & Complexity | Lower cost; widely available | Higher cost; requires specialized expertise [3] [18] |
| Sample Preparation | Simple (dilution) | Often complex (e.g., solid-phase extraction) [22] |
A recent study directly compared four new direct immunoassays (Autobio, Mindray, Snibe, Roche) with LC-MS/MS for urinary free cortisol measurement in Cushing's syndrome diagnosis [3] [18]. All immunoassays showed strong correlations with LC-MS/MS (Spearman r = 0.950–0.998) but exhibited a proportionally positive bias [3] [18]. The diagnostic accuracy for CS was high for all platforms (AUC >0.95), though the optimal cut-off values varied significantly between methods (178.5 to 272.0 nmol/24 h), underscoring the need for method-specific reference ranges [3] [18].
Table 2: Performance of Four Immunoassays for UFC Measurement vs. LC-MS/MS
| Platform | Spearman Correlation (r) with LC-MS/MS | Area Under Curve (AUC) | Sensitivity (%) | Specificity (%) |
|---|---|---|---|---|
| Autobio A6200 | 0.950 | 0.953 | 89.66 | 93.33 |
| Mindray CL-1200i | 0.998 | 0.969 | 93.10 | 96.67 |
| Snibe MAGLUMI X8 | 0.967 | 0.963 | 89.66 | 96.67 |
| Roche 8000 e801 | 0.951 | 0.958 | 89.66 | 96.67 |
Detailed Experimental Protocols
Protocol 1: Simultaneous Quantification of Urinary Circadian Hormones by UPLC-MS/MS
This protocol, adapted from a study on air traffic controllers, allows for the comprehensive profiling of multiple circadian hormones in overnight urine samples [22].
1. Sample Collection:
- Collect overnight urine samples over a specific interval (e.g., 23:00–09:00).
- Record total urine volume. Aliquot samples and store at -80°C until analysis.
2. Sample Preparation (Solid-Phase Extraction):
- Thaw urine samples and centrifuge to remove particulates.
- Internal Standard Addition: Add deuterated analogues of each target analyte to the urine sample.
- SPE Procedure: a. Use a 96-well Oasis HLB μElution Plate. b. Condition the plate with methanol and water. c. Load the urine sample. d. Wash with water and a water-methanol solution. e. Elute analytes with methanol.
3. UPLC-MS/MS Analysis:
- Chromatography:
- Column: HSS C18 column (e.g., 2.1 × 100 mm, 1.7 μm).
- Mobile Phase: (A) Water and (B) Methanol, both with 0.1% formic acid.
- Gradient Elution: 9-minute gradient from 5% B to 95% B.
- Flow Rate: 0.4 mL/min.
- Mass Spectrometry:
- Ionization: Positive electrospray ionization (ESI+).
- Detection: Multiple Reaction Monitoring (MRM).
- Data Acquisition: Monitor specific transitions for each analyte and its internal standard.
4. Data Analysis:
- Quantify concentrations using calibration curves constructed from spiked standards.
- Normalize hormone levels to urine creatinine if required.
Diagram 1: UPLC-MS/MS Urine Hormone Analysis Workflow
Protocol 2: Evaluation of Immunoassays for Urinary Free Cortisol
This protocol outlines the method for comparing the analytical and diagnostic performance of immunoassays against a reference LC-MS/MS method [3] [18].
1. Patient Cohort and Sample Preparation:
- Enroll confirmed CS patients and non-CS controls.
- Collect 24-hour urine samples from all participants. Store aliquots at -80°C.
2. Analytical Measurements:
- Reference Method: Analyze all samples using a validated laboratory-developed LC-MS/MS method [3] [18].
- Test Methods: Analyze the same sample set using the immunoassay platforms under evaluation (e.g., Autobio A6200, Mindray CL-1200i, Snibe MAGLUMI X8, Roche e801) according to manufacturers' instructions.
3. Data and Statistical Analysis:
- Method Comparison: Use Passing-Bablok regression and Bland-Altman plot analyses to assess agreement between each immunoassay and LC-MS/MS.
- Diagnostic Performance: Perform Receiver Operating Characteristic (ROC) curve analysis for each method to determine the area under the curve (AUC), optimal cut-off value (via Youden's index), sensitivity, and specificity.
Diagram 2: Immunoassay Evaluation Protocol
The Scientist's Toolkit: Essential Research Reagents and Materials
Table 3: Key Research Reagent Solutions for Circadian Hormone Analysis
| Item | Function/Application | Example/Note |
|---|---|---|
| LC-MS/MS Calibrators & Internal Standards | Quantification of hormones in biological matrices. | Deuterated analogues (e.g., cortisol-d4, melatonin-d4) are crucial for accurate LC-MS/MS quantification [18] [22]. |
| Automated Immunoassay Analyzers | High-throughput clinical measurement of single hormones. | Platforms include Autobio A6200, Mindray CL-1200i, Snibe MAGLUMI X8, Roche Cobas e801 [3] [18]. |
| Solid-Phase Extraction (SPE) Plates | Sample clean-up and analyte pre-concentration for LC-MS/MS. | 96-well Oasis HLB μElution Plates are effective for isolating steroid hormones and melatonin from urine [22]. |
| Chromatography Columns | UPLC separation of complex biological samples. | Reverse-phase columns like ACQUITY UPLC BEH C8 or HSS C18 are commonly used [18] [22]. |
| RNA Isolation & Globin Depletion Kits | Preparation for transcriptomic circadian biomarkers. | Required for BloodCCD analysis from whole blood; use kits like PAXgene Blood RNA Kit and GLOBINclear [23]. |
| Circadian Gene Panels | Assessment of molecular clock function from blood/tissue. | Pre-defined panels of 42 oscillating genes used for BloodCCD calculation [23]. |
The critical link between circadian disruption and disease pathogenesis underscores the importance of precise and reliable biomarker measurement. While modern direct immunoassays offer good diagnostic accuracy and simplified workflows suitable for high-throughput clinical settings, LC-MS/MS remains the gold standard for research applications requiring high specificity, multiplexing capability, and sensitivity for low-abundance analytes. The choice of platform should be guided by the specific research question, required specificity, and available resources. The continued development of robust protocols and novel biomarkers like BloodCCD will be instrumental in advancing our understanding of circadian physiology and developing chronotherapeutic interventions.
The accurate assessment of circadian rhythms is paramount in both clinical diagnostics and drug development, with the choice of biological matrix being a fundamental methodological consideration. Circadian rhythms, the endogenous near-24-hour oscillations that coordinate physiological functions, are primarily tracked using hormonal biomarkers such as cortisol and melatonin [7] [19]. The hormones exhibit distinct secretion patterns: cortisol peaks shortly after awakening and declines throughout the day, while melatonin rises in the evening, signaling the onset of the biological night [7] [24]. Analyzing these rhythms often involves a methodological comparison between immunoassays (IAs) and liquid chromatography-tandem mass spectrometry (LC-MS/MS) [3] [7]. While immunoassays are widely used, LC-MS/MS is increasingly recognized for its superior specificity, sensitivity, and capability for multiplexing, especially in the context of circadian rhythm research where precision in timing and concentration is critical [7] [25] [26]. This application note provides a detailed comparison of serum, saliva, and urine matrices, and details novel analytical approaches, providing structured protocols and data to guide researchers and scientists in the field of chronobiology and drug development.
Analytical Platform Comparison: LC-MS/MS vs. Immunoassay
The selection of an analytical platform directly impacts the reliability, specificity, and workflow of circadian hormone assessment.
Table 1: Comparison of Analytical Platforms for Circadian Hormone Measurement
| Feature | LC-MS/MS | Immunoassay (IA) |
|---|---|---|
| Specificity | High; distinguishes between parent compounds and structurally similar metabolites [25] [26] | Variable; susceptible to cross-reactivity with metabolites and precursors (e.g., 11-deoxycortisol) [27] [26] |
| Sensitivity | Superior; low limits of quantification (e.g., 0.013 ng/mL for urinary melatonin) [25] | Generally sufficient for clinical ranges, but may struggle with low salivary melatonin [7] |
| Multiplexing | High; capable of simultaneous analysis of multiple hormones and their metabolites (e.g., 14 biomarkers in a single run) [25] | Typically limited to single or a few analytes |
| Throughput & Workflow | Complex; requires skilled staff and extensive sample preparation [25] [27] | High; amenable to full automation, simplifying clinical workflow [3] [27] |
| Cost | High initial instrument investment and maintenance [27] | Lower per-test cost and instrument investment |
| Agreement with Reference | Gold standard [27] [26] | Good correlation possible but often with proportional positive bias [3] [26] |
A recent multicenter comparison highlighted that while immunoassays for salivary cortisol and testosterone showed strong correlations with LC-MS/MS (r ≥ 0.92 for cortisol), they tended to inflate estimated levels, particularly in the lower concentration range [26]. For urinary free cortisol (UFC), new direct immunoassays show strong correlation with LC-MS/MS (Spearman r = 0.950-0.998), but maintain a proportionally positive bias, necessitating method-specific cut-off values [3] [27].
Detailed Comparison of Sampling Matrices
The choice of matrix is dictated by the specific circadian marker of interest, required temporal resolution, and practical considerations of sample collection.
Table 2: Comparison of Biological Matrices for Circadian Hormone Assessment
| Matrix | Key Circadian Markers | Advantages | Disadvantages & Confounders |
|---|---|---|---|
| Serum/Plasma | Cortisol, Melatonin, Raptin [28] | High analyte concentration; well-established protocols; reflects total circulating hormone [7] | Invasive sampling; unsuitable for dense temporal sampling; reflects total (free + bound) hormone [7] |
| Saliva | Cortisol Awakening Response (CAR), Dim Light Melatonin Onset (DLMO) [7] [24] | Non-invasive; allows for frequent, ambulatory sampling; measures bioavailable free hormone [7] [24] | Low hormone concentrations require high-sensitivity assays; confounded by food, blood contamination, oral health [7] |
| Urine | 24-hour Urinary Free Cortisol (UFC), Melatonin Metabolites (e.g., 6-sulfatoxymelatonin) [3] [25] | Integrated measure over time (e.g., 24-hr); non-invasive; suitable for metabolite profiling [25] [24] | Requires complete collection; accuracy depends on creatinine correction or total volume; reflects past period, not real-time levels [3] |
| Novel Approaches | (Investigationally) Cortisol in sweat, interstitial fluid, and hair [24] | Hair: provides long-term retrospective assessment [24] | Largely investigational; require further validation for circadian applications [24] |
Serum/Plasma Applications
Serum is a traditional matrix for hormone analysis. A key application is the measurement of novel circadian hormones like Raptin, a sleep-induced hypothalamic hormone identified in both mice and humans. Its secretion peaks during the sleep phase, and deficiencies are linked to obesity and night eating syndrome [28].
Saliva Applications
Saliva is the matrix of choice for high-resolution circadian phase assessment, particularly for the Cortisol Awakening Response (CAR) and Dim Light Melatonin Onset (DLMO). Salivary DLMO is typically determined using a fixed threshold of 3–4 pg/mL or a variable threshold based on baseline values [7]. Precise timing of sample collection is critical, as is controlling for potential confounders like ambient light, body posture, and exact sampling times [7] [19].
Urine Applications
Urine provides an integrated measure of hormone secretion, making 24-hour Urinary Free Cortisol (UFC) a cornerstone for diagnosing Cushing's syndrome [3] [27]. Recent advancements enable simultaneous LC-MS/MS profiling of cortisol and melatonin metabolites, offering a holistic view of circadian rhythm status [25]. Key metabolites include 6-sulfatoxymelatonin (SaMT) and 6-hydroxycortisol, which show diurnal variation and can serve as sensitive biomarkers for circadian rhythm monitoring in both adults and children [25].
Experimental Protocols
This protocol describes a green chemistry approach for quantifying 14 biomarkers.
1. Sample Preparation:
- Collect urine in sterile containers. Record total volume for 24-hour collections.
- Centrifuge at 10,000 × g for 10 minutes to remove particulates.
- Aliquot 5 mL of supernatant for analysis.
2. Dispersive Liquid-Liquid Microextraction (DLLME):
- To the 5 mL urine aliquot, add 1 g of sodium chloride and vortex to dissolve.
- For the extraction, use a mixture of 750 µL of ethyl acetate (disperser solvent) and 250 µL of methyl tert-butyl ether (extraction solvent).
- Rapidly inject the solvent mixture into the urine sample using a syringe, forming a cloudy solution.
- Vortex vigorously for 2 minutes to ensure efficient extraction.
- Centrifuge at 5,000 × g for 5 minutes to separate the organic phase.
- Transfer the upper organic layer to a new tube and evaporate to dryness under a gentle nitrogen stream.
- Reconstitute the dry residue in 150 µL of a mobile phase mixture (e.g., 80:20 v/v acetonitrile/10 mM ammonium formate, pH 4.0) and vortex. Transfer to an autosampler vial for UPLC-MS/MS analysis.
3. UPLC-MS/MS Analysis:
- Column: Acquity UPLC BEH C18 (1.7 µm, 2.1 mm × 100 mm).
- Mobile Phase: A: 10 mM Ammonium Formate in Water; B: Acetonitrile.
- Gradient: 10% B to 95% B over 10 minutes.
- Flow Rate: 0.4 mL/min.
- Detection: Tandem Mass Spectrometry in Multiple Reaction Monitoring (MRM) mode.
- Validation Parameters: The method demonstrates recoveries of ~100%, precision <16% RSD, and limits of quantification from 0.013 ng/mL for melatonin to 0.79 ng/mL for β-cortolone [25].
1. Participant Preparation and Sampling:
- Instruct participants to avoid bright light for at least 1 hour before and during sampling. Maintain dim light conditions (<30 lux).
- Collect baseline saliva samples 5 hours before habitual bedtime.
- Continue sampling every 30–60 minutes until 1 hour after habitual bedtime. Use salivettes or similar collection devices.
- Participants must not eat, drink caffeinated beverages, or brush their teeth during the sampling window. Only water is permitted.
- Immediately freeze samples at -20°C or -80°C after collection.
2. Laboratory Analysis (LC-MS/MS is recommended):
- Thaw samples and centrifuge to collect clear saliva.
- Follow a validated LC-MS/MS protocol for salivary melatonin. The method should have sufficient sensitivity to detect levels below 1 pg/mL.
- A HILIC column with a silica stationary phase and a mobile phase of acetonitrile and formate buffer (pH 4.0) can be used for chromatographic separation of polar compounds [29].
3. DLMO Calculation:
- Plot melatonin concentration against clock time.
- The most common method is the fixed threshold, where DLMO is interpolated as the time when melatonin concentration crosses a threshold of 3 pg/mL or 4 pg/mL in saliva.
- An alternative is the dynamic threshold, defined as the time when melatonin levels exceed two standard deviations above the mean of three or more baseline values.
Signaling Pathways and Experimental Workflows
This diagram illustrates the hypothalamic regulation of key circadian hormones. The Suprachiasmatic Nucleus (SCN) integrates light input and times the secretion of hormones like Raptin (from the Paraventricular Nucleus, PVN), melatonin (from the pineal gland), and cortisol (via the HPA axis) [7] [28]. These hormones then mediate distinct physiological effects that define circadian rhythms.
This workflow chart outlines the generic process for circadian hormone analysis, from sample collection specific to each matrix through to data processing and interpretation, highlighting key steps like sample preparation and the choice of analytical finish.
The Scientist's Toolkit: Research Reagent Solutions
Table 3: Essential Research Reagents and Materials for Circadian Hormone Analysis
| Item | Function & Application | Example/Notes |
|---|---|---|
| LC-MS/MS Grade Solvents | Mobile phase preparation and sample extraction; critical for minimizing background noise and ion suppression. | Acetonitrile, Methanol, Water, Methyl tert-butyl ether (MTBE) for LDS-DLLME [25] |
| Solid-Phase Extraction (SPE) Cartridges | Purification and concentration of analytes from complex biological matrices like urine and serum. | Used for sample clean-up prior to LC-MS/MS analysis of urinary free cortisol or cytisine [29] [27] |
| Stable Isotope-Labeled Internal Standards | Normalization for sample loss during preparation and correction for matrix effects in LC-MS/MS quantification. | e.g., Deuterated Cortisol-d4, Melatonin-d4 for precise quantification [25] |
| Immunoassay Kits | Automated, high-throughput quantification of specific hormones on clinical analyzer platforms. | Roche Elecsys Cortisol III, Abbott Cortisol assay; require validation against LC-MS/MS [3] [27] |
| Saliva Collection Devices | Non-invasive collection of saliva for CAR and DLMO studies. | Salivettes; must be free of substances that interfere with hormone assays [7] |
| Validated Reference Materials | Calibration and quality control to ensure analytical accuracy and inter-laboratory consistency. | Certified standards for cortisol, melatonin, and their metabolites [26] |
Analytical Platforms in Practice: From Lab Setup to Data Generation
Immunoassays are cornerstone bioanalytical techniques that leverage the specific binding between an antibody and an antigen to detect and quantify molecules of biological interest. This application note focuses on two predominant immunoassay formats—the Enzyme-Linked Immunosorbent Assay (ELISA) and the Chemiluminescence Immunoassay (CLIA)—contextualizing their use within research that compares them to Liquid Chromatography Tandem Mass Spectrometry (LC-MS/MS) for the analysis of circadian hormones such as cortisol and melatonin. For researchers and drug development professionals, the choice between ELISA, CLIA, and LC-MS/MS involves critical trade-offs between throughput, sensitivity, cost, and the required level of specificity, particularly when measuring dynamic hormonal patterns [2] [24].
Principles of Operation
Core Immunoassay Mechanism
Both ELISA and CLIA are based on the fundamental principle of immunology that an antigen binds to a specific antibody. The primary difference lies in the detection method used to quantify this binding event [30]. The basic steps for developing and running an immunoassay include: coating a solid surface with a capture antibody or antigen; blocking non-specific binding sites; incubating with the sample and subsequent detection antibodies; washing away unbound reagents; and incubating with a substrate to generate a measurable signal [31].
ELISA Principles
ELISA is a widely used technique that relies on enzymatic reactions to produce a colorimetric, fluorescent, or chemifluorescent signal. The intensity of the signal, measured as optical density, is proportional to the concentration of the analyte in the sample [31] [30]. Several formats exist, including:
- Direct ELISA: A labeled primary antibody binds directly to the antigen.
- Indirect ELISA: A labeled secondary antibody binds to the primary antibody.
- Sandwich ELISA: The analyte is "sandwiched" between a capture antibody and a detection antibody, offering high specificity.
- Competitive ELISA: Useful for detecting small antigens, the sample antigen competes with a labeled antigen for a limited number of antibody binding sites [30].
CLIA Principles
CLIA represents a more recent advancement, combining immunoreactions with chemiluminescence technology. In CLIA, the antibody or antigen is labeled with a molecule (such as acridinium ester or an enzyme like Horseradish Peroxidase) capable of emitting light during a chemical reaction. The concentration of the analyte is determined based on the intensity of the emitted light, measured as Relative Light Units (RLUs) [32] [30]. This method offers a powerful combination of high sensitivity and a broad dynamic range.
Comparative Performance & Accessibility
The selection of an immunoassay platform requires careful consideration of performance characteristics and practical operational factors. The table below provides a structured comparison of ELISA and CLIA to guide this decision-making process.
Table 1: Comparative Analysis of ELISA and CLIA Performance and Operational Characteristics
| Characteristic | ELISA | CLIA | Key Implications for Circadian Research |
|---|---|---|---|
| Detection Principle | Colorimetric, Fluorometric | Chemiluminescence | CLIA's higher sensitivity is crucial for low-abundance hormones [30]. |
| Signal Measurement | Optical Density (OD) | Relative Light Units (RLU) | RLU provides a wider dynamic range for quantification [30]. |
| Sensitivity | Moderate | High | CLIA can detect lower concentrations, vital for nocturnal melatonin or nadir cortisol levels [33] [30]. |
| Specificity | High | High | Both methods can be highly specific with well-characterized antibodies [34]. |
| Assay Time | ~180 minutes [32] | ~30-60 minutes [32] [33] | Faster turnaround with CLIA supports higher throughput in longitudinal studies. |
| Throughput | Moderate (manual or semi-automated) | High (often fully automated) | CLIA automation enables continuous access and processing of large sample batches [33]. |
| Coefficient of Variation (CV) | 74.5% (reported for Anti-HBs) [32] | 113.1% (reported for Anti-HBs) [32] | Quantitative values may vary; clinical interpretation (e.g., protective/non-protective titer) shows high agreement (κ=0.84) [32]. |
| Sample Volume | 75 μL [32] | 150 μL [32] | Lower sample volume with ELISA can be advantageous for pediatric or high-frequency sampling studies. |
| Cost per Test | Low to Moderate [30] | High (instrumentation and reagents) [30] | ELISA is more cost-effective for labs with lower sample volumes or budget constraints. |
| Automation & Expertise | Requires technical expertise if manual [32] | Low technical expertise; often fully automated [32] | CLIA reduces operator-induced variability and is less demanding technically. |
Experimental Protocols
Detailed Protocol: Sandwich ELISA for Protein Detection
This protocol is adapted for quantifying a soluble protein, such as a circadian hormone-binding protein, in serum or plasma.
Day 1: Coating and Blocking
- Coating: Dilute the capture antibody in a carbonate-bicarbonate coating buffer (50 mM, pH 9.6). Add 100 μL per well to a 96-well high-binding microplate. Seal the plate and incubate overnight at 4°C.
- Washing: The following day, aspirate the contents of the wells and wash the plate three times with 300 μL per well of wash buffer (e.g., PBS or Tris-Buffered Saline with 0.05% Tween-20, PBST/TBST). Blot the plate on clean paper towels between washes.
- Blocking: Add 200 μL per well of blocking buffer (e.g., 1% BSA or 10% host serum in TBS) to block non-specific binding sites. Incubate for 1-2 hours at room temperature.
- Washing: Repeat the wash step as described in step 2.
Day 1: Sample and Detection Antibody Incubation
- Sample Incubation: Prepare standard curve dilutions and dilute samples in an appropriate matrix diluent (e.g., 1% BSA in PBST). Add 100 μL of standards, samples, and controls to designated wells. Incubate for 2 hours at room temperature.
- Washing: Repeat the wash step five times to ensure removal of unbound material.
- Detection Antibody: Dilute the biotinylated or enzyme-conjugated detection antibody in diluent buffer. Add 100 μL per well and incubate for 1-2 hours at room temperature.
- Washing: Repeat the wash step five times.
Day 1: Signal Development and Detection
- Streptavidin-HRP: If using a biotinylated detection antibody, dilute Streptavidin-Horseradish Peroxidase (HRP) conjugate in diluent buffer. Add 100 μL per well and incubate for 30-45 minutes at room temperature in the dark.
- Washing: Repeat the wash step seven times.
- Substrate Addition: Add 100 μL per well of a colorimetric HRP substrate, such as 3,3',5,5'-Tetramethylbenzidine (TMB). Incubate for 5-30 minutes at room temperature in the dark, monitoring color development.
- Stop Solution: Add 50-100 μL per well of stop solution (e.g., 2M H2SO4). The blue color will turn yellow.
- Reading: Measure the absorbance immediately at 450 nm using a microplate reader.
Detailed Protocol: CLIA for Hormone Quantification
This protocol outlines a generic CLIA procedure, suitable for automated platforms like the Abbott Architect or Siemens Atellica.
- Calibration: The system uses a previously generated calibration curve with multiple calibrators (e.g., 0, 10, 50, 100, 500, 1000 mIU/mL for Anti-HBs) [32].
- Sample Preparation: Centrifuge serum samples at 2500 × g for 6 minutes at 4°C to remove particulates [33].
- Assay Setup: Pipette the required sample volume (e.g., 150 μL) into the reaction vessel or well. The automated system handles subsequent reagent additions.
- Immunoreaction: The sample is incubated with paramagnetic microparticles coated with recombinant antigen (e.g., HBsAg) or antibodies. After incubation, acridinium-labeled conjugates are added [32].
- Washing: The system automatically performs wash cycles to separate bound and free fractions.
- Signal Generation: Pre-trigger and trigger solutions (e.g., acidic and basic hydrogen peroxide) are added to initiate the chemiluminescent reaction. The chemical excitation causes the label to emit photons [32] [30].
- Detection and Quantification: A photomultiplier tube measures the intensity of the emitted light in Relative Light Units (RLUs). The instrument's software calculates the analyte concentration in the sample by interpolating from the stored calibration curve [32].
The Scientist's Toolkit: Key Reagent Solutions
Successful implementation of immunoassays depends on high-quality reagents. The following table details essential materials and their functions.
Table 2: Essential Research Reagents for Immunoassay Development
| Reagent / Material | Function / Role in the Assay | Examples / Considerations |
|---|---|---|
| Matched Antibody Pairs | Critical for sandwich assays; one for capture, one for detection. | Must be affinity-purified and tested for specificity and lack of cross-reactivity [31]. |
| Analyte Standards | Calibrators used to generate the standard curve for quantification. | Should be highly pure and prepared in a matrix similar to the sample [31]. |
| Microplates | Solid surface to which the capture antibody or antigen is adsorbed. | Greiner high-binding, Costar EIA/RIA, Nunc [31]. |
| Blocking Buffers | Reduces non-specific binding by occupying remaining protein-binding sites. | 1% BSA, 10% host serum, or commercial protein-free blocks (e.g., Pierce) [31]. |
| Wash Buffers | Removes unbound reagents, reducing background signal. | PBS or Tris-Buffered Saline with 0.05% Tween-20 (PBST/TBST) [31]. |
| Enzyme Conjugates | Generates a measurable signal; conjugated to the detection antibody. | Horseradish Peroxidase (HRP) or Alkaline Phosphatase (ALP) [31] [30]. |
| Detection Substrates | Converted by the enzyme to produce a detectable signal. | Colorimetric (ELISA): TMB, OPD. Chemiluminescent (CLIA): Luminol, acridinium ester [31] [30]. |
Workflow and Pathway Visualizations
Diagram 1: ELISA and CLIA Workflow Comparison. The initial steps of immobilizing the capture molecule, blocking, and sample incubation are common to both sandwich-style ELISA and CLIA. The protocols diverge at the detection stage, where ELISA uses an enzymatic colorimetric reaction, and CLIA uses a light-emitting chemical reaction.
Diagram 2: Method Selection Pathway for Circadian Hormone Analysis. This decision pathway highlights the core trade-offs between the gold standard LC-MS/MS, high-performance CLIA, and cost-effective ELISA. The choice depends on project priorities regarding specificity, throughput, and budget.
ELISA and CLIA are both powerful and reliable immunoassay techniques with distinct advantages. ELISA remains a robust, cost-effective choice for laboratories with lower throughput needs or limited budgets. In contrast, CLIA offers superior sensitivity, automation, and speed, making it ideal for high-volume testing environments. In the specific context of circadian hormone research, where sensitivity to detect low-amplitude rhythms and throughput for longitudinal sampling are paramount, CLIA presents a compelling alternative. However, researchers must be cognizant of potential cross-reactivity with structurally similar molecules, a limitation where LC-MS/MS retains its superiority due to its unparalleled specificity based on mass-to-charge separation. The decision ultimately rests on a balanced consideration of analytical requirements, operational capacity, and financial resources.
Liquid Chromatography-Tandem Mass Spectrometry (LC-MS/MS) has emerged as a cornerstone technology in modern bioanalysis, particularly for the precise quantification of circadian rhythm hormones. Within circadian biology research, where accurate measurement of melatonin, cortisol, and their metabolites is critical for assessing physiological timing, LC-MS/MS offers transformative advantages over traditional immunoassays. This technical note details the specific methodologies, validation parameters, and application protocols that establish LC-MS/MS as the gold standard for circadian hormone analysis, providing researchers and drug development professionals with a framework for implementing this powerful technology.
Comparative Analytical Performance
The selection of an analytical platform for circadian biomarker quantification directly impacts data reliability, with LC-MS/MS demonstrating consistent superiority across key performance metrics compared to immunoassays.
Table 1: Performance Comparison of LC-MS/MS vs. Immunoassays for Circadian Hormone Analysis
| Performance Parameter | LC-MS/MS | Immunoassay | Experimental Basis |
|---|---|---|---|
| Specificity | High (Resolves analytes by mass & fragmentation) [7] | Moderate (Subject to cross-reactivity) [7] [10] | Simultaneous quantification of cortisol, cortisone, and corticosterone without interference [35] |
| Sensitivity (LLOQ) | Melatonin: 2.15 pmol/L; Cortisol: 0.14 nmol/L [10] | Less sensitive, especially for low salivary melatonin [10] | Functional sensitivity sufficient for detecting DLMO in low-producers [7] [10] |
| Multiplexing Capability | High (Simultaneous analysis of multiple hormones) [36] [35] | Low (Typically single-analyte tests) [35] | Single method for 9 urinary hormones (melatonin, metabolites, corticosteroids) [35] |
| Accuracy/Mean Bias | Reference method [10] | Melatonin: 23.2%; Cortisol: 48.9% [10] | Significant positive bias in immunoassays versus LC-MS/MS reference [10] |
| Precision (CV%) | Intra-assay: <5%; Inter-assay: <7% [10] | Typically higher variability | Precision demonstrated for salivary melatonin and cortisol across validation runs [10] |
| Sample Volume | Low (e.g., 300 μL saliva for multi-analyte) [10] | Higher per analyte (separate tests needed) | Efficient use of precious clinical samples [10] |
The core strength of LC-MS/MS lies in its unparalleled specificity. Unlike immunoassays, which rely on antibody binding and are susceptible to cross-reactivity with structurally similar molecules, LC-MS/MS physically separates analytes by chromatography and identifies them based on their unique mass-to-charge ratio and fragmentation pattern [7]. This is crucial for accurately measuring low-concentration analytes like salivary melatonin and for distinguishing between cortisol and its inactive metabolite, cortisone [10] [35].
Furthermore, the inherent multiplexing capability of LC-MS/MS allows for the simultaneous quantification of a panel of circadian biomarkers from a single sample injection. This generates a comprehensive hormonal profile, maximizing information yield from precious clinical samples and simplifying complex study designs, such as those investigating the interplay between the HPA axis and pineal gland activity [36] [35].
Detailed Experimental Protocol for Salivary Melatonin and Cortisol
The following protocol, adapted from validated methods, ensures reliable simultaneous quantification of salivary melatonin and cortisol for circadian phase assessment (e.g., DLMO and CAR) [10].
Materials and Equipment
Table 2: Research Reagent Solutions and Essential Materials
| Item/Category | Specific Examples & Specifications | Function/Purpose |
|---|---|---|
| LC-MS/MS System | Agilent 6490 Tandem MS with 1260 HPLC; QqQ or similar high-sensitivity mass spectrometer [10] | Analyte separation, ionization, and detection |
| Chromatography Column | C18, 2.1 x 50 mm, 2.6 μm (e.g., Kinetex) [10] | Reverse-phase separation of analytes |
| Mass Spectrometry Solvents | 2 mM Ammonium Acetate in water (Mobile Phase A); 0.1% Formic Acid in Acetonitrile (Mobile Phase B) [10] | LC mobile phase for optimal separation and ionization |
| Internal Standards (IS) | Deuterated analogues: Melatonin-d4, Cortisol-d4 [10] [35] | Normalizes for variability in extraction and ionization |
| Sample Preparation | Methyl tert-butyl ether (MTBE) [10] | Liquid-liquid extraction of analytes from saliva |
| Calibrators & QC Materials | Pure analyte standards (Melatonin, Cortisol); Charcoal-stripped saliva or artificial saliva [10] | Calibration curve construction and quality control |
Step-by-Step Procedure
Step 1: Sample Collection and Preparation
- Collect saliva samples using standardized procedures (e.g., drooling into polypropylene tubes). Chewing on inert material like Parafilm can stimulate flow.
- Clarify samples by centrifugation (e.g., 2,500–3,000 x g for 10–15 minutes) to remove mucins and debris.
- Aliquot and store supernatants at ≤ -20°C until analysis.
Step 2: Sample Extraction
- Aliquot: Transfer 300 μL of saliva into a microcentrifuge tube.
- Spike: Add 20 μL of internal standard working solution (e.g., Melatonin-d4 and Cortisol-d4).
- Extract: Add 1,000 μL of methyl tert-butyl ether (MTBE). Seal the tube securely.
- Mix: Vortex vigorously for 30 minutes to ensure complete partitioning of analytes into the organic phase.
- Centrifuge: Spin at 20,600 x g for 10 minutes to separate phases.
- Transfer & Evaporate: Carefully transfer 930 μL of the upper (organic) layer to a new tube or a 96-deep well plate. Evaporate to dryness under a gentle stream of nitrogen or using a microplate evaporator.
- Reconstitute: Reconstitute the dry residue in 100 μL of 20% (v/v) methanol. Vortex mix for 30 minutes to ensure complete dissolution [10].
Step 3: Liquid Chromatography (LC)
- Injection Volume: 20 μL.
- Column Temperature: Maintain constant (e.g., 40°C).
- Mobile Phase:
- A: 2 mM Ammonium Acetate in water.
- B: 0.1% Formic Acid in Acetonitrile.
- Gradient Elution:
- Initial: 20% B.
- Ramp to 95% B over several minutes.
- Hold, then re-equilibrate to initial conditions.
- Flow Rate: 250 μL/min.
- Total Run Time: Approximately 6–9 minutes [10] [35].
Step 4: Tandem Mass Spectrometry (MS/MS)
- Ionization: Electrospray Ionization (ESI) in positive mode.
- Detection: Multiple Reaction Monitoring (MRM).
- Source Parameters: Optimize for gas flows and temperatures.
- MRM Transitions: Monitor specific precursor ion → product ion transitions for each analyte and its internal standard.
Step 5: Data Analysis
- Integrate peak areas for each analyte and its corresponding internal standard.
- Calculate peak area ratios (Analyte/IS).
- Generate a calibration curve by plotting the peak area ratio against the known concentration of the calibrators using linear regression with 1/x² weighting.
- Use the resulting equation to calculate unknown sample concentrations.
Advanced Application: Multiplexed Urinary Circadian Metabolite Profiling
Expanding beyond saliva, LC-MS/MS enables comprehensive rhythm assessment in urine, capturing a broader profile of hormonal activity.
Protocol Highlights for Urine Analysis
- Sample Preparation: Utilize Solid Phase Extraction (SPE) for cleaner extracts from the complex urine matrix. This step efficiently removes salts and other interferences prior to LC-MS/MS analysis [35].
- Extended Multiplexing: A single UPLC-MS/MS method can simultaneously quantify nine endogenous hormones, including:
- Melatonin and its metabolites (6-hydroxymelatonin, 6-sulfatoxymelatonin).
- HPA axis steroids (cortisol, corticosterone, cortisone).
- Androgens (testosterone, epitestosterone, androsterone) [35].
- Chromatography: Employ a 9-minute gradient elution on a reverse-phase column (e.g., HSS C18) for rapid and resolved separation of this wide panel of analytes [35].
- Data Utility: This holistic profile allows for investigating relationships between different hormonal pathways and provides robust circadian phase data for populations like shift workers [35].
Analytical Validation and Quality Control
For reliable data, the LC-MS/MS method must be rigorously validated. Key parameters and typical performance criteria are listed below.
Table 3: Essential Validation Parameters for a Circadian Hormone LC-MS/MS Assay
| Validation Parameter | Acceptance Criterion | Demonstrated Performance Example |
|---|---|---|
| Linearity | Correlation coefficient (r) > 0.99 | r = 0.997 for Melatonin; r = 0.999 for Cortisol [10] |
| Accuracy (Recovery) | 85–115% | 96.9–107.8% for Cortisol [10] |
| Precision (CV%) | Intra-assay < 15% (LLOQ < 20%); Inter-assay < 15% | Intra-assay CV < 4.9% for Melatonin [10] |
| Lower Limit of Quantification (LLOQ) | Signal/Noise > 10; CV and Bias < 20% | Melatonin: 2.15 pmol/L; Cortisol: 0.14 nmol/L [10] |
| Matrix Effect | Consistent and compensated by IS | 92.1–97.7% for Melatonin (compensated with IS) [10] |
| Carry-over | < 20% of LLOQ in blank after high calibrator | Not significant in validated method [10] |
| Extraction Recovery | Consistent and high | ~100–103% for both Melatonin and Cortisol [10] |
LC-MS/MS methodology provides an unambiguous analytical advantage for circadian hormone research and related drug development. Its core attributes of unparalleled specificity, sensitivity at physiologically relevant concentrations, and robust multiplexing capability make it an indispensable tool for generating high-quality data. The detailed protocols and validation frameworks provided herein serve as a foundational guide for implementing this powerful technology, ultimately driving more precise assessments of circadian phase and advancing the field of circadian medicine.
Dim Light Melatonin Onset (DLMO) is the gold standard biomarker for assessing the phase of the human circadian clock [19]. It represents the time in the evening when melatonin concentration in the blood or saliva begins to rise significantly under dim light conditions. Accurate DLMO measurement is crucial for diagnosing circadian rhythm sleep-wake disorders, optimizing chronotherapy timing for drug administration, and investigating the impacts of circadian disruption on health [19] [37]. This protocol deep-dive examines the detailed methodologies for DLMO assessment, with a specific focus on the comparative analytical performance of Liquid Chromatography-Tandem Mass Spectrometry (LC-MS/MS) and immunoassays, situating this discussion within broader research on circadian hormone analysis.
Core Principles and Biological Basis
The circadian system is governed by a master pacemaker in the suprachiasmatic nucleus (SCN) of the hypothalamus, which generates and coordinates near-24-hour rhythms in physiology and behavior [38] [19]. The SCN is entrained primarily by the light-dark cycle but also by other non-photic cues. The molecular clock machinery consists of interlocking transcriptional-translational feedback loops involving core clock genes such as CLOCK, BMAL1 (ARNTL1), PER, and CRY [19].
Melatonin secretion from the pineal gland is a key hormonal output of the SCN. Its production is suppressed by light and elevated in darkness, making it a robust proxy for internal circadian time [19]. DLMO typically occurs 2-3 hours before habitual sleep time [19]. The following diagram illustrates the physiological pathway regulating melatonin secretion and its relationship to DLMO.
Pre-Sampling Considerations and Experimental Design
Sampling Window Selection
Determining the appropriate sampling window is critical for capturing DLMO without requiring an exhaustive 24-hour profile. Traditional protocols involve sampling over 6-9 hours, but recent advances demonstrate efficacy with shorter windows.
- Standard Protocol: Saliva samples are typically collected hourly or every 30 minutes for 4-6 hours before habitual bedtime [19]. A common window is from 5 hours before to 1 hour after habitual bedtime [19].
- Targeted Short Protocol: A novel framework reduces the sampling window to just 5 hours by combining wearable sleep-wake data with mathematical modeling to predict DLMO prospectively. The targeted window spans from 3 hours before to 2 hours after the estimated DLMO [39]. This approach has successfully identified DLMO in shift workers, a population for which traditional methods often fail [39].
Controlling Confounding Factors
Rigorous control of environmental and behavioral factors is essential for a valid DLMO measurement.
- Light Levels: Sampling must occur in dim light conditions, typically defined as <10–50 lux [40] [37]. Participants should avoid bright light for several hours before and during sampling.
- Posture and Activity: Participants should remain seated or recumbent and avoid vigorous activity before and during sampling, as posture changes and exercise can influence melatonin levels.
- Diet and Substance Avoidance: Participants should refrain from eating, drinking caffeinated beverages, or brushing teeth immediately before and during sampling, as these can interfere with salivary assays. Alcohol and certain medications (e.g., beta-blockers, NSAIDs) that affect melatonin secretion should be avoided for an appropriate duration before the study [19].
- Sample Integrity: For at-home collection, clear instructions must be provided on handling samples, including immediate freezing after collection [41] [40].
Sample Collection and Handling Protocols
Biological Matrix Selection
DLMO can be measured in plasma, saliva, or urine, each with distinct advantages and limitations.
| Matrix | Key Advantages | Key Limitations | Common Use Cases |
|---|---|---|---|
| Saliva | Non-invasive, suitable for at-home collection, reflects free hormone fraction [41] [40] [19] | Lower analyte concentration, potential for interference, requires sensitive assays [19] | Ambulatory and at-home studies, pediatric populations, frequent sampling |
| Plasma/Serum | Higher analyte concentration, considered more reliable for some assays [19] [37] | Invasive, requires clinical setting or phlebotomy skills, less suitable for frequent sampling | Gold-standard research protocols, clinical diagnostics where highest accuracy is required |
| Urine | Non-invasive, integrates hormone production over time | Does not provide precise phase markers like DLMO, difficult to correlate with exact clock time | Assessing overall rhythmicity and hormone output over 24 hours |
Saliva has become the preferred matrix for most research and clinical applications due to its non-invasive nature, which facilitates at-home collection and higher-frequency sampling [19].
Detailed Saliva Collection Protocol
The following workflow outlines the standardized procedure for saliva sample collection intended for DLMO analysis.
Key Steps:
- Participant Preparation: Provide participants with a pre-study kit and instructions to abstain from food, caffeine, alcohol, and tooth-brushing for at least 30-60 minutes before each sample [41] [40].
- Dim Light Conditions: Confirm that the sampling environment maintains dim light (<20 lux) for at least one hour before and throughout the collection period [40].
- Sample Collection: Use standardized collection devices (e.g., Salivettes). For subsequent RNA analysis, studies have optimized protocols using 1.5 mL of saliva mixed 1:1 with an RNA stabilizer like RNAprotect [42].
- Storage and Transport: Freeze samples immediately at -20°C or -80°C after collection. Transport to the analytical laboratory on dry ice to prevent degradation [41].
Analytical Methodologies: LC-MS/MS vs. Immunoassays
The choice of analytical technique significantly impacts the sensitivity, specificity, and overall reliability of DLMO measurements. The table below provides a quantitative comparison of the two primary methodologies.
Table 2: Quantitative Comparison of LC-MS/MS and Immunoassays for Hormone Analysis
| Parameter | LC-MS/MS | Immunoassays (ELISA, RIA, CLIA) | Supporting Evidence |
|---|---|---|---|
| Analytical Specificity | High (separates analytes by mass) | Moderate to Low (prone to cross-reactivity) | [26] [18] [11] |
| Sensitivity (Lower Limit of Quantification) | Superior for low-concentration analytes in saliva [19] | Variable; may be insufficient for salivary melatonin | [26] [19] |
| Correlation with Reference Method | Reference method | Spearman's r ≥ 0.85-0.92 for cortisol/testosterone vs. LC-MS/MS, but poorer for some hormones [26] [11] | [26] [18] [11] |
| Interference with Low-Level Samples | Minimal | Tends to overestimate concentrations in lower ranges [26] [11] | [26] [11] |
| Throughput & Cost | Lower throughput, higher equipment cost | Higher throughput, lower per-sample cost | [18] [19] |
Liquid Chromatography-Tandem Mass Spectrometry (LC-MS/MS)
LC-MS/MS is increasingly regarded as the superior technique for hormonal circadian biomarker analysis due to its high specificity and sensitivity.
- Principle: The technique involves separating analytes in a sample by liquid chromatography followed by detection and quantification based on their unique mass-to-charge ratio in a mass spectrometer.
- Performance: LC-MS/MS consistently demonstrates the best performance across validation criteria for salivary cortisol and testosterone, showing excellent correlation with known physiological fluctuations [26]. It suffers minimal cross-reactivity, which is critical for accurately measuring low levels of melatonin in saliva [19].
Immunoassays
Immunoassays, including Enzyme-Linked Immunosorbent Assay (ELISA), Radioimmunoassay (RIA), and Chemiluminescence Immunoassay (CLIA), are widely used due to their accessibility and lower cost.
- Principle: These methods use antibodies to detect and quantify specific hormones. The binding event is measured via an enzymatic, radioactive, or luminescent signal.
- Limitations and Considerations: Immunoassays are prone to cross-reactivity with structurally similar molecules, leading to overestimation of hormone concentrations, particularly at low levels [26] [11] [19]. While some newer immunoassays show strong correlations with LC-MS/MS for analytes like urinary free cortisol (Spearman r=0.950-0.998) [18], their performance for salivary melatonin is often less reliable. Caution is advised when selecting and validating an immunoassay for DLMO studies [26] [19].
The following diagram summarizes the analytical workflow from sample to result for both primary methods.
DLMO Calculation and Data Analysis
After melatonin concentrations are determined, DLMO is calculated from the time series data. Several established methods exist, each with strengths and weaknesses.
Table 3: Comparison of Methods for Calculating DLMO from Melatonin Profiles
| Method | Description | Advantages | Limitations | Repeatability & Agreement |
|---|---|---|---|---|
| Fixed Threshold | Time when interpolated melatonin concentration crosses a pre-defined absolute threshold (e.g., 3 pg/mL or 4 pg/mL for saliva). | Simple, widely used. | Fails for "low secretors"; threshold is assay-dependent. | Good to perfect repeatability [37] |
| Dynamic Threshold | Time when concentration rises >2 SD above the mean of 3-5 baseline samples. | Adapts to individual's baseline. | Unreliable with few or noisy baseline samples; can produce early estimates [19] [37]. | Good to perfect repeatability [37] |
| Hockey Stick Algorithm | Fits a biphasic linear model to identify the point of sharpest increase (the "elbow"). | Objective, automated, not reliant on baseline stability. | Requires specialized software or coding. | Highest agreement with expert visual estimation (ICC: 0.95, mean difference: 5 min) [37] |
A repeatability and agreement study published in 2023 found that while all four methods (including visual inspection) showed good to perfect repeatability across two nights, the hockey stick method demonstrated superior agreement with the mean visual estimation of four chronobiologists, with an intraclass correlation coefficient (ICC) of 0.95 and a mean difference of only 5 minutes [37]. This supports its use as the most reliable objective method for DLMO estimation.
The Scientist's Toolkit: Essential Research Reagent Solutions
Table 4: Key Materials and Reagents for DLMO Research
| Item / Solution | Function / Application | Technical Notes |
|---|---|---|
| Saliva Collection Device (e.g., Salivette) | Non-invasive collection of whole saliva; includes a cotton swab and centrifuge tube. | Allows for easy collection and recovery of clear saliva after centrifugation. |
| RNA Stabilizer (e.g., RNAprotect) | Preserves RNA in saliva for concurrent gene expression analysis of core clock genes. | A 1:1 ratio with 1.5 mL saliva is an optimized protocol for yield and quality [42]. |
| Melatonin Immunoassay Kit (ELISA, RIA, CLIA) | Quantifies melatonin concentration in saliva/serum. | Select kits with validated sensitivity for salivary levels; be aware of cross-reactivity. |
| LC-MS/MS Instrumentation & Solvents | Gold-standard quantification of melatonin and other steroid hormones (cortisol, testosterone). | Requires high-purity methanol, water, and internal standards (e.g., cortisol-d4) [18]. |
| Dim Light Monitoring Device (Lux Meter) | Verifies ambient light intensity is <10-20 lux during pre-sampling and collection periods. | Critical for protocol adherence and valid DLMO assessment. |
| Absolute Melatonin Standard | Essential for calibrating both immunoassays and LC-MS/MS instruments. | Enables accurate and traceable quantification. |
Accurate measurement of DLMO is a cornerstone of human circadian research and clinical practice. This detailed protocol highlights that success depends on a multifaceted approach: rigorous pre-sampling controls, a well-defined sampling window, appropriate choice of biological matrix, and, crucially, the selection of an analytical method with sufficient sensitivity and specificity. The evidence strongly supports LC-MS/MS as the superior analytical technique for research requiring the highest accuracy, particularly in the context of comparing hormone analysis methods, due to its minimal cross-reactivity and excellent performance at low concentrations. For DLMO calculation, the hockey stick algorithm offers an objective and highly reliable alternative to traditional threshold methods. By integrating these refined protocols—from controlled sample collection to high-fidelity analysis—researchers can robustly capture the phase of the human circadian clock, advancing both fundamental understanding and clinical applications in circadian medicine.
The Cortisol Awakening Response (CAR) is a distinct and crucial phenomenon in human circadian biology, defined as the sharp increase in cortisol secretion that occurs during the first 30–45 minutes after morning awakening [43] [44]. This response is superimposed upon the broader diurnal cortisol rhythm, which features peak levels in the early morning and a steady decline throughout the day and evening [45]. The CAR is driven by the hypothalamic-pituitary-adrenal (HPA) axis and is influenced by the circadian timing system, making it a unique marker that combines elements of both endocrine reactivity and circadian regulation [43]. Its significance extends beyond a simple hormonal fluctuation; it is believed to prepare the body for the anticipated challenges of the day ahead, essentially "boosting" an individual's preparedness and cognitive performance [46].
Accurate assessment of the CAR is technically challenging but holds substantial value for both research and clinical practice. A robust or blunted CAR has been consistently associated with a range of physiological and psychological conditions. Evidence links atypical CAR patterns to chronic stress, metabolic syndrome, major depression, burnout, and post-traumatic stress disorder (PTSD) [47] [46]. Consequently, the reliable measurement of the CAR provides a critical window into the functional integrity of the HPA axis and an individual's adaptive stress capacity. Its non-invasive assessment via saliva sampling offers high ecological validity, allowing for measurement in a participant's natural environment [43] [44]. However, this same characteristic demands rigorous methodological control to ensure data validity, as the CAR's quantification is highly sensitive to sampling protocol adherence [43].
Methodological Foundations and Expert Consensus Guidelines
The validity of CAR measurement critically depends on researchers and clinicians closely following a timed sampling schedule beginning at the moment of awakening. To promote best practices, the International Society of Psychoneuroendocrinology (ISPNE) convened an expert panel, which published consensus guidelines for CAR assessment [44]. A subsequent evaluation revealed that adherence to these guidelines, particularly concerning objective verification of sampling times, remained disappointingly low in published research [43]. This protocol deep-dive emphasizes the updated expert consensus to ensure reliable and reproducible CAR data.
Core Sampling Protocol
The foundational element of CAR assessment is a strict sampling protocol designed to capture the dynamic change in cortisol concentration after awakening.
- Sampling Time Points: Collection of at least two saliva samples is required: one immediately upon awakening (Sample 1, S1) and a second 30 minutes later (Sample 2, S2). A third sample at 45 minutes post-awakening can provide a more detailed response curve [43] [46].
- Sampling Schedule Adherence: Participants must begin sampling at the exact moment of awakening. Delays of even 5 to 15 minutes can lead to significant over- or underestimation of the CAR magnitude, rendering the data invalid [46].
- Objective Compliance Monitoring: Given the critical importance of timing, the expert consensus guidelines strongly recommend the use of objective methods to verify awakening and sampling times. This can be achieved using electronic devices such as TrackCaps, which record the time a sample tube is opened, or integrated systems with actigraphy and ambulatory data loggers [47] [43].
- Participant Instructions: Participants should be thoroughly instructed to avoid certain behaviors in the 15-30 minutes before each sample collection, including eating, drinking (except water), brushing their teeth, and smoking, as these can interfere with salivary cortisol levels [47].
Quantification of the CAR
The CAR can be quantified using several metrics, each offering a different perspective on the response. The most common are summarized in the table below.
Table 1: Key Quantification Methods for the Cortisol Awakening Response
| Metric | Calculation Method | Interpretation | Key Considerations |
|---|---|---|---|
| Increase (Absolute) | S2 (30 min) - S1 (0 min) | Represents the absolute change in cortisol concentration (nmol/L). | A simple and intuitive measure of the change in level. |
| Area Under the Curve with respect to Increase (AUCᵢ) | Formula incorporating all sample times to calculate the area that reflects the dynamic increase post-awakening [43]. | A comprehensive measure of the total cortisol secretion specifically related to the awakening response. | Considered a robust and preferred measure as it captures the total post-awakening surge [43]. |
The following diagram illustrates the standard sampling protocol, the resulting cortisol curve, and the primary quantification metrics, highlighting the critical relationship between precise timing and accurate data interpretation.
Analytical Techniques: LC-MS/MS vs. Immunoassay
The choice of analytical platform for quantifying salivary cortisol is a critical decision that directly impacts the sensitivity, specificity, and overall reliability of CAR data. The two primary techniques are immunoassay and liquid chromatography-tandem mass spectrometry (LC-MS/MS), with the latter emerging as the superior method, particularly for rigorous research.
Performance Comparison
A direct method comparison study highlights the significant analytical advantages of LC-MS/MS. The study, which involved 121 saliva samples, found that while immunoassays and LC-MS/MS showed a strong correlation (Pearson’s r=0.955 for cortisol), immunoassays demonstrated a substantial mean bias of 48.9% compared to the LC-MS/MS reference method [10]. This level of inaccuracy is unacceptable for precisely quantifying the dynamic, time-sensitive changes of the CAR.
Table 2: Comparative Analysis of LC-MS/MS and Immunoassay for Salivary Cortisol Measurement
| Characteristic | LC-MS/MS | Immunoassay |
|---|---|---|
| Specificity | High. Minimizes cross-reactivity with other steroids (e.g., cortisone) due to chromatographic separation and specific mass detection [7] [10]. | Low to Moderate. Susceptible to cross-reactivity with structurally similar molecules, leading to overestimation of cortisol concentration [10]. |
| Sensitivity | Excellent. Lower Limit of Quantification (LLOQ) can be as low as 0.14 nmol/L, suitable for detecting low late-night levels [10]. | Variable, often insufficient. Detection limits may be close to the low concentrations found in late-night saliva, compromising accuracy [10]. |
| Multiplexing Capability | High. Can simultaneously quantify multiple circadian biomarkers (e.g., cortisol, melatonin, and their metabolites) in a single run [7] [22]. | None. Each analyte requires a separate, dedicated test run. |
| Throughput & Cost | Higher initial instrument cost; lower cost-per-analyte in multiplex scenarios. Requires specialized expertise. | Lower initial cost and technically simpler; higher cost-per-analyte when measuring multiple hormones. |
| Data Evidence | LLOQ: 0.14 nmol/L; Mean Bias vs. LC-MS/MS: N/A (Reference Method) [10]. | Significant positive bias; Mean Bias vs. LC-MS/MS: +48.9% [10]. |
The Case for LC-MS/MS in Circadian Rhythm Analysis
For a comprehensive assessment of the circadian system, the ability of LC-MS/MS to simultaneously quantify multiple hormones is a game-changer. Research has successfully developed methods to measure not just cortisol, but also melatonin—the key marker of the biological night—and their related metabolites in a single assay [22] [10]. This multi-analyte approach provides a more integrated and physiologically complete picture of circadian phase and HPA axis activity. The high specificity of LC-MS/MS is particularly crucial for accurately determining the cortisol-to-cortisone ratio, which is a relevant metric of 11β-HSD enzyme activity and can be skewed by immunoassay cross-reactivity [46]. Therefore, for research and clinical applications demanding high precision and a holistic biomarker profile, LC-MS/MS is the unequivocal gold standard.
Detailed Experimental Protocol for CAR Assessment
This section provides a step-by-step protocol for capturing the CAR, integrating expert guidelines and the LC-MS/MS analytical approach.
Pre-Collection Phase: Participant Preparation and Kit Assembly
- Informed Consent & Screening: Obtain ethical approval and informed consent. Screen participants for exclusion factors: use of corticosteroid medications, recent transmeridian travel, rotating night-shift work, and untreated endocrine disorders [43].
- Comprehensive Briefing: Conduct a thorough training session with participants. Emphasize the non-negotiable importance of adherence to the sampling schedule.
- Kit Assembly: Provide participants with a pre-packaged kit containing:
- Saliva collection tubes (e.g., Salivettes).
- A dedicated device for objective time verification (e.g., an electronic data logger or a smartphone app with time-stamping functionality).
- A detailed instruction sheet with a sample collection log.
- A cold pack and an insulated bag for temporary sample storage.
Sample Collection Phase: At-Home Protocol
- Night Before: Participants should avoid strenuous exercise, alcohol, and large meals late in the evening. They should record their bedtime.
- Upon Awakening (S1, 0 min): Immediately upon waking, participants must:
- Record the exact wake-up time in the log and start the objective time verification as trained.
- Provide the first saliva sample (S1) without delay.
- Remain in a relaxed state, avoiding the prohibited activities.
- 30 Minutes Post-Awakening (S2, 30 min): Exactly 30 minutes after the recorded awakening time, provide the second saliva sample (S2). The participant should still be at rest.
- Optional 45-Minute Sample (S3, 45 min): For a more detailed curve, collect a third sample 45 minutes after awakening.
- Post-Collection Storage: Participants should immediately place saliva samples in their refrigerator or, if provided, in an insulated bag with a cold pack. Samples must be returned to the laboratory as soon as possible, typically within 1-3 days, where they are stored at -20°C or -80°C until analysis.
Post-Collection Phase: Sample Analysis and Data Processing
- Adherence Verification: Before analysis, check objective time-stamp data against self-reported logs. Exclude samples with significant timing deviations (>5 minutes) from analysis [46].
- LC-MS/MS Analysis:
- Thawing and Preparation: Thaw saliva samples completely and centrifuge to precipitate mucins and debris.
- Solid Phase Extraction (SPE): Pass a defined aliquot of clear saliva (e.g., 300 μL) through a hydrophilic-lipophilic balance (HLB) SPE plate for purification and concentration [22].
- Chromatographic Separation: Inject the extracted sample into an UPLC system equipped with a reverse-phase C18 column. A gradient elution with water and acetonitrile as mobile phases separates cortisol from other analytes over a short run time (e.g., 6-9 minutes) [22] [10].
- Mass Spectrometric Detection: Analyze the eluent using tandem mass spectrometry in positive ion mode with Multiple Reaction Monitoring (MRM) for highly specific detection and quantification of cortisol [10].
- Data Quantification: Calculate cortisol concentrations using a calibration curve. Derive the CAR metrics (e.g., Absolute Increase, AUCᵢ) for each participant.
The Scientist's Toolkit: Essential Research Reagent Solutions
The following table details key materials and reagents required for implementing the LC-MS/MS-based CAR protocol described above.
Table 3: Essential Research Reagents and Materials for LC-MS/MS-based CAR Analysis
| Item Category | Specific Examples | Function / Application |
|---|---|---|
| Saliva Collection Devices | Salivette tubes, plain cotton or polyester swabs | Non-invasive collection of saliva samples from participants in an ambulatory setting. |
| Internal Standards (IS) | Deuterated cortisol-d4 | Added to each sample to correct for variability in sample preparation and instrument response; critical for assay accuracy [10]. |
| Solid Phase Extraction (SPE) | Oasis HLB μElution Plate (Waters) | Purifies and concentrates cortisol from the saliva matrix, removing interfering substances and enhancing sensitivity [22]. |
| LC-MS/MS Consumables | UPLC C18 column (e.g., Kinetex, Phenomenex); mobile phases (e.g., ammonium acetate, acetonitrile with formic acid) | Chromatographically separates cortisol from other steroids prior to highly specific mass detection [22] [10]. |
| Calibrators & QC Materials | Pure cortisol reference standard; pooled saliva for QC samples | Used to create a calibration curve for quantification and to monitor assay performance and reproducibility across batches [10]. |
The reliable capture of the Cortisol Awakening Response is a powerful, non-invasive tool for probing HPA axis dynamics in health and disease. This protocol deep-dive underscores that rigorous methodology—from strict participant instruction and objective compliance monitoring to the application of specific and accurate LC-MS/MS technology—is not optional but fundamental to generating valid and reproducible data. Adherence to updated expert consensus guidelines, coupled with the analytical precision of LC-MS/MS, ensures that the CAR can be effectively leveraged to advance our understanding of stress physiology, circadian rhythms, and their interplay in human health.
The accurate assessment of circadian rhythms is a cornerstone of understanding human physiology and developing effective chronotherapeutics. For decades, immunoassays were the default method for quantifying circadian biomarkers like melatonin and cortisol. However, a significant paradigm shift is underway towards Liquid Chromatography-Tandem Mass Spectrometry (LC-MS/MS), particularly for the simultaneous quantification of multiple analytes in a single analytical run [2] [19]. This transition is driven by the growing clinical and research need to understand the complex interplay between different hormonal pathways rather than viewing them in isolation. While immunoassays are susceptible to cross-reactivity, limiting their specificity, LC-MS/MS offers high specificity and sensitivity, allowing researchers to create comprehensive hormonal profiles from a single, small-volume sample [18] [19]. This application note details the methodologies and protocols for implementing these advanced multiplexed assays, framed within comparative research on LC-MS/MS versus immunoassay for circadian hormone analysis.
Analytical Techniques Comparison: LC-MS/MS vs. Immunoassay
The choice between LC-MS/MS and immunoassay involves a careful trade-off between analytical performance and practical considerations. The table below summarizes the key characteristics of each technique.
Table 1: Comparison of Immunoassay and LC-MS/MS for Hormone Quantification
| Characteristic | Immunoassay | LC-MS/MS |
|---|---|---|
| Specificity | Prone to cross-reactivity with structurally similar compounds [19] | High specificity; distinguishes between closely related steroid isomers [48] [49] |
| Multiplexing Capability | Low; typically single analyte per test kit [49] | High; simultaneous quantification of dozens of hormones in one run [50] [48] |
| Sensitivity | Variable; can be insufficient for low-concentration salivary melatonin [19] | Excellent; capable of detecting sub-nanogram per milliliter levels [48] [49] |
| Sample Volume | Generally low | Low to moderate; enables profiling from a single small sample [48] |
| Workflow | Simpler, often automated | Complex, requires specialized expertise [18] |
| Cost per Sample | Lower for single analyte | Higher, but cost-effective for multi-analyte profiles [49] |
Recent advancements have led to new, direct (extraction-free) immunoassays that show strong correlation with LC-MS/MS for urinary free cortisol, simplifying their workflow [18]. However, even these new assays demonstrated a proportional positive bias, meaning they consistently overestimated cortisol concentrations compared to the reference LC-MS/MS method [18]. This underscores that while convenient, immunoassays may still lack the absolute accuracy required for precise circadian phase assessment.
Circadian Biomarkers and Research Context
In circadian research, the gold standard for assessing the phase of the central master clock is the Dim Light Melatonin Onset (DLMO), while the Cortisol Awakening Response (CAR) provides insight into the hypothalamic-pituitary-adrenal (HPA) axis activity [2] [19]. These two hormones exhibit opposing circadian rhythms, and their simultaneous measurement provides a powerful tool for diagnosing circadian rhythm disorders and understanding their link to various pathologies, from neurodegenerative diseases to metabolic syndrome [2] [19].
The following diagram illustrates their complementary diurnal patterns and the central role of the suprachiasmatic nucleus (SCN).
Figure 1: Central Regulation of Key Circadian Hormones. The SCN integrates light input to synchronize the secretion of melatonin and cortisol.
Detailed Experimental Protocols for Multi-Hormone Profiling
Protocol 1: Simultaneous Quantification of 17 Steroid Hormones in Human Serum
This protocol, adapted from a validated method, is designed for comprehensive steroid profiling, covering glucocorticoids, mineralocorticoids, androgens, and progestogens from a single serum sample [48].
1. Sample Preparation: Liquid-Liquid Extraction (LLE)
- Starting Material: Use 180 µL of human serum.
- Internal Standard: Add a stable isotope-labeled internal standard (SIL-IS) solution to every sample to correct for variability in sample preparation and ionization [51].
- Extraction: Perform LLE with 1.8 mL of methyl tert-butyl ether (MTBE).
- Steps: Vortex the mixture vigorously for 10 minutes, then centrifuge to separate phases. Transfer the organic (upper) layer to a new tube and evaporate to dryness under a gentle stream of nitrogen gas.
- Reconstitution: Reconstitute the dry extract in a suitable initial mobile phase (e.g., 50-100 µL of water/methanol mixture) for LC-MS/MS analysis [48].
2. Liquid Chromatography (LC) Separation
- Column: Use a reversed-phase C18 column (e.g., 2.1 x 100 mm, 1.7 µm).
- Mobile Phase: A binary gradient consisting of water (A) and methanol or acetonitrile (B), both with modifiers like 0.1% formic acid or ammonium acetate.
- Gradient: Employ a linear gradient from 5% B to 95% B over 5-15 minutes.
- Flow Rate: 0.4 mL/min.
- Column Temperature: Maintain at 40-50°C.
- Injection Volume: 5-10 µL [48] [49].
- Key Note: Optimal chromatographic separation is critical to resolve isomeric steroids like cortisol and cortisone, which have identical molecular weights [49].
3. Mass Spectrometry (MS) Detection
- Ionization: Use electrospray ionization (ESI) in positive mode.
- Detection: Operate the triple quadrupole (QQQ) mass spectrometer in multiple reaction monitoring (MRM) mode.
- Procedure: For each analyte and its corresponding IS, two to three specific precursor-to-product ion transitions are monitored. This ensures both quantification and confirmatory identification [48] [51].
- Runtime: The total analytical runtime is approximately 15 minutes per sample [48].
General Workflow for LC-MS/MS Bioanalysis
The entire process, from sample to result, can be visualized in the following workflow:
Figure 2: Generic Workflow for LC-MS/MS Bioanalysis.
Method Validation and Quality Assurance
For an analytical method to be deemed reliable for research or diagnostics, it must undergo rigorous validation. Key performance characteristics to evaluate include:
- Accuracy and Precision: Both should be within ±15% of the nominal concentration for quality control (QC) samples, except at the lower limit of quantification (LLOQ), where ±20% is acceptable [51].
- Lower Limit of Quantification (LLOQ): The lowest analyte concentration that can be measured with acceptable accuracy and precision. For the 17-plex steroid panel, LLOQs ranged from 0.05 to 0.5 ng/mL [48].
- Linearity: The calibration curve should be linear across the analytical measurement range (AMR), with a coefficient of determination (R²) typically ≥0.99 [49].
- Specificity and Selectivity: The method must be able to unequivocally assess the analyte in the presence of other components, such as matrix interferents [51].
Series Validation Checklist: For ongoing quality assurance in diagnostic testing, a dynamic "series validation" is recommended. This involves checking each analytical run against pre-defined pass criteria for the calibration curve (slope, intercept, R², back-calculated accuracy of calibrators), signal intensity at the LLOQ, and consistent internal standard response [52].
The Scientist's Toolkit: Essential Research Reagents and Materials
Successful implementation of multiplexed hormone profiling relies on key materials and reagents.
Table 2: Essential Research Reagent Solutions for LC-MS/MS Hormone Profiling
| Reagent/Material | Function | Example & Notes |
|---|---|---|
| Authenticated Analytical Standards | Calibration and QC sample preparation; definitive identification | Certified reference materials (CRMs) from reputable suppliers (e.g., Cerilliant, Sigma-Aldrich) [50] [51] |
| Stable Isotope-Labeled Internal Standards (SIL-IS) | Normalizes for extraction efficiency and ion suppression/enhancement | Isotopes: ²H, ¹³C, ¹⁵N; should be added to every sample at the start of preparation [48] [51] |
| LC-MS Grade Solvents | Mobile phase and sample preparation; minimizes background noise | Fisher Chemical, Honeywell; e.g., water, methanol, acetonitrile, formic acid [50] |
| Solid-Phase Extraction (SPE) or Liquid-Liquid Extraction (LLE) Kits | Sample clean-up and analyte pre-concentration; reduces matrix effects | SPE: Various chemistries (C18, mixed-mode). LLE: MTBE, chloroform [48] [49] |
| Chromatography Column | Separates analytes prior to MS detection to reduce interference | Reversed-phase C18 UPLC column (e.g., Waters ACQUITY UPLC BEH C18, 1.7 µm) [48] [49] |
Quantitative Data from Validated Assays
The following table compiles key quantitative performance data from recently published LC-MS/MS methods to illustrate achievable results.
Table 3: Performance Metrics of Recent Multiplexed LC-MS/MS Hormone Assays
| Analytical Target | Sample Matrix | Number of Analytes | Linear Range (LLOQ) | Key Performance | Source |
|---|---|---|---|---|---|
| 17 Endogenous Steroids | Human Serum | 17 | LLOQs: 0.05 - 0.5 ng/mL | Accuracy & Precision: Within ±15% | [48] |
| 11 Steroid Hormones | Rat Tissues & Human Urine | 11 | Runtime: 6 min | Recovery: 74.2% - 126.9% (cell culture) | [50] |
| 6 Steroid Hormones | Zebrafish Homogenate | 6 | LLOQ: 0.5 - 1.7 ng/L | Intra-day Precision: 1.9% - 6.6% (CV) | [49] |
| Cortisol (UFC) | Human Urine | 1 | N/A | Correlation with LC-MS/MS: r = 0.950 - 0.998 (Immunoassays) | [18] |
The simultaneous quantification of multiple hormones and metabolites via LC-MS/MS represents a significant advancement over traditional immunoassays for circadian research. The ability to generate comprehensive, specific, and accurate hormonal profiles from a minimal sample volume provides researchers and drug developers with a powerful tool to unravel the complexity of the endocrine system and its circadian regulation. While the initial investment in instrumentation and expertise is substantial, the payoff in data quality and richness is unparalleled. As the field moves towards more personalized medicine, these multiplexed LC-MS/MS assays are poised to become the gold standard for diagnostic and prognostic evaluation in circadian medicine and beyond.
Navigating Analytical Pitfalls and Pre-Analytical Confounders
Immunoassays are fundamental tools in clinical and research laboratories for quantifying hormones, drugs, and other analytes. Their utility, however, is compromised by a lack of perfect specificity, which can lead to analytical interference. Immunoassay interference is defined as the effect of a substance present in the sample that alters the correct value of the result, usually expressed as concentration or activity for an analyte [53] [54]. This interference can be analyte-dependent or analyte-independent, with cross-reactivity representing a major category of analyte-dependent interference.
Cross-reactivity occurs when an antibody binds to molecules other than the intended target antigen, typically those with structural similarity to the target molecule [54] [55]. This is a widespread issue; one study of 11,000 affinity-purified monoclonal antibodies found that 95% bound to non-target proteins, indicating a high potential for cross-reactivity [56]. The consequences are clinically significant, leading to falsely elevated or falsely low reported concentrations, which can trigger misinterpretation of a patient's condition, unnecessary further investigations, or incorrect treatment courses [53]. For circadian hormone analysis, such inaccuracies can profoundly impact the assessment of rhythmicity and phase, undermining research and diagnostic conclusions.
Understanding the molecular and procedural origins of interference is critical for developing effective mitigation strategies. The sources are diverse and can be categorized as follows.
Endogenous Interferents
Endogenous substances unique to an individual's sample can interfere with the antigen-antibody reaction.
- Heterophile Antibodies and Human Anti-Animal Antibodies (HAAA): These are human antibodies that can react with animal immunoglobulins used in immunoassay reagents. For example, Human Anti-Mouse Antibodies (HAMA) can bridge capture and detection antibodies in a two-site immunometric assay (IMA), leading to falsely elevated results [53] [54].
- Autoantibodies: Antibodies such as rheumatoid factor (RF), which targets the Fc portion of immunoglobulin G (IgG), can bind to assay immunoglobulins and cause unreliable signal generation [54].
- Cross-Reacting Endogenous Compounds: Structurally similar endogenous molecules can compete for antibody binding sites.
- In cortisol immunoassays, endogenous steroids like 21-deoxycortisol and 11-deoxycortisol can show significant cross-reactivity, which becomes clinically relevant in conditions like 21-hydroxylase deficiency or following a metyrapone challenge [55].
- Digoxin-like immunoreactive factors found in patients with renal failure, liver disease, and hypertension can cause false positives in digoxin assays [53].
- Hormone-Binding Proteins: Proteins such as cortisol-binding globulin (CBG) or sex hormone-binding globulin (SHBG) can alter the measurable concentration of free analyte by blocking or removing it from the assay reaction [53].
Exogenous Interferents
These are substances introduced from outside the body, often through medication or supplementation.
- Drugs and Metabolites: Administration of structurally similar medications is a common source of interference.
- Prednisolone and 6-Methylprednisolone show high cross-reactivity with some cortisol immunoassays and can produce substantial false-positive results in patients undergoing therapy with these drugs [55].
- Spironolactone and its metabolite canrenone can cause falsely low results in certain digoxin immunoassays [53].
- Fludrocortisone derivatives can cause false-positive values in cortisol immunoassays [53] [55].
- Biotin Supplementation: High doses of biotin can severely interfere with immunoassays that use a streptavidin-biotin capture system, leading to falsely low or high results depending on the assay format [54].
- Exogenous Antibodies: Therapeutic antibodies, such as Fab fragments derived from anti-digoxin antibodies (Digibind), can compete with the assay antibody for the analyte, disturbing the immunoassay [53].
- Matrix Effects: Sample components like lipids, bilirubin, hemoglobin, and gamma globulin can nonspecifically affect assay performance by altering viscosity, quenching signals, or interacting with assay reagents [53] [54] [56].
- The "Hook Effect": In sandwich immunometric assays, extremely high analyte concentrations can saturate both capture and detection antibodies, preventing the formation of the "sandwich" complex and resulting in a falsely low result [53] [54].
- Pre-analytical Variables: The choice of sample tube (e.g., EDTA, heparin), sample storage conditions, and inadequate processing (e.g., fibrin in plasma, sample carryover) can also introduce variability and interference [53].
The following diagram illustrates how these different interferents disrupt the standard antigen-antibody binding in an immunoassay.
Cross-reactivity is not merely an analytical curiosity; it has direct clinical implications. The following tables summarize documented cross-reactivities for key analyte classes, highlighting interferents with the greatest potential to impact patient and research results.
Table 1: Cross-Reactivity in Steroid Hormone Immunoassays
Data compiled from manufacturer inserts and experimental studies, showing compounds with the highest potential for clinically significant interference [55].
| Target Assay | Cross-Reactive Compound | Reported Cross-Reactivity | Potential Clinical Impact |
|---|---|---|---|
| Cortisol | Prednisolone | >5% | Falsely elevated cortisol in patients on prednisolone therapy |
| 6-Methylprednisolone | >5% | Falsely elevated cortisol in patients on this steroid | |
| 21-Deoxycortisol | >5% | Falsely elevated cortisol in 21-hydroxylase deficiency | |
| 11-Deoxycortisol | 0.5-4.9% | Falsely elevated cortisol post-metyrapone or in 11β-hydroxylase deficiency | |
| Fludrocortisone | >5% | Falsely elevated cortisol in patients taking fludrocortisone | |
| Testosterone | Methyltestosterone | >5% | Falsely elevated testosterone in users of this anabolic steroid |
| DHEA | 0.5-4.9% | Potential false positive in women and children | |
| Nandrolone | 0.5-4.9% | Falsely elevated testosterone in users of this anabolic steroid |
Table 2: Cross-Reactivity in Urine Drug Screening (UDS) and Other Immunoassays
This table includes examples discovered through systematic data mining of electronic health records and subsequent experimental validation [57].
| Target Assay | Cross-Reactive Compound | Potential Result | Notes |
|---|---|---|---|
| Amphetamines | Selected medications* | False Positive | *Specific compounds validated via EHR data mining and spiking studies [57] |
| Buprenorphine | Selected medications* | False Positive | *Specific compounds validated via EHR data mining and spiking studies [57] |
| Cannabinoids | Selected medications* | False Positive | *Specific compounds validated via EHR data mining and spiking studies [57] |
| Methadone | Selected medications* | False Positive | *Specific compounds validated via EHR data mining and spiking studies [57] |
| hCG (early assays) | Luteinizing Hormone (LH) | False Positive (Pregnancy) | Largely resolved with more specific antibodies [53] [54] |
| Digoxin | Spironolactone / Canrenone | False Negative | Can mask digoxin intoxication [53] |
Experimental Protocols for Detecting Interference
To ensure the reliability of immunoassay data, it is essential to implement systematic procedures for detecting and quantifying interference. The following protocols are standard in assay validation and troubleshooting.
Protocol: Spike and Recovery Experiment
This experiment assesses whether components in a sample matrix interfere with accurate analyte detection and measurement [54].
Principle: A known amount of pure analyte is added (spiked) into the sample matrix. The measured concentration is then compared to the expected concentration to calculate the percentage recovery.
Materials:
- Test sample matrix (e.g., patient plasma, serum)
- High-purity analyte standard
- Assay buffer
- Standard immunoassay reagents and equipment
Procedure:
- Prepare three sets of samples in duplicate or triplicate:
- Neat Matrix: The sample matrix with no spike. This determines the endogenous level of the analyte.
- Spiked Buffer (Control): A known concentration of analyte standard spiked into assay buffer.
- Spiked Matrix (Test): The same known concentration of analyte standard spiked into the sample matrix.
- Note: For a thorough assessment, use low, medium, and high analyte concentrations.
- Run all samples according to the standard immunoassay protocol.
- Calculation:
- Calculate the recovered concentration:
[Recovered] = [Spiked Matrix] - [Neat Matrix] - Calculate the percentage recovery:
% Recovery = ( [Recovered] / [Spiked Buffer] ) × 100
- Calculate the recovered concentration:
Interpretation of Results:
- 80–120% Recovery: Generally acceptable, indicating minimal interference.
- <80% Recovery: Suggests signal suppression, possibly due to matrix interference or binding proteins.
- >120% Recovery: Suggests signal enhancement, potentially caused by cross-reactivity with a similar substance in the matrix [54].
Protocol: Dilutional Linearity (Parallelism)
This test evaluates whether an assay maintains a proportional response when a sample is diluted, which is a key indicator of the absence of matrix effects or interference.
Principle: A sample with a high analyte concentration is serially diluted with a suitable diluent (e.g., zero-calibrator or analyte-free matrix). The measured concentrations, when corrected for dilution, should align closely.
Materials:
- Patient sample with elevated analyte level
- Appropriate diluent (e.g., analyte-free serum or assay buffer)
- Standard immunoassay reagents and equipment
Procedure:
- Prepare a series of dilutions (e.g., 1:2, 1:4, 1:8) of the patient sample using the chosen diluent.
- Assay the neat and diluted samples in the same run.
- For each dilution, calculate the "Expected Concentration" by multiplying the measured concentration by the dilution factor.
- Plot the measured values against the dilution factors and assess linearity.
Interpretation of Results:
- A linear plot that passes through the origin indicates a lack of significant interference.
- Non-linearity (e.g., curves upward or downward) suggests the presence of interfering substances that are affected by dilution, such as heterophile antibodies or cross-reactants.
Protocol: Investigating Suspected Cross-Reactivity
When a specific interferent is suspected (e.g., a metabolite or a concomitant medication), a direct spiking study can be performed.
Principle: The suspected interferent is spiked into a drug-free matrix or a sample with a known analyte concentration to observe its direct effect on the assay.
Materials:
- Drug-free matrix (e.g., pooled human serum)
- Pure standard of the suspected interfering compound
- Standard immunoassay reagents and equipment
Procedure:
- Prepare samples by spiking the interfering compound at various physiologically relevant concentrations into the drug-free matrix.
- Run the spiked samples and the unspiked (negative) matrix on the immunoassay.
- A positive result in the spiked, otherwise negative, sample confirms the compound is cross-reactive.
- To quantify the degree of cross-reactivity, use the formula:
% Cross-reactivity = (Measured Apparent Analyte Concentration / Concentration of Cross-Reactant Added) × 100[55].
The workflow for a systematic interference investigation is summarized below.
The LC-MS/MS Advantage in Circadian Hormone Analysis
The limitations of immunoassays become particularly critical in the context of circadian rhythm research, which demands high analytical specificity and sensitivity to accurately delineate hormone profiles like those of melatonin and cortisol.
Direct Comparison of Methodological Performance
Liquid chromatography-tandem mass spectrometry (LC-MS/MS) has emerged as a superior alternative, offering a direct physical-chemical method for analyte identification and quantification that is largely free from the immunological interferences that plague immunoassays.
Table 3: Method Comparison: Immunoassay vs. LC-MS/MS for Circadian Biomarkers Data summarizing key performance characteristics for the measurement of low-level circadian hormones [2] [19] [10].
| Parameter | Immunoassay | LC-MS/MS |
|---|---|---|
| Principle | Antibody-Antigen Binding | Separation by Chromatography & Mass Detection |
| Specificity | Susceptible to cross-reactivity from structurally similar compounds (e.g., steroids) [55] [10]. | High specificity; distinguishes analytes based on mass/charge ratio and retention time [10] [58]. |
| Sensitivity | Often insufficient for low salivary melatonin levels required for precise DLMO calculation [19] [10]. | Excellent sensitivity (LLOQ for salivary melatonin: 2.15 pmol/L) [10]. |
| Susceptibility to Interference | High (Heterophile antibodies, biotin, rheumatoid factor, matrix effects) [53] [54]. | Low; minimal effects from common immunoassay interferents [10] [58]. |
| Quantitative Accuracy | Can show significant bias (e.g., mean bias of +23.2% for melatonin, +48.9% for cortisol vs. LC-MS/MS) [10]. | High accuracy and precision; considered a reference method [10] [58]. |
| Multiplexing Capability | Limited; typically single-analyte tests. | Can be developed for simultaneous quantification of multiple hormones (e.g., melatonin and cortisol) [10]. |
| Throughput & Cost | High throughput, lower per-test cost. | Lower throughput, higher initial investment and per-test cost [58]. |
Impact on Circadian Phase Assessment
The methodological biases of immunoassay are not trivial. A 2021 study demonstrated that, while immunoassays for salivary melatonin and cortisol correlated strongly with LC-MS/MS (r > 0.91), they exhibited significant mean biases of 23.2% for melatonin and 48.9% for cortisol [10]. For markers like Dim Light Melatonin Onset (DLMO) and the Cortisol Awakening Response (CAR), which rely on threshold concentrations and the precise shape of the secretion curve, such inaccuracies can lead to misestimation of circadian phase and amplitude [2] [19]. This is paramount in both research and clinical practice, where the accurate diagnosis of circadian rhythm sleep-wake disorders and the evaluation of therapeutic interventions depend on reliable data.
The Scientist's Toolkit: Key Reagents and Materials
The following table details essential reagents used in experiments for detecting and mitigating immunoassay interference.
Table 4: Research Reagent Solutions for Interference Studies
| Reagent / Material | Function in Experiment | Example Application |
|---|---|---|
| Analyte-Free Matrix | Serves as a baseline control and diluent for spike and recovery/dilution studies. | Pooled human serum or plasma; used to prepare calibrators and assess background signal. |
| High-Purity Analyte Standards | Used to spike samples for recovery experiments and to create calibration curves. | Certified reference materials for cortisol, melatonin, etc. |
| HAAA Blocking Reagent | Contains inert animal serums or specific antibodies to neutralize human anti-animal antibody interference. | Added to patient samples to prevent false positives/negatives caused by HAMA [54]. |
| Heterophilic Antibody Blockers | A mixture of specific immunoglobulins or non-immune sera to saturate heterophile antibody binding sites. | Included in assay buffer to reduce interference from heterophile antibodies [54] [56]. |
| Rheumatoid Factor (RF) Control | A known positive control for RF, used to validate the effectiveness of blocking reagents. | Used during assay development to test and optimize protocols for mitigating RF interference [54]. |
| Normal Sera (Various Species) | Used as a source of non-specific immunoglobulins in blocking reagents to reduce nonspecific binding. | Normal mouse, goat, or bovine serum [54]. |
| BSA or Casein | Common blocking agents used to coat surfaces and saturate nonspecific binding sites in assays and reagents. | Added to assay buffers or used to prepare sample diluents to minimize matrix effects [54]. |
The accurate quantification of salivary melatonin is paramount for advancing research in circadian biology, sleep disorders, and drug development. As a key hormonal regulator of the sleep-wake cycle, melatonin concentrations in saliva are typically low, especially during daytime and dim light melatonin onset (DLMO) assessment, presenting a significant analytical challenge [10] [59]. This application note examines the critical challenge of sensitivity limits in salivary melatonin analysis, framing it within a broader thesis comparing liquid chromatography-tandem mass spectrometry (LC-MS/MS) and immunoassay techniques for circadian hormone profiling. The non-invasive nature of saliva collection makes it ideal for frequent sampling in circadian studies, but this advantage is nullified if the analytical method lacks the requisite sensitivity and specificity to detect physiologically relevant concentrations [10] [60]. We provide a comprehensive comparison of methodological performance and detailed experimental protocols to guide researchers in selecting appropriate analytical platforms for their specific research questions.
Performance Comparison of Analytical Techniques
Key Analytical Figures of Merit
The quantitative performance of different analytical methods for salivary melatonin detection varies significantly, particularly in sensitivity and precision. The following table summarizes key analytical figures of merit for the primary techniques used in salivary melatonin quantification.
Table 1: Analytical Performance Comparison for Salivary Melatonin Measurement
| Method | Sensitivity/LOD | LLOQ | Assay Range | Precision (CV%) | Sample Volume | Run Time |
|---|---|---|---|---|---|---|
| LC-MS/MS (Ultrasensitive) | - | 0.8 pg/mL [61] | Not specified | Not specified | Not specified | Not specified |
| LC-MS/MS (Standard) | 0.43 pmol/L (≈ 0.19 pg/mL) [10] | 2.15 pmol/L (≈ 0.93 pg/mL) [10] | 2.15-430 pmol/L (0.93-186 pg/mL) [10] | 3.3-6.8% [10] | 300 μL [10] | 6 minutes [10] |
| LC-MS/MS (Multiplex) | 0.003 nmol/L (≈ 0.001 pg/mL) [60] | 0.010 nmol/L (≈ 0.004 pg/mL) [60] | Not specified | ≤14% [60] | 250 μL [60] | Not specified |
| Salimetrics ELISA | 1.35 pg/mL [62] [59] | Not specified | 0.78-50 pg/mL [62] [59] | Not specified | 100 μL [62] | ~4 hours [62] [59] |
| 2ch-saLFI (Point-of-Care) | 0.476 pg/mL [63] [64] | Not specified | Not specified | Strong correlation with ELISA (R²=0.9101) [64] | Not specified | <30 minutes [63] [64] |
Note: Conversion between molar and mass units based on melatonin molecular weight of 232.28 g/mol.
Method Comparison and Bias Assessment
Comparative studies consistently demonstrate significant differences between LC-MS/MS and immunoassay platforms. One comprehensive validation study revealed that although LC-MS/MS and immunoassays show strong correlation (Pearson's r=0.910 for melatonin), they exhibit a significant mean bias of 23.2% (range: 54.0-143.7%) for melatonin quantification [10]. This bias is particularly pronounced at lower concentrations, where immunoassays tend to overestimate values due to cross-reactivity with structurally similar compounds [26] [61]. For context, salivary melatonin concentrations in healthy individuals typically range from 10-1200 pg/mL across the diurnal cycle, with DLMO assessment requiring precise detection at the lower end of this spectrum [64] [59].
Table 2: Comparative Method Performance for Hormone Analysis in Saliva
| Analyte | Methods Compared | Correlation | Observed Bias | Key Findings |
|---|---|---|---|---|
| Melatonin | LC-MS/MS vs. ELISA | r = 0.910 [10] | 23.2% mean bias [10] | LC-MS/MS provides more sensitive and reliable quantification [10] |
| Cortisol | LC-MS/MS vs. Immunoassay | r = 0.955 [10] | 48.9% mean bias [10] | Immunoassays demonstrate insufficient sensitivity near LLOQ [10] |
| Sex Hormones | LC-MS/MS vs. ELISA (Salimetrics) | Not specified | Not specified | Poor ELISA performance for estradiol and progesterone; LC-MS/MS superior [11] [65] |
Detailed Experimental Protocols
LC-MS/MS Method for Simultaneous Melatonin and Cortisol Quantification
Sample Preparation and Extraction Protocol
Sample Collection: Collect saliva samples by having participants chew on Parafilm and drool into a conical polypropylene tube. Ensure collection volume exceeds 2 mL. Centrifuge samples if particulate matter is present [10].
Storage: Immediately freeze samples at -20°C until analysis. Avoid multiple freeze-thaw cycles [10].
Calibrators and Quality Controls: Prepare calibrators at five concentrations (2.2, 21.5, 107.5, 215, and 430 pmol/L for melatonin). Prepare quality control (QC) samples at three concentrations (8.6, 86, and 344 pmol/L for melatonin) using a different batch of reagents [10].
Liquid-Liquid Extraction:
- Pipette 300 μL of saliva into Eppendorf tubes
- Add 20 μL of internal standard solution (melatonin-d4, 2,150 pmol/L)
- Add 1,000 μL of methyl tert-butyl ether (MTBE)
- Seal tubes and vortex for 30 minutes
- Centrifuge at 20,600×g for 10 minutes
- Transfer 930 μL of supernatant to a 2.0 mL polypropylene 96-deep well plate
- Evaporate to dryness using a microplate evaporator
- Reconstitute in 100 μL of 20% (v/v) methanol and mix for 30 minutes [10]
Instrumental Analysis Conditions
Chromatography System: Agilent 1260 high-performance liquid chromatography (HPLC) system [10]
Column: C18 2.1×50 mm, 2.6 μm Kinetex column (Phenomenex) [10]
Mobile Phase:
- A: 2-mmol/L ammonium acetate in deionized water
- B: 0.1% (v/v) formic acid in acetonitrile
- Use gradient elution (see supplemental data in original publication) [10]
Injection Volume: 20 μL [10]
Flow Rate: 250 μL/min [10]
Total Run Time: 6 minutes [10]
Mass Spectrometry: Agilent 6490 tandem mass spectrometer with jet stream electrospray ionization source operating in positive ion mode [10]
Detection: Multiple reaction monitoring (MRM) with specific transitions (see supplemental data in original publication) [10]
Figure 1: LC-MS/MS sample preparation and analysis workflow for salivary melatonin.
ELISA Protocol for Salivary Melatonin
Assay Procedure
Sample Preparation: Thaw frozen saliva samples and centrifuge at 1500×g for 15 minutes to remove mucins and debris. Use clear supernatant for analysis [62] [59].
Assay Protocol:
- Pipette 100 μL of standards, controls, and samples into appropriate wells
- Add melatonin enzyme conjugate to each well
- Incubate at room temperature for 3 hours
- Wash wells to remove unbound components
- Add substrate solution (tetramethylbenzidine, TMB)
- Incubate for 30 minutes
- Stop reaction with acidic solution
- Read optical density at 450 nm within 30 minutes [62]
Calculation: Plot standard curve and calculate melatonin concentrations in samples based on the inverse relationship between melatonin concentration and color development [62].
The Scientist's Toolkit: Essential Research Reagents and Materials
Table 3: Essential Research Reagents and Materials for Salivary Melatonin Analysis
| Item | Function/Application | Example Specifications |
|---|---|---|
| Melatonin Standard | Calibration curve preparation | High-purity synthetic melatonin (Sigma-Aldrich) [10] |
| Stable Isotope-Labeled Internal Standard | Quantification by isotope dilution method | Melatonin-d4 (CDN Isotopes) [10] [60] |
| Methyl Tert-Butyl Ether (MTBE) | Liquid-liquid extraction | HPLC grade (Burdick & Jackson) [10] |
| C18 Chromatography Column | Reverse-phase separation | 2.1×50 mm, 2.6 μm Kinetex (Phenomenex) [10] |
| Anti-Melatonin Antibody | Immunoassay detection | High specificity antibody (Salimetrics, Abcam) [62] [64] |
| Melatonin Enzyme Conjugate | ELISA detection | Melatonin conjugated to horseradish peroxidase [62] |
| Saliva Collection Device | Standardized sample collection | Salivette device or passive drooling into polypropylene tubes [10] [64] |
| Mobile Phase Additives | LC-MS/MS analysis | 2-mmol/L ammonium acetate, 0.1% formic acid in acetonitrile [10] |
Analytical Challenges and Technical Considerations
Sensitivity Requirements for Circadian Rhythm Assessment
The determination of dim light melatonin onset (DLMO) requires exceptionally sensitive detection methods, as it involves identifying the time when melatonin concentrations begin to rise from near-undetectable daytime levels. DLMO assessment typically requires measurement of concentrations below 8 pmol/L (approximately 3.5 pg/mL) [10], which challenges even the most sensitive immunoassays. The recently developed ultrasensitive LC-MS/MS method with an LLOQ of 0.8 pg/mL represents a significant advancement for reliably detecting these low concentrations [61]. This sensitivity is particularly crucial for populations with attenuated melatonin rhythms, such as elderly individuals or those with certain sleep disorders, where the amplitude of melatonin secretion may be reduced.
Specificity and Cross-Reactivity Issues
Immunoassays suffer from inherent limitations in specificity due to potential cross-reactivity with structurally similar compounds. Melatonin, being an indoleamine, shares structural similarities with other indols and tryptophan metabolites present in biological samples [61]. This cross-reactivity becomes particularly problematic at low concentrations, where even minimal interference can lead to substantial proportional errors. LC-MS/MS methods overcome this limitation through physical separation by chromatography and highly specific multiple reaction monitoring (MRM) transitions, providing unambiguous identification and quantification of the target analyte [10] [60].
Figure 2: Comparison of immunoassay and LC-MS/MS methodologies for salivary melatonin analysis.
The accurate quantification of salivary melatonin presents significant analytical challenges due to its low abundance in this matrix, particularly for DLMO assessment and daytime measurements. While immunoassays offer practical advantages in terms of cost and operational simplicity, they demonstrate significant biases, especially at lower concentration ranges. LC-MS/MS emerges as the superior analytical platform, providing the necessary sensitivity, specificity, and multiplexing capability required for advanced circadian rhythm research. The development of increasingly sensitive LC-MS/MS methods, with LLOQs now reaching sub-pg/mL levels, continues to push the boundaries of what is measurable in salivary melatonin research. These technological advances will undoubtedly enhance our understanding of circadian biology and improve the diagnosis and treatment of sleep and circadian rhythm disorders.
The accurate measurement of circadian hormones like melatonin and cortisol is crucial for diagnosing sleep disorders, mood disorders, and assessing circadian rhythm disruptions in conditions such as neurodegenerative diseases and cancer-related fatigue [7] [60]. While the analytical superiority of liquid chromatography-tandem mass spectrometry (LC-MS/MS) over immunoassays is well-established, the reliability of results is profoundly influenced by pre-analytical conditions [66] [7]. This document details the critical pre-analytical factors—light exposure, posture, and sampling time—that researchers must control to ensure data integrity when conducting circadian hormone analysis using LC-MS/MS.
The Analytical Context: LC-MS/MS vs. Immunoassay
The transition from immunoassays to LC-MS/MS for hormone analysis represents a significant advancement in clinical and research laboratories. While immunoassays are widely used due to low cost and technical ease, they suffer from limitations including cross-reactivity and insufficient sensitivity for detecting low hormone concentrations, which is particularly problematic for salivary melatonin and late-night cortisol [66] [7]. In contrast, LC-MS/MS offers superior specificity, sensitivity, and reproducibility [7]. It also enables the simultaneous quantification of multiple analytes (e.g., melatonin, cortisol, and cortisone) from a single sample, thereby reducing required sample volume and providing a more comprehensive biochemical profile [66] [60] [67]. Studies show that while LC-MS/MS and immunoassays can be strongly correlated (r > 0.91), immunoassays can demonstrate significant mean biases, overestimating melatonin by 23.2% and cortisol by 48.9% on average [66]. This highlights the necessity for specific, accurate LC-MS/MS methods and stringent pre-analytical controls to exploit its full potential.
Critical Pre-Analytical Factors
Light Exposure
Light is the primary environmental synchronizer (zeitgeber) of the human circadian system. Ambient light exposure prior to and during sample collection, especially for melatonin, is a paramount concern.
- Impact on Melatonin: Production by the pineal gland is potently inhibited by light interacting with the retina. Even brief exposure to room light during evening sampling can artificially suppress melatonin levels, drastically altering the assessment of its onset (DLMO) [7] [60].
- Protocol Requirement: Melatonin samples, particularly those collected to determine the Dim Light Melatonin Onset (DLMO), must be obtained under strictly controlled dim light conditions [7]. Participants should be instructed to avoid bright screens and lights for at least one hour before and during sampling.
Posture and Physical Activity
Physical stressors, including changes in posture and exercise, can significantly influence hormone levels, particularly cortisol.
- Impact on Cortisol: Postural changes (e.g., moving from supine to standing) and physical activity can stimulate a rapid increase in cortisol secretion via activation of the hypothalamic-pituitary-adrenal (HPA) axis [7]. This can confound the interpretation of the diurnal cortisol rhythm or the Cortisol Awakening Response (CAR).
- Protocol Requirement: Study participants should maintain a restful, seated position for at least 15-30 minutes prior to sample collection. Strenuous exercise should be avoided on sampling days, or at a minimum, rigorously documented for later consideration as a covariate [68].
Sampling Time and Circadian Phase
Melatonin and cortisol exhibit robust and predictable circadian rhythms. Accurate characterization of their profiles requires meticulous timing of sample collection.
- Melatonin and DLMO: The DLMO is the gold standard marker for assessing the phase of the endogenous circadian clock [7]. Sampling to establish DLMO typically requires a 4-6 hour window, from 5 hours before to 1 hour after habitual bedtime, with samples collected every 30-60 minutes [7].
- Cortisol and CAR: The Cortisol Awakening Response is a distinct surge in cortisol levels that occurs 20-45 minutes after waking. Assessing the CAR requires precise sampling at awakening (0 min), and again at 30, and 45 minutes post-awakening [7]. The diurnal cortisol profile also requires multiple samples across the day (e.g., upon awakening, at 4 PM, and at bedtime) [60] [67].
Table 1: Summary of Critical Pre-Analytical Factors and Control Measures
| Pre-Analytical Factor | Physiological Impact | Recommended Control Protocol |
|---|---|---|
| Light Exposure | Suppresses melatonin secretion; alters circadian phase assessment [7]. | Collect all evening/night samples under dim light (< 30 lux). Instruct participants to avoid screens before/during sampling. |
| Posture & Activity | Elevates cortisol levels via HPA axis activation [7] [68]. | Maintain a seated, restful posture for 15-30 min pre-sampling. Avoid strenuous exercise before sample collection. |
| Sampling Time | Critical for defining circadian phase (DLMO, CAR) and diurnal rhythm [7] [60]. | DLMO: Frequent sampling (e.g., 30-min intervals) 5h pre- to 1h post-bedtime.CAR: Precise sampling at 0, 30, 45 min post-awakening.Diurnal: Multiple fixed times (e.g., 8 AM, 12 PM, 4 PM, 8 PM, 12 AM). |
| Sample Collection & Storage | Affects analyte stability and matrix integrity [66] [60]. | Use approved saliva collection aids (e.g., plain polypropylene tubes). Freeze samples at ≤ -20°C immediately after collection. |
Experimental Protocols for Circadian Assessment
Protocol for Dim Light Melatonin Onset (DLMO) Assessment
Objective: To determine the time of melatonin onset under dim light conditions as a marker of endogenous circadian phase [7].
Materials:
- Salivette or plain polypropylene tubes.
- Cooler with ice packs or home freezer.
- Lab freezer (-20°C or -80°C).
- Dim red-light flashlight.
Procedure:
- Participant Preparation: On the sampling day, instruct the participant to avoid caffeine, alcohol, and heavy meals in the evening. They should remain in dim light (< 30 lux) from 2 hours before the first sample until collection is complete.
- Sample Collection:
- Begin sampling 5 hours before the participant's habitual bedtime.
- Collect saliva samples every 30 minutes until 1 hour after habitual bedtime.
- For each sample, the participant should not eat, drink, or brush teeth for at least 15 minutes prior.
- Immediately after collection, samples should be stored in a home freezer (-20°C) or on ice packs before transport to the lab.
- Sample Analysis: Analyze melatonin concentrations using a validated LC-MS/MS method [66] [60].
- Data Analysis: Calculate DLMO using a fixed threshold (e.g., 3-4 pg/mL in saliva) or a variable threshold (e.g., 2 standard deviations above the mean of three baseline samples) [7].
Protocol for Cortisol Awakening Response (CAR) & Diurnal Profile
Objective: To characterize the acute cortisol response to awakening and the diurnal cortisol slope [7] [67].
Materials:
- Salivette or plain polypropylene tubes.
- Participant diary or electronic timer to record exact sampling times.
Procedure:
- Participant Preparation: Instruct participants on the critical importance of precise timing. Provide a detailed schedule and data sheet.
- CAR Sampling:
- Upon waking (Time 0), collect the first saliva sample immediately.
- Collect subsequent samples at 30 and 45 minutes after waking.
- Record the exact time of each sample.
- Diurnal Profile Sampling: Collect additional samples at fixed times, e.g., 12:00 PM, 4:00 PM, and 8:00 PM.
- Postural Control: For all samples, participants should be in a seated, resting position for at least 15 minutes prior to collection.
- Sample Storage: Freeze samples immediately after collection at ≤ -20°C.
- Sample Analysis: Analyze cortisol (and preferably cortisone) concentrations using a validated LC-MS/MS method [60] [67].
The Scientist's Toolkit: Research Reagent Solutions
Table 2: Essential Materials for LC-MS/MS Analysis of Circadian Hormones
| Item | Function/Description | Example from Literature |
|---|---|---|
| LC-MS/MS System | Triple quadrupole mass spectrometer for highly specific and sensitive quantification via Multiple Reaction Monitoring (MRM) [69]. | Agilent 6490 tandem MS with 1260 HPLC system [66]. |
| Chromatography Column | Reversed-phase column for analyte separation, reducing ion suppression and interferences. | C18 2.1×50 mm, 2.6 µm Kinetex column [66]. |
| Isotope-Labeled Internal Standards | Correct for variability in sample preparation and ionization efficiency; critical for accuracy [66] [60]. | Melatonin-d4, Cortisol-d4 [66]. |
| Sample Preparation Solvents | For liquid-liquid extraction, removing proteins and matrix components. | Methyl tert-butyl ether (MTBE) [66]. |
| Calibrators & QC Materials | Pure analyte standards for calibration and quality control samples to monitor assay performance. | Certified reference materials from, e.g., Sigma-Aldrich [66] [67]. |
| Appropriate Collection Devices | Non-interfering saliva collection devices to ensure analyte integrity. | Plain polypropylene tubes or dedicated Salivettes without citric acid [66]. |
Workflow and Factor Relationships
The following diagram illustrates the logical workflow for a circadian hormone study, integrating the critical pre-analytical factors and their impact on the final analytical result.
The fidelity of circadian hormone data generated by sophisticated LC-MS/MS platforms is inextricably linked to the rigor applied during the pre-analytical phase. Factors such as light exposure, posture, and sampling time are not mere suggestions but critical determinants of data quality. By implementing and standardizing the protocols outlined in this document, researchers and drug development professionals can minimize pre-analytical variability, thereby ensuring that the superior analytical performance of LC-MS/MS translates into biologically meaningful and clinically relevant results. This rigorous approach is fundamental to advancing the field of circadian medicine.
In the burgeoning field of circadian medicine, the accurate assessment of hormonal biomarkers is paramount for both research and clinical diagnostics. Circadian rhythms, the endogenous ~24-hour oscillations governing physiological processes, are increasingly recognized as crucial determinants of human health, with their disruption implicated in pathologies ranging from neurodegenerative diseases to metabolic syndrome and cancer [7] [19]. The hormones melatonin and cortisol serve as primary biochemical markers of the circadian phase, yet their quantification presents significant analytical challenges. The central thesis framing this protocol is that while immunoassays offer practical advantages for routine hormone measurement, liquid chromatography-tandem mass spectrometry (LC-MS/MS) provides superior analytical specificity and sensitivity essential for establishing rigorous circadian protocols.
The inherent complexity of circadian studies—with factors including sampling timing, biological matrix selection, and analytical variability—demands standardized approaches to ensure data reliability and cross-study comparability. This document provides detailed application notes and protocols for assessing circadian rhythms, with particular emphasis on the methodological considerations for hormone analysis. We present standardized protocols for both LC-MS/MS and immunoassay platforms, alongside quantitative comparisons of their performance characteristics, to guide researchers and drug development professionals in implementing rigorous circadian assessment strategies.
Circadian Biomarkers: Physiological Significance and Analytical Targets
Melatonin and Dim Light Melatonin Onset (DLMO)
Melatonin, secreted by the pineal gland in response to darkness, serves as the gold-standard marker for assessing the phase of the endogenous circadian system. Its characteristic rise in the evening, known as Dim Light Melatonin Onset (DLMO), typically occurs 2-3 hours before sleep onset and represents the most reliable indicator of internal circadian timing [7] [19]. The assessment of DLMO does not typically require full 24-hour profiling; instead, a 4-6 hour sampling window from 5 hours before to 1 hour after habitual bedtime is generally sufficient [7]. Several methodological approaches exist for determining DLMO from partial melatonin profiles:
- Fixed Threshold Method: DLMO is defined as the time when interpolated melatonin concentrations reach 10 pg/mL in serum or 3-4 pg/mL in saliva. These thresholds vary between studies depending on assay sensitivity and inter-individual variation in melatonin production.
- Dynamic Threshold Method: DLMO is determined as the time when melatonin levels exceed two standard deviations above the mean of three or more baseline (pre-rise) values.
- "Hockey-Stick" Algorithm: This automated approach estimates the point of change from baseline to rise in melatonin levels and has demonstrated better agreement with expert visual assessments than threshold methods [7] [19].
Beyond its role in sleep regulation, melatonin influences nearly every organ system, with functions including free radical scavenging, immune regulation, and potential cancer prevention. The suppression of nighttime melatonin has been documented in Alzheimer's disease, autism spectrum disorder, and among night shift workers, highlighting its broad clinical relevance [7].
Cortisol and the Cortisol Awakening Response (CAR)
Cortisol, a glucocorticoid hormone produced by the adrenal cortex, exhibits a diurnal rhythm roughly opposite to melatonin, with peak levels occurring early in the morning and a nadir around midnight [7]. The Cortisol Awakening Response (CAR)—a sharp rise in cortisol levels within 30-45 minutes after waking—serves as an index of hypothalamic-pituitary-adrenal (HPA) axis activity and is influenced by circadian timing, sleep quality, and psychological stress [7].
While cortisol-based methods for circadian phase determination are less precise than melatonin (with standard deviations of approximately 40 minutes compared to 14-21 minutes for melatonin) [7], cortisol remains a valuable marker for assessing HPA axis rhythmicity. The onset of cortisol's quiescent phase has been shown to be phase-locked to melatonin onset, providing a complementary circadian marker [7]. CAR assessment typically employs salivary samples collected immediately upon waking and at set intervals over the following hour, making it suitable for ambulatory measurement in naturalistic settings.
Figure 1: Circadian Hormone Signaling and Assessment Pathways. This diagram illustrates the physiological pathways governing melatonin and cortisol secretion, their relationship to the central circadian pacemaker (SCN), and their subsequent assessment as circadian biomarkers. Red arrows highlight critical sampling protocol timing, while green arrows indicate the essential role of analytical methods in biomarker quantification. DLMO = Dim Light Melatonin Onset; CAR = Cortisol Awakening Response; HPA = Hypothalamic-Pituitary-Adrenal.
Analytical Methodologies: Comparative Performance of LC-MS/MS and Immunoassays
Technical Foundations and Performance Characteristics
The accurate quantification of melatonin and cortisol presents distinct analytical challenges due to their low physiological concentrations, particularly in saliva, and the presence of structurally similar compounds that can interfere with detection. Two primary analytical platforms dominate circadian hormone assessment: immunoassays and LC-MS/MS.
Immunoassays (including ELISA, electrochemiluminescence immunoassays, and direct immunoassays) operate on the principle of antibody-antigen recognition. While offering advantages in throughput, cost-effectiveness, and technical accessibility, they are susceptible to cross-reactivity with structurally similar compounds, potentially compromising specificity [7] [10]. This limitation is particularly problematic for low-abundance analytes like melatonin and for cortisol measurements near the lower limit of quantification.
LC-MS/MS utilizes physical separation by liquid chromatography followed by highly specific mass-based detection. This platform offers enhanced specificity, sensitivity, and the capability for multiplexing (simultaneous measurement of multiple analytes) without significant cross-reactivity concerns [7] [10]. The technique demonstrates superior performance for detecting low hormone concentrations essential for precise DLMO determination and late-night salivary cortisol measurements.
Comparative Analytical Studies
Recent direct comparisons between these methodologies reveal significant performance differences:
Table 1: Method Comparison for Salivary Melatonin and Cortisol Measurement
| Parameter | LC-MS/MS | Immunoassay | Study Details |
|---|---|---|---|
| Melatonin Correlation | Reference method | r = 0.910 with LC-MS/MS | 121 saliva samples [10] |
| Cortisol Correlation | Reference method | r = 0.955 with LC-MS/MS | 121 saliva samples [10] |
| Mean Bias (Melatonin) | Reference method | +23.2% (range: 54.0-143.7%) | Comparison with LC-MS/MS [10] |
| Mean Bias (Cortisol) | Reference method | +48.9% (range: 59.7-184.7%) | Comparison with LC-MS/MS [10] |
| Lower LOD (Melatonin) | 0.43 pmol/L | Varies by platform | LC-MS/MS method [10] |
| Lower LOD (Cortisol) | 0.03 nmol/L | Varies by platform | LC-MS/MS method [10] |
| Multiplexing Capability | Simultaneous melatonin & cortisol | Separate assays required | [10] |
For urinary free cortisol (UFC) measurements—a primary diagnostic test for Cushing's syndrome—four new direct immunoassays (Autobio A6200, Mindray CL-1200i, Snibe MAGLUMI X8, and Roche 8000 e801) demonstrated strong correlations with LC-MS/MS (Spearman coefficients: 0.950-0.998) while eliminating the need for organic solvent extraction [3] [17]. Despite these strong correlations, all immunoassays exhibited proportionally positive biases compared to the reference LC-MS/MS method [3]. The diagnostic accuracy for Cushing's syndrome remained high across all platforms (AUC: 0.953-0.969), though established cut-off values varied substantially (178.5-272.0 nmol/24 h), highlighting the necessity for method-specific reference ranges [3] [17].
Method Selection Considerations
The choice between analytical platforms depends on research objectives, resources, and required precision:
- LC-MS/MS is recommended for studies requiring maximal sensitivity and specificity, particularly for DLMO determination, low-concentration salivary cortisol measurements, and multiplexed analyses. It is also essential for establishing reference values and validating immunoassays.
- Immunoassays may be appropriate for large-scale studies where cost and throughput are primary concerns, for measurements well within their validated ranges, and in settings lacking LC-MS/MS infrastructure.
Notably, the field is evolving toward improved immunoassay performance, with newer direct assays showing enhanced agreement with LC-MS/MS while simplifying workflows [3].
Standardized Experimental Protocols
Protocol 1: LC-MS/MS Analysis of Salivary Melatonin and Cortisol
This protocol for simultaneous quantification of salivary melatonin and cortisol is adapted from validated methods with demonstrated analytical performance [10].
Sample Collection and Storage
- Collect saliva by having participants chew on Parafilm and drool into conical polypropylene tubes. Minimum recommended volume: 2 mL.
- Collect samples consecutively during the target assessment window (e.g., 4-6 hours for DLMO determination; immediately upon waking and at 15, 30, and 45 minutes post-waking for CAR).
- Immediately freeze samples at -20°C until analysis. Avoid multiple freeze-thaw cycles.
Reagents and Calibrators
- Prepare stock solutions of melatonin and cortisol (Sigma Aldrich) in methanol.
- Prepare calibrators at five concentrations: 2.2, 21.5, 107.5, 215, and 430 pmol/L for melatonin; 0.14, 1.38, 6.9, 13.8, and 27.6 nmol/L for cortisol.
- Prepare internal standard solutions: melatonin-d4 (2,150 pmol/L) and cortisol-d4 (138 nmol/L).
- Prepare quality control samples at three concentrations: 8.6, 86, and 344 pmol/L for melatonin; 0.55, 5.52, and 22.08 nmol/L for cortisol.
Sample Preparation
- Aliquot 300 μL of saliva into Eppendorf tubes.
- Add 20 μL of internal standard solution.
- Add 1,000 μL of methyl tert-butyl ether.
- Seal tubes and vortex for 30 minutes.
- Centrifuge at 20,600 × g for 10 minutes.
- Transfer 930 μL of supernatant to a 2.0 mL polypropylene 96-deep well plate.
- Evaporate to dryness using a microplate evaporator.
- Reconstitute in 100 μL of 20% (v/v) methanol and mix for 30 minutes.
LC-MS/MS Analysis
- Instrumentation: Agilent 6490 tandem mass spectrometer with Agilent 1260 HPLC system.
- Column: C18 2.1×50 mm, 2.6 μm Kinetex column.
- Mobile Phase: A) 2-mmol/L ammonium acetate in deionized water; B) 0.1% (v/v) formic acid in acetonitrile.
- Injection Volume: 20 μL.
- Gradient: Detailed in Supplemental Data of original publication [10].
- Total Run Time: 6 minutes at flow rate of 250 μL/min.
- Ionization: Jet stream electrospray ionization in positive ion mode.
- Quantification: Perform using peak area ratio of analytes to internal standards with MassHunter Workstation software.
Validation Parameters
- Linearity: r > 0.99 for both melatonin and cortisol.
- Lower LLOQ: 2.15 pmol/L for melatonin, 0.14 nmol/L for cortisol.
- Precision: Intra-assay CV <6.8%, inter-assay CV <5.4% for both analytes.
- Extraction recovery: 100.9-102.6% for melatonin, 100.1-103.7% for cortisol.
- No significant matrix effects or carry-over observed.
Protocol 2: Immunoassay Analysis of Urinary Free Cortisol
This protocol outlines the analysis of urinary free cortisol using direct immunoassays, based on comparative studies of four commercial platforms [3] [17].
Sample Collection
- Collect 24-hour urine samples in appropriate containers without preservatives.
- Record total collection volume and aliquot samples for analysis.
- Store at -20°C if not analyzed immediately.
Analysis Platforms
- Select appropriate immunoassay platform: Autobio A6200, Mindray CL-1200i, Snibe MAGLUMI X8, or Roche 8000 e801.
- Follow manufacturer instructions for reagent preparation and instrument calibration.
Analysis Procedure
- Thaw urine samples completely and mix thoroughly.
- Centrifuge if precipitation is observed.
- Aliquot samples according to manufacturer's recommended volume.
- Perform analysis according to manufacturer's protocol for the specific platform.
- Include quality control samples at low, medium, and high concentrations.
- Calculate results using instrument software and established calibration curves.
Method-Specific Considerations
- No organic solvent extraction is required for these direct immunoassays.
- Establish method-specific reference ranges for clinical interpretation.
- For Cushing's syndrome diagnosis, apply established cut-off values: Autobio (217.0 nmol/24h), Mindray (178.5 nmol/24h), Snibe (272.0 nmol/24h), Roche (232.5 nmol/24h) [3].
Figure 2: Circadian Hormone Analysis Workflow. This diagram outlines the core procedural pathways for circadian hormone analysis using either LC-MS/MS or immunoassay platforms. Red arrows indicate the preferred application for each matrix. Yellow elements highlight critical quality assurance components. Key differentiators include the need for chromatographic separation in LC-MS/MS versus antigen-antibody reactions in immunoassays.
Standardization Framework for Circadian Studies
Pre-Analytical Considerations
Standardization must begin before sample analysis, as pre-analytical variables significantly impact results:
Sampling Protocols
- DLMO Assessment: Collect samples every 30-60 minutes during a 4-6 hour window before habitual bedtime [7].
- CAR Assessment: Collect samples immediately upon waking (0 min) and at 15, 30, and 45 minutes post-waking [7].
- Uniform Timing: Record exact sampling times and maintain consistent intervals within subjects.
- Participant Instructions: Provide standardized instructions regarding lighting conditions (dim light for DLMO), fasting status, and avoidance of interfering substances.
Biological Matrix Selection
- Saliva: Preferred for circadian assessment due to non-invasive collection, correlation with free hormone levels, and suitability for frequent sampling. Note that low concentrations challenge analytical sensitivity [7] [10].
- Urine: 24-hour collections integrate cortisol secretion over time, useful for Cushing's syndrome diagnosis [3] [17].
- Serum/Plasma: Offers higher analyte levels but is more invasive and logistically challenging for frequent sampling.
Sample Handling and Storage
- Process samples promptly after collection.
- Centrifuge saliva samples to remove particulate matter.
- Aliquot samples to avoid repeated freeze-thaw cycles.
- Maintain consistent storage conditions (-20°C or -80°C).
Analytical Quality Assurance
Method Validation
- Establish assay precision (intra- and inter-assay CV <15%).
- Determine accuracy through recovery experiments and comparison with reference methods.
- Verify lower limits of quantification suitable for physiological concentrations.
- Test for matrix effects and interferences.
Quality Control Procedures
- Include quality control samples at low, medium, and high concentrations in each run.
- Participate in external proficiency testing programs.
- Establish and monitor batch acceptance criteria.
- Maintain detailed records of calibration, maintenance, and troubleshooting.
Data Analysis and Interpretation
Circadian Parameter Calculation
- DLMO: Apply consistent threshold methods (fixed or variable) across all samples in a study.
- CAR: Calculate area under the curve or mean increase from waking to 45 minutes post-waking.
- Acrophase: Determine time of peak concentration using appropriate curve-fitting algorithms.
- Mesor: Calculate mean value across the cycle.
Statistical Considerations
- Account for within-subject correlations in longitudinal studies.
- Adjust for potential confounders (age, sex, BMI, medications).
- Apply appropriate multiple testing corrections for rhythm parameters.
Table 2: Standardized Sampling Protocols for Circadian Biomarker Assessment
| Assessment | Sample Matrix | Sampling Frequency | Key Timing Considerations | Primary Analytical Challenges |
|---|---|---|---|---|
| DLMO | Saliva | Every 30-60 min for 4-6 h | Begin 5 h before habitual bedtime | Low melatonin concentrations requiring high sensitivity |
| CAR | Saliva | 0, 15, 30, 45 min post-waking | Exact waking time critical; immediate first sample | Rapid changes requiring precise timing |
| 24-h UFC | Urine | 24-h collection | Complete collection critical; record total volume | Variable urine production; need for complete collection |
| Circadian Cortisol Profile | Saliva or Serum | Every 2-4 h for 24 h | Maintain consistent intervals around clock | Logistical challenges of nighttime sampling |
The Scientist's Toolkit: Essential Research Reagents and Materials
Table 3: Essential Research Reagents and Materials for Circadian Hormone Analysis
| Item | Function/Application | Technical Considerations |
|---|---|---|
| LC-MS/MS Grade Solvents (methanol, acetonitrile, methyl tert-butyl ether) | Sample preparation and mobile phase components | High purity essential to minimize background noise and ion suppression |
| Stable Isotope-Labeled Internal Standards (melatonin-d4, cortisol-d4) | Internal standards for LC-MS/MS quantification | Correct for matrix effects and extraction efficiency variations |
| Antibodies for Melatonin and Cortisol | Core recognition elements for immunoassays | Varying specificity between lots; requires validation for cross-reactivity |
| Calibrators at Minimum 5 Concentrations | Establishing quantification curves | Prepare in appropriate matrix to mimic sample composition |
| Quality Control Materials at multiple levels | Monitoring assay performance over time | Should span clinically relevant range; different source from calibrators |
| Saliva Collection Aids (Parafilm, Salivettes) | Standardizing saliva collection | Material must not interfere with analytical measurements |
| Low-Binding Collection and Storage Tubes | Sample collection and storage | Minimize analyte adsorption to container surfaces |
Emerging Frontiers and Concluding Remarks
The standardization of circadian assessment methodologies is evolving beyond traditional hormone measurements toward integrated multi-omics approaches. Recent research demonstrates significant correlations between the acrophases of clock gene expression (e.g., ARNTL1) and cortisol rhythms in saliva, suggesting potential for combined molecular and endocrine profiling [42]. Simultaneously, mathematical models using wearable device data (activity and light measurements) can predict circadian phase with comparable accuracy to invasive measurements, potentially expanding circadian assessment beyond specialized laboratories [70].
For researchers and drug development professionals, several key considerations emerge:
- Method Selection: Choose analytical methods based on required precision, with LC-MS/MS preferred for research endpoints requiring high sensitivity and specificity.
- Protocol Standardization: Implement consistent pre-analytical, analytical, and post-analytical procedures across studies to ensure comparability.
- Reference Ranges: Establish method-specific cut-off values, as demonstrated by the varying UFC thresholds for different immunoassays [3].
- Emerging Technologies: Incorporate complementary approaches including gene expression analysis and mathematical modeling for comprehensive circadian assessment.
The rigorous standardization outlined in these application notes provides a foundation for reliable circadian hormone analysis, enabling more reproducible research and ultimately facilitating the translation of circadian medicine into clinical practice.
Within circadian rhythm research and chronotherapy development, the Dim Light Melatonin Onset (DLMO) serves as the most reliable marker of internal circadian phase in humans [7]. Accurate DLMO assessment is critical for diagnosing Circadian Rhythm Sleep-Wake Disorders (CRSWDs) and optimizing drug administration timing in clinical trials [71] [7]. However, researchers face significant methodological challenges in DLMO calculation, primarily concerning threshold selection and managing inter-individual variation in melatonin secretion. These challenges are particularly relevant when comparing data across studies using different analytical platforms, such as LC-MS/MS and immunoassays, which vary in sensitivity and specificity [7]. This application note provides a structured framework for selecting appropriate DLMO thresholds and protocols to ensure reliable, reproducible phase estimation across diverse population groups.
DLMO Threshold Methodologies
The two primary methods for determining DLMO from salivary melatonin profiles are the fixed threshold and the variable threshold approaches. The choice between them directly impacts the calculated circadian phase and requires careful consideration of the study population and analytical method.
Fixed Threshold Method
The fixed threshold method defines DLMO as the time when melatonin concentrations cross a predetermined absolute value.
- Typical Thresholds: 3 pg/mL or 4 pg/mL in saliva are commonly used [71] [72].
- Advantages: This method is straightforward, simple to implement, and produces less variable DLMO estimates compared to variable thresholds [73]. It is highly consistent across a sample set with normal melatonin production.
- Disadvantages: It risks missing the DLMO in individuals who are "low melatonin producers" and never reach the fixed threshold, a common issue in aging populations or certain patient groups [72]. It may also be influenced by assay-specific characteristics.
Variable Threshold Method
The variable threshold method, often called the "3k method," establishes a personalized threshold for each individual based on their baseline melatonin levels [72].
- Calculation: The threshold is set as the mean of the first three low daytime samples plus two standard deviations [71] [72].
- Advantages: It accommodates both low and high baseline secretors, making it suitable for populations with wide variations in melatonin amplitude [72]. It may identify the DLMO closer to the initial rise of melatonin [73].
- Disadvantages: This method can be unreliable if baseline values are too few, inconsistent, or already showing a steep rise [7]. It can produce DLMO estimates that are 22-24 minutes earlier than those derived from a fixed 3 pg/mL threshold [73].
Table 1: Comparison of DLMO Threshold Methods
| Feature | Fixed Threshold Method | Variable Threshold (3k) Method |
|---|---|---|
| Definition | Time melatonin crosses an absolute value (e.g., 3 or 4 pg/mL) | Time melatonin crosses 2 SD above the mean of first 3 baseline samples |
| Advantages | Simple, less variable, highly consistent | Accommodates low producers, personalized |
| Disadvantages | Misses DLMO in low producers | Unstable with insufficient baselines, higher variability |
| Best For | Research studies with healthy, normal-producing participants | Clinics or studies with diverse or low-melatonin populations |
Impact of Sampling Protocol on DLMO Estimation
The sampling protocol, including the rate and window of collection, is a key factor in obtaining a reliable DLMO while managing costs and participant burden.
Sampling Rate
Research indicates that a 60-minute sampling rate can be a cost-effective and practical alternative to 30-minute sampling without significantly compromising accuracy within a well-timed window.
- Correlation: DLMOs from 60-minute sampling are highly correlated with those from 30-minute sampling (r ≥ 0.89) [73].
- Average Difference: On average, 60-minute sampling produces DLMOs only 6-8 minutes earlier than 30-minute sampling [73].
- Consideration: However, in up to 19% of cases, the difference can exceed 30 minutes, indicating that higher-density sampling may be necessary for maximum precision in all individuals [73].
Sampling Window
A partial melatonin profile is typically sufficient for DLMO calculation.
- Recommended Window: A 6-hour sampling window, starting 5 hours before habitual bedtime and ending 1 hour after bedtime, is generally adequate to capture the DLMO [71] [7].
- Extended Sampling: For individuals with suspected severe phase shifts, irregular sleep-wake cycles, or blindness (non-24-hour disorder), an extended sampling period may be required [7] [72].
Table 2: DLMO Sampling Protocol Comparison
| Parameter | High-Density Protocol | Standard Protocol | Application Context |
|---|---|---|---|
| Sampling Rate | Every 30 minutes (13 samples/6hr) | Every 60 minutes (7 samples/6hr) | |
| Sampling Window | 5 hours before to 1 hour after bedtime | 5 hours before to 1 hour after bedtime | Standard for most research & clinics [71] |
| Cost & Burden | Higher (more assays) | Lower (fewer assays) | Balancing precision with practicality |
| Precision | Higher; recommended for advanced precision [72] | Adequate; provides a reasonable phase estimate [71] [73] | Large studies, clinical settings [71] |
| Special Cases | — | — | Extended sampling required for blind individuals or severe phase shifts [7] |
Analytical Considerations: LC-MS/MS vs. Immunoassay
The choice of analytical platform profoundly impacts the reliability of melatonin measurements, especially at low concentrations near the DLMO threshold.
- Liquid Chromatography-Tandem Mass Spectrometry (LC-MS/MS): This platform offers superior specificity, sensitivity, and reproducibility for salivary hormone quantification [7]. Its high specificity minimizes cross-reactivity with confounding molecules, providing greater confidence in low baseline measurements critical for the variable threshold method.
- Immunoassays (ELISA): While widely used and often faster, immunoassays can suffer from cross-reactivity and limited specificity, which is particularly problematic for low-abundance analytes like melatonin [7]. This can lead to inaccuracies in establishing baseline levels and determining the precise onset.
Integrated Experimental Protocol for Salivary DLMO Assessment
The following workflow provides a detailed protocol for determining DLMO in a research or clinical setting, integrating threshold selection and analytical best practices.
Pre-Collection Phase
- Participant Screening: Screen for health, medication use, and recent travel. Exclude individuals taking substances known to suppress melatonin (e.g., NSAIDs, beta-blockers) or that artificially elevate it (e.g., certain antidepressants) [7].
- Sleep Schedule Stabilization: Instruct participants to maintain a fixed sleep schedule for at least one week before sampling, as habitual sleep times strongly predict circadian phase [71]. Compliance should be verified using actigraphy and sleep diaries.
Sample Collection Phase
- Setting: Conduct sampling in dim light (< 20 lux) to prevent melatonin suppression [71].
- Timing: Initiate sampling 5 hours before individual habitual bedtime and continue until 1 hour after bedtime [71] [7].
- Sampling Rate: Collect saliva every 30 minutes (13 samples) for high precision or every 60 minutes (7 samples) for a cost-effective standard protocol [71] [72].
- Method: Use passive drool or similar salivary collection methods. A volume of 0.5 mL is typically sufficient for analysis [72].
Post-Collection and Analysis Phase
- Sample Analysis: Analyze samples using a highly sensitive and specific assay.
- Platform Choice: LC-MS/MS is preferred for its high specificity and sensitivity. If using immunoassays, select a kit validated for salivary melatonin with low cross-reactivity [7].
- Assay Specifications: Ensure the assay's functional sensitivity is sufficient to detect levels below the DLMO threshold (e.g., sensitivity of ≤ 1.35 pg/mL) [72].
- Data Processing and DLMO Calculation:
- Plot the melatonin concentration against clock time.
- Threshold Application:
- For the fixed method, interpolate the time when the curve crosses 3 pg/mL (or 4 pg/mL).
- For the variable method, calculate the mean and standard deviation of the first three baseline samples. Interpolate the time when the curve crosses the value of the mean + 2SD.
- Where possible, confirm results by visual inspection of the melatonin profile [7].
The Scientist's Toolkit
Table 3: Essential Research Reagents and Materials for DLMO Studies
| Item | Function/Application | Specifications/Recommendations |
|---|---|---|
| Salivary Melatonin Assay | Quantifying melatonin concentration in saliva. | Choose a highly sensitive assay (e.g., functional sensitivity < 2 pg/mL). LC-MS/MS offers superior specificity; monoclonal antibody ELISA kits are a common alternative [7] [72]. |
| Saliva Collection Kit | Non-invasive sample collection at home or in the clinic. | Includes salivettes or passive drool tubes. 0.5 mL volume is often sufficient for duplicate analysis [72]. |
| Actigraph | Objective monitoring of sleep-wake patterns and compliance with the fixed sleep schedule prior to DLMO testing. | Worn on the non-dominant wrist [71]. |
| Dim Light Environment | Prevents light-induced suppression of melatonin during sample collection, critical for accurate phase assessment. | Maintain ambient light < 20 lux during the entire sampling period [71]. |
| Light Meter | Verifies that light levels remain within the required dim light threshold during saliva collection. | Essential for protocol compliance and data validity. |
Head-to-Head: Diagnostic Accuracy and Real-World Performance
Accurate quantification of circadian hormones is a cornerstone of research in sleep disorders, stress physiology, and chronobiology. Melatonin and cortisol, with their distinct diurnal rhythms, serve as crucial endocrine markers of the internal circadian clock [19]. The reliable measurement of these hormones, particularly in non-invasive matrices like saliva, is essential for both research and clinical diagnostics. Currently, two primary analytical platforms dominate: immunoassays (IAs) and liquid chromatography-tandem mass spectrometry (LC-MS/MS). Immunoassays, including enzyme-linked immunosorbent assay (ELISA) and radioimmunoassay (RIA), are widely used due to their operational simplicity and low cost [26]. However, liquid chromatography-tandem mass spectrometry (LC-MS/MS) is increasingly recognized for its superior specificity and sensitivity [74] [19]. This application note systematically compares these methodologies, highlighting correlation, bias, and practical implications for circadian hormone analysis within the context of a broader thesis on LC-MS/MS vs immunoassay research.
Analytical Performance of Immunoassays vs. LC-MS/MS
Table 1: Summary of Method Comparison Studies for Cortisol Measurement
| Sample Matrix | Immunoassay Method | LC-MS/MS Correlation (r) | Observed Bias | Key Findings | Source |
|---|---|---|---|---|---|
| Saliva | One RIA, two ELISA | Not directly stated (All methods detected natural fluctuations) | ELISA tended to inflate estimates, especially at lower concentrations | LC-MS/MS performed best across all validity criteria. RIA was reliable, but with higher variance. | [26] |
| Urine (UFC) | Autobio A6200 (CLIA) | 0.950 | Proportionally positive bias | Strong correlation and high diagnostic accuracy (AUC: 0.953) for Cushing's syndrome. | [18] [3] [17] |
| Urine (UFC) | Mindray CL-1200i (CLIA) | 0.998 | Proportionally positive bias | Strong correlation and high diagnostic accuracy (AUC: 0.969) for Cushing's syndrome. | [18] [3] [17] |
| Urine (UFC) | Snibe MAGLUMI X8 (CLIA) | 0.967 | Proportionally positive bias | Strong correlation and high diagnostic accuracy (AUC: 0.963) for Cushing's syndrome. | [18] [3] [17] |
| Urine (UFC) | Roche 8000 e801 (ECLIA) | 0.951 | Proportionally positive bias | Strong correlation and high diagnostic accuracy (AUC: 0.958) for Cushing's syndrome. | [18] [3] [17] |
| Saliva | Roche Cortisol II (ECLIA) | 0.955 | Mean bias of 48.9% (range: 59.7–184.7%) | LC-MS/MS provided more reliable quantification, with immunoassay showing significant overestimation. | [10] |
Table 2: Summary of Method Comparison Studies for Melatonin Measurement
| Sample Matrix | Immunoassay Method | LC-MS/MS Correlation (r) | Observed Bias | Key Findings | Source |
|---|---|---|---|---|---|
| Saliva | Bühlmann ELISA (EK-DSM) | 0.910 | Mean bias of 23.2% (range: 54.0–143.7%) | LC-MS/MS provided more sensitive and reliable quantification, crucial for detecting low levels in DLMO studies. | [10] |
Experimental Protocols
Detailed Protocol: Simultaneous LC-MS/MS Analysis of Salivary Melatonin and Cortisol
The following protocol, adapted from published methodologies [10] [60], provides a robust framework for the simultaneous quantification of melatonin and cortisol in saliva, suitable for circadian rhythm analysis.
Principle: Saliva samples are prepared using liquid-liquid extraction. Analytes are separated by reversed-phase liquid chromatography and detected via multiple reaction monitoring (MRM) in a tandem mass spectrometer, using stable isotope-labeled internal standards for precise quantification.
Reagents and Materials:
- Analytes and IS: Melatonin, cortisol, and their stable isotope-labeled internal standards (e.g., melatonin-d4, cortisol-d4 or cortisol-C13).
- Solvents: LC-MS grade methanol, acetonitrile, methyl tert-butyl ether (MTBE), dimethylsulfoxide (DMSO), and ultrapure water.
- Buffers: Ammonium acetate, formic acid.
- Consumables: Polypropylene saliva collection tubes, low-binding microcentrifuge tubes, 96-deep well plates.
Equipment:
- LC System: UHPLC or HPLC system (e.g., Agilent 1260 series).
- Mass Spectrometer: Triple quadrupole mass spectrometer (e.g., Agilent 6490, SCIEX Triple Quad 6500+, Thermo TSQ Endura).
- Chromatography Column: Reversed-phase C18 column (e.g., Kinetex C18, 2.1×50 mm, 2.6 μm or ACQUITY UPLC BEH C18, 2.1×100 mm, 1.7 μm).
Sample Preparation (Liquid-Liquid Extraction):
- Aliquot: Transfer 250-300 μL of saliva into a microcentrifuge tube.
- Add Internal Standard: Add 20 μL of the working internal standard solution (prepared in methanol or ammonium hydroxide/methanol).
- Extract: Add 1,000 μL of methyl tert-butyl ether (MTBE). Seal the tube and vortex vigorously for 30 minutes.
- Centrifuge: Centrifuge at 20,600×g for 10 minutes at room temperature.
- Transfer and Evaporate: Transfer 930 μL of the organic (upper) layer to a 96-deep well plate. Evaporate to dryness under a gentle stream of nitrogen or using a microplate evaporator.
- Reconstitute: Reconstitute the dry residue in 100 μL of a 20% (v/v) methanol in water solution. Seal the plate and mix for 30 minutes to ensure complete dissolution.
LC-MS/MS Analysis:
- Injection Volume: 10-20 μL.
- Mobile Phase:
- A: 2 mmol/L Ammonium acetate in water.
- B: 0.1% Formic acid in acetonitrile or methanol.
- Gradient Program:
- 0-1 min: 20% B
- 1-4 min: Ramp to 95% B
- 4-5 min: Hold at 95% B
- 5-5.1 min: Ramp to 20% B
- 5.1-6 min: Re-equilibrate at 20% B
- Flow Rate: 250-400 μL/min.
- Column Temperature: 40-50°C.
- Mass Spectrometer Settings:
- Ionization Mode: Positive electrospray ionization (ESI+)
- MRM Transitions: Monitor specific transitions for each analyte and its IS.
- Optimize source parameters (gas flows, temperatures, voltages) for maximum sensitivity.
Calibration and Quantification:
- Prepare a calibration curve in the same matrix as the samples (e.g., pooled saliva) or a surrogate matrix. A typical range is 2.15–430 pmol/L for melatonin and 0.14–27.59 nmol/L for cortisol [10].
- Quantify samples using the internal standard method, plotting the peak area ratio (analyte/IS) against the known concentration of the calibrators.
Protocol for Immunoassay Analysis
Principle: Immunoassays are based on the competition between the analyte in the sample and a labeled analyte (enzyme, radioisotope) for a limited amount of antibody binding sites.
General Procedure (ELISA example):
- Coat: Microwells are coated with a capture antibody specific to the hormone.
- Incubate: Saliva samples and enzyme-conjugated hormone (tracer) are added to the wells and incubated. The hormone in the sample competes with the tracer for antibody binding sites.
- Wash: Unbound materials are washed away.
- Develop: A substrate solution is added, which reacts with the bound enzyme to produce a colored product.
- Measure and Quantify: The absorbance is measured spectrophotometrically. The intensity of color is inversely proportional to the concentration of the hormone in the sample, which is determined by interpolation from a standard curve.
Visualizing the Methodological Divergence
The core difference between the two analytical techniques lies in their fundamental principles, which directly impacts their specificity and susceptibility to interference. The following diagram illustrates this logical relationship.
The Scientist's Toolkit: Essential Research Reagents and Materials
Table 3: Key Reagent Solutions for LC-MS/MS Based Circadian Hormone Analysis
| Item | Function/Application | Example Specifications |
|---|---|---|
| Stable Isotope-Labeled Internal Standards (SIL-IS) | Corrects for sample preparation losses and matrix effects, ensuring quantification accuracy. | Melatonin-d4, Cortisol-d4 [10] [60] |
| LC-MS Grade Solvents | Minimize background noise and ion suppression during mass spectrometric analysis. | Methanol, Acetonitrile, Water, Methyl tert-butyl ether (MTBE) [10] [60] |
| Chromatography Columns | Separate target analytes from matrix components and isobaric interferences. | Reversed-Phase C18 (e.g., 2.1 x 50-100 mm, 1.7-2.6 µm) [18] [10] |
| Mobile Phase Modifiers | Promote efficient ionization and sharp chromatographic peaks. | Ammonium Acetate, Formic Acid [10] [60] |
| Calibrators and Quality Controls (QCs) | Establish the calibration curve and monitor assay performance, precision, and accuracy. | Prepared in analyte-free matrix (e.g., charcoal-stripped saliva); multiple concentration levels (LLOQ, Low, Med, High) [10] |
| Sample Collection Kits | Standardize the non-invasive collection of saliva for circadian studies. | Polypropylene tubes, no citric acid or flavor-stimulated kits. |
The body of evidence unequivocally demonstrates that while modern immunoassays show strong correlations with LC-MS/MS and can be adequate for certain diagnostic applications like Cushing's syndrome screening, they consistently exhibit positive bias and poorer specificity. This is particularly problematic for circadian research, which requires precise quantification at low physiological concentrations, such as for determining DLMO or the nadir of cortisol [10] [19]. The overestimation by immunoassays, driven by cross-reactivity and matrix effects, can lead to misinterpretation of endocrine profiles. Therefore, for high-resolution circadian hormone analysis, LC-MS/MS is the unequivocal gold standard. Researchers should prioritize its use to ensure data accuracy, particularly when studying subtle variations in hormone dynamics or in populations where binding protein concentrations may be altered.
Within circadian hormone analysis research, the selection of an analytical technique is paramount, as it directly influences the diagnostic accuracy and clinical utility of the findings. The comparison between Liquid Chromatography-Tandem Mass Spectrometry (LC-MS/MS) and immunoassays represents a core methodological challenge in the precise quantification of endocrine biomarkers. This application note provides a structured evaluation of the diagnostic performance of these platforms, focusing on their sensitivity, specificity, and practical implementation in the context of circadian rhythm research. The data and protocols herein are designed to guide researchers and drug development professionals in selecting and optimizing analytical methods for studies of hormones such as cortisol and melatonin, whose circadian secretion is a critical indicator of physiological status and pathological disruption [7].
Comparative Analytical Performance of LC-MS/MS and Immunoassay
The fundamental differences in the operating principles of LC-MS/MS and immunoassays lead to significant variations in their analytical performance. The following table summarizes a comparative analysis of key performance metrics for the measurement of cortisol and melatonin, two crucial circadian biomarkers.
Table 1: Direct Comparison of LC-MS/MS and Immunoassay Performance for Circadian Hormone Analysis
| Performance Metric | LC-MS/MS | Immunoassay | Context and Evidence |
|---|---|---|---|
| Analytical Specificity | High. Minimal cross-reactivity with structurally similar analogs. [10] | Variable to Low. Prone to cross-reactivity with metabolites and other compounds. [10] | A study on salivary melatonin and cortisol reported significant positive bias in immunoassays (54.0–143.7% for melatonin; 59.7–184.7% for cortisol) attributed to cross-reactivity. [10] |
| Analytical Sensitivity (LLOQ) | Superior. Lower Limit of Quantification (LLOQ) for salivary cortisol: 0.14 nmol/L. [10] | Moderate. LLOQ is often higher and closer to the physiological low point. [10] | The superior sensitivity of LC-MS/MS is essential for reliably quantifying the low late-night salivary cortisol concentrations near 3 nmol/L found in healthy controls. [10] |
| Diagnostic Sensitivity | High (89.66%–93.10% for CS diagnosis). [17] | High (89.66%–93.10% for CS diagnosis). [17] | For Urinary Free Cortisol (UFC) in Cushing's Syndrome (CS) diagnosis, modern immunoassays can show high diagnostic sensitivity comparable to LC-MS/MS, though with a positive bias. [17] |
| Diagnostic Specificity | High (93.33%–96.67% for CS diagnosis). [17] | High (93.33%–96.67% for CS diagnosis). [17] | Specificity for CS diagnosis was also high across both platforms in a UFC study, though cut-off values varied substantially between methods. [17] |
| Correlation with Reference | Reference method. | Strong correlation (r=0.910-0.998), but with consistent positive bias. [10] [17] | Despite strong correlation coefficients (e.g., Spearman's r=0.955 for salivary cortisol), immunoassays consistently overestimate analyte concentration compared to LC-MS/MS. [10] [15] |
| Multiplexing Capability | High. Enables simultaneous measurement of multiple analytes (e.g., melatonin and cortisol) in a single run. [10] [7] | Low. Typically requires separate, single-analyte tests. [10] | The ability of LC-MS/MS to measure melatonin and cortisol simultaneously from one sample is a key advantage for circadian studies requiring correlated phase assessment. [10] [7] |
Detailed Experimental Protocols
To ensure reproducibility and facilitate the adoption of these methods, detailed protocols for both LC-MS/MS and immunoassay for the analysis of salivary cortisol and melatonin are provided below.
Protocol for Simultaneous Salivary Melatonin and Cortisol Analysis via LC-MS/MS
This protocol is adapted from a validated method that demonstrated good performance in linearity, precision, accuracy, and recovery [10].
I. Sample Collection and Pre-processing
- Collection: Collect saliva samples (≥2 mL) into conical polypropylene tubes via passive drooling or by chewing on inert material like Parafilm.
- Storage: Immediately freeze samples at -20°C or lower until analysis to preserve analyte integrity [10].
II. Sample Preparation (Liquid-Liquid Extraction)
- Aliquoting: Transfer 300 µL of saliva into a microcentrifuge tube.
- Internal Standard (IS) Addition: Add 20 µL of a deuterated IS solution (e.g., melatonin-d4 and cortisol-d4).
- Extraction: Add 1,000 µL of methyl tert-butyl ether (MTBE). Seal the tube and vortex vigorously for 30 minutes.
- Centrifugation: Centrifuge at 20,600 × g for 10 minutes to separate phases.
- Organic Layer Transfer: Carefully transfer 930 µL of the upper (organic) supernatant to a new 96-deep well plate.
- Drying and Reconstitution: Evaporate the organic solvent to dryness using a microplate evaporator. Reconstitute the dry residue with 100 µL of 20% (v/v) methanol in water and mix for 30 minutes [10].
III. LC-MS/MS Analysis
- LC System: Agilent 1260 HPLC system or equivalent.
- Column: C18 reversed-phase column (e.g., 2.1 × 50 mm, 2.6 µm).
- Mobile Phase: (A) 2 mmol/L ammonium acetate in deionized water; (B) 0.1% (v/v) formic acid in acetonitrile.
- Gradient: Use a linear gradient from high A to high B over a 6-minute total run time at a flow rate of 250 µL/min.
- Injection Volume: 20 µL.
- MS System: Agilent 6490 tandem mass spectrometer or equivalent with Jet Stream electrospray ionization (ESI) source.
- Ion Mode: Positive ion mode.
- Detection: Multiple Reaction Monitoring (MRM). Example transitions (confirm with standards):
- Melatonin: 233.1 → 174.1
- Cortisol: 363.2 → 121.2
- Melatonin-d4: 237.1 → 178.1
- Cortisol-d4: 367.2 → 121.2
- Software: Use instrument-specific software (e.g., Agilent MassHunter) for data acquisition and quantification based on the peak area ratio of analyte to IS [10].
Protocol for Salivary Cortisol Analysis via Electrochemiluminescence Immunoassay (ECLIA)
This protocol outlines a common commercial immunoassay procedure, which, while convenient, may exhibit a positive bias compared to LC-MS/MS [10] [15].
I. Sample Collection
- Follow the same collection and storage procedures as described in the LC-MS/MS protocol (Section 3.1.I).
II. Analysis Procedure
- Platform: Roche Cobas e801 or equivalent immunoassay analyzer.
- Principle: Competitive electrochemiluminescence immunoassay.
- Reagent Preparation: Load manufacturer's pre-configured reagent kits (containing biotinylated cortisol antigen and ruthenium-labeled cortisol derivative).
- Calibration: Perform calibration using the manufacturer's calibrators specific for the platform.
- Assay Execution:
- Pipette a small volume of saliva (typically 10-50 µL, per kit instructions) into the reaction vessel.
- The analyzer automatically adds the reagents. The sample cortisol competes with the labeled antigens for binding sites on streptavidin-coated microparticles.
- After incubation, the mixture is transferred to a measuring cell where electrodes apply a voltage, inducing a chemiluminescent emission.
- The emitted light signal is measured by a photomultiplier. The signal intensity is inversely proportional to the cortisol concentration in the sample.
- Quality Control: Include manufacturer-recommended quality control materials at low, medium, and high concentrations in each run [17].
Visualization of Workflows and Performance Relationships
The following diagrams illustrate the core experimental workflows and the conceptual relationship between methodological bias and diagnostic thresholds.
LC-MS/MS Analytical Workflow
Assay Bias and Diagnostic Thresholds
The Scientist's Toolkit: Essential Research Reagent Solutions
Successful implementation of circadian hormone analysis requires specific, high-quality reagents and materials. The following table details key components for the LC-MS/MS protocol.
Table 2: Essential Research Reagents and Materials for LC-MS/MS Circadian Hormone Analysis
| Reagent/Material | Function / Role in Protocol | Specific Example / Note |
|---|---|---|
| Analyte Standards | Calibration and quantification. Used to create a calibration curve for absolute concentration measurement. | Native cortisol and melatonin (Sigma-Aldrich). Prepare stock solutions in methanol and store at -80°C. [10] |
| Deuterated Internal Standards (IS) | Critical for assay precision and accuracy. Corrects for sample loss during preparation and matrix effects during ionization in the MS. | Cortisol-d4 and melatonin-d4 (e.g., from Sigma-Aldrich or C/D/N Isotopes). Added at the beginning of sample prep. [10] |
| Mass Spectrometry Grade Solvents | Used in mobile phase and sample preparation. High purity is essential to minimize background noise and ion suppression. | Methanol, acetonitrile, methyl tert-butyl ether (MTBE), formic acid (e.g., from Burdick & Jackson or equivalent). [10] |
| LC-MS/MS Mobile Phase Additives | Modifies pH and ionic strength of the mobile phase to optimize chromatographic separation and ionization efficiency. | Ammonium acetate (e.g., 2 mmol/L in water). [10] |
| Sample Collection Kits | Standardizes the non-invasive collection of saliva, a key matrix for circadian studies. | Polypropylene tubes. Parafilm for chewing stimulation. Must be free of analyte interference. [10] |
The choice between LC-MS/MS and immunoassay for endocrine diagnostics is a balance between analytical rigor and practical convenience. LC-MS/MS offers superior specificity, sensitivity, and multiplexing capabilities, making it the preferred platform for rigorous circadian rhythm research where precise quantification of low hormone levels is critical. Immunoassays, while exhibiting a consistent positive bias, have evolved to demonstrate high diagnostic sensitivity and specificity for disorders like Cushing's syndrome and can be suitable for well-defined clinical applications, provided method-specific cut-offs are established and validated [10] [17]. For researchers in drug development, the selection criteria should include the required analytical performance, the need for multi-analyte profiling, and the intended application of the data, whether for exploratory biomarker discovery or definitive clinical diagnostic support.
Within circadian hormone analysis research, the accurate measurement of urinary free cortisol (UFC) is a critical diagnostic tool for Cushing's syndrome (CS), a serious endocrine disorder caused by chronic cortisol excess. This case study examines the analytical and diagnostic performance of four new extraction-free immunoassays compared to the reference method, liquid chromatography-tandem mass spectrometry (LC-MS/MS). As research increasingly focuses on the nuances of hormonal circadian rhythms, establishing reliable, high-throughput methodologies is paramount for both clinical diagnostics and pharmaceutical development.
Analytical Method Comparison
Experimental Protocol: Method Comparison Study
Objective: To compare the analytical consistency and diagnostic accuracy for CS of four new direct immunoassays against LC-MS/MS [3] [18] [17].
Sample Collection: Residual 24-hour urine samples were collected from a cohort of 337 patients, including 94 with confirmed CS and 243 non-CS patients. Samples were stored at -80°C until analysis [18].
Instrumentation and Methods:
- Reference Method: A laboratory-developed LC-MS/MS method. Briefly, urine samples were diluted 20-fold with pure water. After adding a cortisol-d4 internal standard, the mixture was centrifuged. The supernatant was injected into a SCIEX Triple Quad 6500+ mass spectrometer. Separation was achieved on a UPLC BEH C8 column with a water-methanol mobile phase system [18].
- Test Methods: Four direct immunoassays (without organic solvent extraction) were performed on the following platforms:
Statistical Analysis: Passing-Bablok regression and Bland-Altman plot analyses were used for method comparison. The diagnostic performance was evaluated using Receiver Operating Characteristic (ROC) curve analysis, with optimal cut-off values determined by Youden's index [3] [18].
Key Findings and Quantitative Data
All four immunoassays showed strong correlations with LC-MS/MS, though with a consistent positive bias [3] [17]. The table below summarizes the core quantitative findings.
Table 1: Analytical and Diagnostic Performance of Four Immunoassays vs. LC-MS/MS
| Assay Platform | Correlation with LC-MS/MS (Spearman's r) | Area Under the Curve (AUC) | Optimal Cut-off (nmol/24 h) | Sensitivity (%) | Specificity (%) |
|---|---|---|---|---|---|
| Autobio | 0.950 | 0.953 | 178.5 | 89.66 | 93.33 |
| Mindray | 0.998 | 0.969 | 272.0 | 93.10 | 96.67 |
| Snibe | 0.967 | 0.963 | 193.6 | 90.80 | 94.67 |
| Roche | 0.951 | 0.958 | 220.0 | 89.66 | 95.33 |
The data demonstrates that all four immunoassays possess high diagnostic accuracy (AUC >0.95) for identifying Cushing's syndrome. The specific cut-off values, however, vary considerably between platforms, underscoring the necessity of using method-specific reference intervals [3] [17].
Visualized Workflows
The following diagram illustrates the core experimental workflow and the logical relationship between the methodological choices and the study's conclusions, as derived from the protocol.
The Scientist's Toolkit
The following table details key research reagents and materials essential for conducting similar studies on urinary free cortisol measurement.
Table 2: Essential Research Reagent Solutions for Urinary Free Cortisol Analysis
| Item | Function / Application | Examples / Specifications |
|---|---|---|
| Immunoassay Reagents & Calibrators | Quantifying cortisol via immunochemical reaction. Platform-specific calibrators are critical for accurate quantification. | Autobio, Mindray, Snibe, and Roche cortisol reagent kits with their respective calibrators [18]. |
| Liquid Chromatography System | Separating cortisol from other urinary components to reduce analytical interference. | UPLC system with a C8 or C18 reverse-phase column (e.g., ACQUITY UPLC BEH C8) [18] [75]. |
| Tandem Mass Spectrometer | Highly specific and sensitive detection and quantification of cortisol. | SCIEX Triple Quad 6500+ operating in positive electrospray ionization mode with Multiple Reaction Monitoring (MRM) [18] [76]. |
| Stable Isotope Internal Standard | Correcting for matrix effects and loss during sample preparation in LC-MS/MS, improving precision and accuracy. | Cortisol-d4 (Toronto Research Chemicals) [18] [77]. |
| Solid-Phase Extraction (SPE) Cartridges | Purifying and concentrating urine samples prior to LC-MS/MS analysis to enhance sensitivity and reduce ion suppression. | Used in validated sample preparation protocols [76]. |
| Quality Control (QC) Materials | Monitoring assay performance, precision, and ensuring day-to-day reproducibility. | Commercial QC materials at multiple cortisol concentrations (e.g., Bio-Rad Liquichek Urine Chemistry Control) [77]. |
Discussion
This case study confirms that modern extraction-free immunoassays demonstrate excellent analytical consistency with LC-MS/MS and high diagnostic accuracy for Cushing's syndrome [3] [17]. The elimination of the organic solvent extraction step simplifies the workflow, reduces technical complexity and safety concerns, and facilitates automation, making these assays highly suitable for routine clinical laboratories.
A critical finding is the significant variation in established cut-off values (178.5 to 272.0 nmol/24 h) across different immunoassay platforms [3]. This highlights that UFC results are method-dependent and reinforces the imperative for clinical laboratories to define and validate their own reference intervals rather than adopting universal or manufacturer-suggested values. This is a crucial consideration for researchers designing multi-center trials or comparing data across different studies.
For circadian rhythm research, where precise quantification of hormonal fluctuations is key, the choice between high-throughput immunoassays and the superior specificity of LC-MS/MS remains context-dependent. While these advanced immunoassays are robust for diagnostic classification of CS, LC-MS/MS remains the gold standard for research applications requiring absolute specificity, such as profiling cortisol metabolites or measuring low-level hormones in saliva [2] [19] [78]. Future work should focus on multi-center validation of these findings and the continued development of standardized, high-specificity assays for circadian biomarker analysis.
Air traffic control (ATC) is a high-stakes profession where cognitive performance is paramount. The workforce of over 14,000 controllers operates within a 24/7 National Airspace System (NAS), often working irregular schedules, long shifts, and unpredictable hours [79]. These working conditions, combined with disrupted circadian rhythms and insufficient rest, create fatigue – a significant threat to safety, performance, and health [79]. This case study assesses the circadian misalignment inherent in ATC shift work, exploring its biological basis, its impact on controller health and performance, and the analytical frameworks for measuring key circadian phase markers. The content is framed within broader research comparing liquid chromatography-tandem mass spectrometry (LC-MS/MS) and immunoassay methods for circadian hormone analysis, highlighting the critical importance of methodological precision in this safety-sensitive field.
Background: The Circadian System and Shift Work
Fundamentals of Circadian Biology
The human circadian system is a hierarchical network of biological clocks that regulates near-optimal 24-hour rhythms in everything from gene expression to behavior [80]. At the cellular level, core clock genes such as CLOCK, ARNTL (BMAL1), PER1-3, and CRY1-2 form transcriptional-translational feedback loops that generate and maintain these approximately 24-hour oscillations [80]. The suprachiasmatic nucleus (SCN) in the hypothalamus acts as the central pacemaker, synchronizing peripheral clocks found in tissues ranging from blood cells to oral mucosa and hair follicles [80].
Light is the most potent synchronizer of the central circadian pacemaker [80]. Exposure to light in the evening/early night causes phase delays, while morning exposure causes phase advances [80]. This master clock then coordinates the timing of physiological processes, including the secretion of key hormones like melatonin and cortisol, which serve as robust peripheral markers of circadian phase [80].
Circadian Misalignment in Shift Work
For night shift workers, including air traffic controllers, the timing of work and sleep conflicts with the endogenous circadian rhythm, which remains primarily aligned with the solar day [80]. Simulated night-shift experiments and field-based studies with shift workers both indicate that the circadian system is resistant to adaptation from a day- to a night-oriented schedule [80]. This results in a state of circadian misalignment, characterized by two primary phenomena:
- External Misalignment: The timing of the central circadian pacemaker becomes misaligned with the external light-dark cycle.
- Internal Desynchronization: Different bodily systems fall out of sync with each other. For instance, the centrally-controlled rhythms of melatonin and cortisol may not shift in concert with metabolic rhythms or the expression of clock genes in peripheral tissues [80].
This internal desynchronization is a key finding. While most rhythmic transcripts in the human genome remain adjusted to a day-oriented schedule after night shifts, metabolomics studies reveal that many metabolites shift by several hours, creating a misalignment within the body's own biochemistry [80]. This pervasive disruption contributes to the increased risk of various medical conditions associated with shift work [80].
Case Study: Air Traffic Controllers
Operational Demands and Scheduling Challenges
The ATC profession is characterized by exceptional cognitive demands, requiring controllers to manage immense and sustained cognitive loads while maintaining perfect situational awareness in a "zero-margin-for-error" environment [81]. This baseline difficulty is dangerously amplified by scheduling practices that directly undermine circadian physiology and sleep homeostasis.
- Cognitive Load: Controllers must simultaneously process multiple data streams—radar, weather updates, and radio communication—requiring exceptional cognitive flexibility and working memory [81]. High cognitive load can measurably impair core faculties like attention, memory, and decision-making, creating a critical vulnerability in the system [81].
- The 2-2-1 Shift Pattern: A particularly problematic scheduling practice is the counterclockwise rotating 2-2-1 schedule, where controllers rotate from two afternoon shifts to two morning shifts, followed by an overnight shift [79]. This rotation pattern opposes the body's natural tendency to delay and is exceptionally difficult to adapt to, contributing to significant sleep loss and circadian disruption [79] [82].
- Chronic Understaffing and Fatigue: The ATC system has faced a decade-long structural deficit, leading to mandatory 6-day workweeks and 10-hour days becoming the de facto operating model [81]. This chronic understaffing creates a "death spiral" where overworked certified controllers have reduced capacity to train new personnel, perpetuating the staffing crisis and the state of permanent fatigue [81].
Documented Impacts of Fatigue
The consequences of sleep deprivation and circadian misalignment in ATC are not theoretical. A 2021 review noted that fatigue was a probable cause in 21%-23% of major aviation accident investigations over the past two decades [79]. The National Transportation Safety Board (NTSB) has documented specific instances where controller errors, including forgetting critical information and failing to pay close attention to runways and displays, were linked to insufficient sleep [82]. Research indicates that controllers average only 2.3 hours of sleep before a midnight shift, far less than the 7-8 hours required for optimal functioning [82].
Table 1: Documented Impacts of Fatigue in Air Traffic Control
| Impact Area | Documented Consequence | Source |
|---|---|---|
| Aviation Safety | Fatigue was a probable cause in 21-23% of major aviation accidents over two decades. | [79] |
| Controller Performance | Errors include forgetting critical information and failing to monitor runways/displays. | [82] |
| Sleep Duration | Controllers average only 2.3 hours of sleep before a midnight shift. | [82] |
| Cognitive Function | High cognitive load impairs attention, memory, decision-making, and time perception. | [81] |
Analytical Framework: Assessing Circadian Misalignment
Accurately measuring circadian phase is fundamental to understanding and mitigating its disruption. Melatonin and cortisol are the two primary hormonal markers used for this purpose.
LC-MS/MS vs. Immunoassay for Hormone Analysis
The choice of analytical methodology is critical for obtaining reliable circadian phase data. While immunoassays are widely used due to their low cost and technical ease, liquid chromatography-tandem mass spectrometry (LC-MS/MS) offers significant advantages for circadian research [10].
A 2021 method comparison study using 121 saliva samples demonstrated a strong correlation between LC-MS/MS and immunoassays (Pearson’s r=0.910 for melatonin, r=0.955 for cortisol) [10]. However, the immunoassays demonstrated a significant mean bias of 23.2% for melatonin and 48.9% for cortisol, consistently overestimating concentrations compared to the LC-MS/MS reference method [10]. This lack of specificity, likely due to cross-reactivity with other matrix compounds, makes immunoassays less suitable for the precise quantification required in circadian phase studies, especially at the low concentrations typical of salivary melatonin during the day or of late-night salivary cortisol [10].
Table 2: Comparison of LC-MS/MS and Immunoassay for Circadian Hormone Analysis
| Parameter | Liquid Chromatography-Tandem Mass Spectrometry (LC-MS/MS) | Immunoassay (ELISA/ECLIA) |
|---|---|---|
| Principle | Physical separation and detection by mass | Antibody-antigen binding |
| Multiplexing | Simultaneous measurement of melatonin and cortisol | Separate tests required for each analyte |
| Sensitivity | High (LLOQ: Melatonin = 2.15 pmol/L, Cortisol = 0.14 nmol/L) [10] | Often insufficient for low circadian concentrations [10] |
| Specificity | High; minimal cross-reactivity | Subject to cross-reactivity with metabolites |
| Accuracy | High; reference method | Significant bias (23.2% for melatonin, 48.9% for cortisol) [10] |
| Best Use Case | Research requiring high precision; diagnostic applications | High-throughput screening where cost is a primary factor |
Protocol for Assessing Circadian Phase in Shift Workers
The following protocol is synthesized from guidelines for human circadian rhythm studies and analytical method validation [10] [12]. It is designed to minimize confounding variables and ensure rigorous data collection when studying a shift-working population like air traffic controllers.
Participant Inclusion/Exclusion Criteria:
- Include: Healthy adults engaged in a defined shift schedule (e.g., the 2-2-1 rotation) for at least one month.
- Exclude: Individuals with a history of psychiatric, sleep, or circadian rhythm disorders; recent transmeridian travel; use of beta-blockers, benzodiazepines, or other medications known to affect melatonin or cortisol secretion; substance abuse; and visual acuity issues that would affect light perception [12].
Sample Collection Protocol:
- Setting: Samples should be collected under dim light conditions (<10-30 lux) to avoid suppressing melatonin production [12].
- Matrix: Saliva is the preferred matrix for field studies due to non-invasive collection, allowing for frequent sampling over a 24-hour period. Salivary concentrations correlate well with plasma-free (bioavailable) hormone levels [10].
- Schedule: On a designated assessment day (e.g., after a night shift series), participants should provide saliva samples at pre-defined intervals (e.g., every 1-2 hours) throughout the waking period and, if feasible, across the 24-hour cycle to fully characterize the rhythm.
- Controls: Participants should refrain from eating, drinking (except water), brushing teeth, or exercising for at least 30 minutes before each sample collection to prevent contamination or alteration of analyte levels [12].
- Storage: Samples should be frozen immediately after collection and stored at ≤ -20°C until analysis.
Analytical Protocol (LC-MS/MS):
- Sample Preparation: 300 µL of saliva is mixed with 20 µL of internal standard solution (e.g., melatonin-d4 and cortisol-d4) and 1000 µL of methyl tert-butyl ether for liquid-liquid extraction. The mixture is vortexed and centrifuged, and the organic supernatant is evaporated to dryness before reconstitution in a mobile phase-compatible solvent [10].
- Instrumentation: Analysis is performed using a high-performance liquid chromatography system coupled to a tandem mass spectrometer (e.g., Agilent 1260 HPLC/6490 MS) with a C18 column [10].
- Chromatography: A gradient mobile phase, for example, from 2-mmol/L ammonium acetate in water to 0.1% formic acid in acetonitrile, is used to achieve separation over a run time of approximately 6 minutes [10].
- Detection: Mass spectrometry detection is performed in positive ion, multiple reaction monitoring (MRM) mode. Key transitions include m/z 233.2→174.2 for melatonin and m/z 363.3→121.2 for cortisol [10].
- Quantification: Calibration curves are constructed using the peak area ratio of the analyte to its corresponding deuterated internal standard. The method should be validated for linearity, precision, accuracy, and recovery according to clinical laboratory standards [10].
The Scientist's Toolkit: Research Reagent Solutions
The following table details essential materials and reagents for conducting circadian hormone analysis via LC-MS/MS in a research setting.
Table 3: Key Research Reagents and Materials for LC-MS/MS Circadian Hormone Analysis
| Item | Function / Application | Example / Specification |
|---|---|---|
| Melatonin & Cortisol Standards | Certified reference materials for creating calibration curves to ensure quantitative accuracy. | Sigma-Aldrich (Purity ≥98%) [10] |
| Deuterated Internal Standards (IS) | Correct for variability in sample preparation and ionization efficiency; essential for precise quantification. | Melatonin-d4, Cortisol-d4 [10] |
| Mass Spectrometry Grade Solvents | High-purity solvents for mobile phase and sample preparation to minimize background noise and ion suppression. | Methanol, Acetonitrile, Methyl tert-butyl ether (Burdick & Jackson) [10] |
| Chromatography Column | Stationary phase for separating analytes from matrix interferences prior to mass spectrometry detection. | C18, 2.1 x 50 mm, 2.6 µm particle size (e.g., Kinetex) [10] |
| Saliva Collection Kit | Standardized, non-invasive collection of patient samples for hormone analysis. | Polypropylene tubes, Parafilm for chewing/drooling [10] |
Circadian Rhythm Disruption in Shift Work: A Pathways Diagram
The following diagram illustrates the logical pathway through which shift work leads to circadian misalignment and its consequences in air traffic controllers.
Experimental Workflow for Circadian Assessment
The diagram below outlines the key steps in a comprehensive protocol for assessing circadian misalignment in a shift work population.
Mitigation Strategies and Recent Reforms
Recognition of the severe impact of circadian misalignment and fatigue has prompted regulatory and operational reforms within the FAA, informed by sleep and circadian science.
- Elimination of the 2-2-1 Pattern: An expert panel convened by the FAA specifically recommended abolishing the counterclockwise rotating 2-2-1 schedule, replacing it with schedules aligned with sleep and circadian principles [79].
- Extended Rest Periods: The FAA, in partnership with the National Air Traffic Controllers Association (NATCA), has implemented new rules guaranteeing 10 hours off between shifts and 12 hours off before and after midnight shifts [79]. This provides a longer window to obtain sufficient sleep and aids circadian adaptation.
- Fatigue Risk Management: A broader, unified fatigue management system is being implemented, which includes monitoring schedule violations, limiting consecutive overtime, and procedures for improved recuperative breaks during shifts [79].
These evidence-based strategies represent a significant step toward safeguarding both the well-being of the ATC workforce and the safety of the National Airspace System [79].
Air traffic controllers represent a critical population experiencing profound circadian misalignment due to non-standard work schedules. The case study demonstrates that the resulting fatigue has measurable, detrimental effects on cognitive performance and safety. Rigorous scientific assessment of this misalignment relies on precise analytical methods, such as LC-MS/MS, which provides the specificity and sensitivity required for accurate quantification of circadian phase markers like melatonin and cortisol over traditional immunoassays. Continued research using these precise methodologies is essential for validating and refining the mitigation strategies—such as circadian-aligned scheduling and extended rest periods—that are now being implemented to protect public safety and controller health.
The accurate measurement of circadian hormones, such as cortisol and melatonin, is fundamental to advancing our understanding of chronobiology and developing therapies for circadian rhythm-related disorders. The choice between liquid chromatography-tandem mass spectrometry (LC-MS/MS) and immunoassays (IAs) represents a critical methodological crossroad, forcing researchers to balance analytical excellence against practical laboratory constraints. This analysis systematically compares these platforms within circadian research, providing a framework for evidence-based methodological selection. The core challenge lies in reconciling the unparalleled specificity and sensitivity of LC-MS/MS with the operational simplicity and throughput of modern immunoassays, a decision with profound implications for data quality, diagnostic accuracy, and resource allocation [19].
Analytical Performance Comparison
The fundamental difference between platforms lies in their analytical principles. Immunoassays rely on antibody-antigen binding, which can be susceptible to cross-reactivity with structurally similar molecules, leading to potential overestimation of hormone concentrations [26]. In contrast, LC-MS/MS physically separates analytes via liquid chromatography before using mass-to-charge ratios for identification and quantification, virtually eliminating cross-reactivity and providing superior specificity [19] [26].
A 2025 multicenter comparison of salivary cortisol and testosterone assessment demonstrates this performance gap. LC-MS/MS consistently outperformed immunoassays across all validity criteria, while ELISA methods tended to overestimate hormone levels, particularly in the lower concentration range critical for detecting nocturnal troughs in circadian profiles [26]. Similarly, a 2025 evaluation of four new immunoassays for urinary free cortisol (UFC) found that, despite strong correlations with LC-MS/MS (Spearman's r ≥ 0.950), all immunoassays exhibited a proportional positive bias [3] [18]. This consistent overestimation can compress the dynamic range of circadian rhythms and obscure true physiological variations.
Table 1: Analytical Performance Profile: LC-MS/MS vs. Immunoassay for Circadian Hormone Analysis
| Performance Characteristic | LC-MS/MS | Immunoassays (Direct, without extraction) |
|---|---|---|
| Analytical Specificity | High (Minimal cross-reactivity) [26] | Variable (Susceptible to cross-reactivity) [26] |
| Sensitivity | Superior for low-abundance analytes [19] | Generally sufficient for cortisol, less for melatonin [19] |
| Correlation with LC-MS/MS | Reference Method | Spearman r = 0.950 - 0.998 for UFC [3] [18] |
| Typical Bias vs. LC-MS/MS | Reference Method | Proportional positive bias [3] [18] |
| Multiplexing Capability | High (Simultaneous quantification of multiple steroids) [83] | Low (Typically single-analyte) |
| Precision | High (CVs typically <10%) | Moderate to High (CVs ~2-5% for newer platforms) [18] |
Table 2: Diagnostic Accuracy for Cushing's Syndrome (UFC Measurement)
| Assay Platform | Area Under the Curve (AUC) | Sensitivity (%) | Specificity (%) | Optimal Cut-off (nmol/24 h) |
|---|---|---|---|---|
| Autobio A6200 | 0.953 | 89.7 - 93.1 | 93.3 - 96.7 | 178.5 - 272.0 [3] |
| Mindray CL-1200i | 0.969 | 89.7 - 93.1 | 93.3 - 96.7 | 178.5 - 272.0 [3] |
| Snibe MAGLUMI X8 | 0.963 | 89.7 - 93.1 | 93.3 - 96.7 | 178.5 - 272.0 [3] |
| Roche 8000 e801 | 0.958 | 89.7 - 93.1 | 93.3 - 96.7 | 178.5 - 272.0 [3] |
Operational and Economic Considerations
Beyond analytical performance, practical considerations heavily influence platform selection. LC-MS/MS represents a significant capital investment, with instrumentation costs far exceeding those of automated immunoassay analyzers. Operational costs are also complex; while reagent costs per sample may be lower for LC-MS/MS, these are offset by the requirement for highly skilled personnel, high-purity solvents, and costly stable-isotope internal standards [84] [85].
For laboratories without in-house LC-MS/MS capabilities, commercial analysis services are an option, with costs in 2025 ranging from $100 to $350 per sample, depending on the complexity and required turnaround time [84]. In contrast, modern automated immunoassays offer high throughput and rapid turnaround, with workflows that can be managed by general laboratory technologists without specialized mass spectrometry training. The simplification of newer direct immunoassays, which eliminate the need for organic solvent extraction, further enhances their operational practicality while maintaining good diagnostic accuracy [3] [18].
Table 3: Operational and Economic Practicality
| Operational Factor | LC-MS/MS | Immunoassays |
|---|---|---|
| Instrument Capital Cost | High [85] | Moderate to Low |
| Throughput | Low to Moderate | High [83] |
| Assay Development Time | Lengthy (Complex optimization) [83] | Short (Pre-optimized kits) |
| Personnel Skill Requirement | High (Specialized expertise required) [85] | Moderate (Standard lab training) |
| Sample Preparation Complexity | High (Often requires extraction) [18] | Low (Direct measurement available) [3] |
| Cost per Sample (Service) | ~$100 - $350 [84] | Typically lower than LC-MS/MS service costs |
| Time to First Result | Hours (including lengthy chromatography) | Minutes |
Detailed Experimental Protocols
Protocol for LC-MS/MS Analysis of Salivary Cortisol Circadian Rhythm
This protocol is designed for the precise quantification of salivary cortisol across multiple timepoints to characterize the diurnal cortisol rhythm, including the Cortisol Awakening Response (CAR) [19].
Materials & Reagents:
- Saliva Collection: Salivettes or similar passive drool collection devices.
- Internal Standard: Cortisol-d4 (Toronto Research Chemicals, Canada) solution [18].
- LC-MS/MS System: UHPLC system coupled to a triple-quadrupole mass spectrometer (e.g., SCIEX Triple Quad 6500+) [18].
- Chromatography Column: Reversed-phase C8 or C18 column (e.g., ACQUITY UPLC BEH C8, 2.1 × 100 mm, 1.7 μm) [18].
- Mobile Phases: (A) Water with 0.1% Formic Acid; (B) Methanol with 0.1% Formic Acid.
Procedure:
- Sample Collection: Participants provide saliva samples at prescribed times (e.g., immediately upon waking, 30 min post-waking, 45 min post-waking, and evening/bedtime) over one or more days. Samples are stored at -80°C until analysis [19].
- Sample Preparation: Thaw samples and centrifuge at high speed to precipitate mucins. Transfer 200 μL of clear supernatant to a new vial. Add 20 μL of internal standard solution (e.g., 25 ng/mL cortisol-d4). Vortex mix thoroughly and centrifuge [18].
- LC-MS/MS Analysis:
- Chromatography: Inject a small aliquot (e.g., 10 μL) onto the column. Employ a binary gradient at a flow rate of 0.4 mL/min. Example gradient: start at 30% B, increase to 95% B over 5 minutes, hold for 1 minute, then re-equilibrate to initial conditions.
- Mass Spectrometry: Operate the mass spectrometer in positive electrospray ionization (ESI+) mode. Use Multiple Reaction Monitoring (MRM) for detection. Key transitions: Cortisol: 363.2 → 121.0 (quantifier) and 363.2 → 327.0 (qualifier); Cortisol-d4: 367.2 → 121.0 [18].
- Data Analysis: Quantify cortisol in samples by calculating the ratio of the analyte peak area to the internal standard peak area and interpolating from a daily fresh calibration curve.
Protocol for Direct Immunoassay of Urinary Free Cortisol (UFC)
This protocol utilizes modern automated chemiluminescence platforms for the high-throughput measurement of UFC, a key diagnostic test for Cushing's syndrome, without the need for prior extraction [3] [18].
Materials & Reagents:
- Sample: 24-hour urine collection, aliquoted and stored at -20°C.
- Platforms: Automated immunoassay analyzer (e.g., Roche cobas e801, Mindray CL-1200i, Snibe MAGLUMI X8) [3] [18].
- Assay Kits: Manufacturer-specific cortisol reagent kits, calibrators, and quality controls.
Procedure:
- Sample Preparation: Thaw urine samples and mix by inversion. For platforms requiring it, dilute samples according to the manufacturer's instructions using the specified diluent (e.g., phosphate-buffered saline, manufacturer's diluent, or cortisol calibrator C0) [18].
- Instrument Calibration: Perform a full calibration of the immunoassay analyzer using the manufacturer's multi-point calibrators, as per the standard operating procedure.
- Quality Control: Assay two levels of quality control materials to ensure the assay is performing within specified parameters.
- Sample Analysis: Load prepared samples, calibrators, and controls onto the analyzer. The assay is typically a competitive chemiluminescence immunoassay performed automatically according to the pre-programmed protocol. The instrument directly reports concentration values.
- Data Review: Review results for any flags (e.g., values exceeding the analytical measurement range requiring dilution) and calculate total 24-h UFC excretion.
Essential Research Reagent Solutions
Successful implementation of circadian hormone analysis requires specific, high-quality reagents. The following table details key materials and their critical functions in the analytical process.
Table 4: Essential Research Reagents and Materials
| Item | Function/Application | Example/Specification |
|---|---|---|
| Stable Isotope-Labeled Internal Standards | Corrects for matrix effects and losses during sample preparation in LC-MS/MS, ensuring quantification accuracy. | Cortisol-d4 [18] |
| Chromatography Columns | Separates the target hormone from isobaric interferences and other matrix components prior to mass spectrometric detection. | Reversed-Phase (e.g., C8, C18, 2.1 x 100 mm, 1.7 μm) [18] |
| Immunoassay Reagent Kits | Provide antibodies, labeled conjugates, and buffers optimized for specific, automated detection on a given platform. | e.g., Roche Elecsys Cortisol III, Mindray Cortisol (CLIA) [3] [18] |
| Mass Spectrometry Calibrators | Establishes the quantitative relationship between instrument response and analyte concentration for LC-MS/MS. | Prepared in synthetic urine or stripped serum to match matrix. |
| Sample Collection Devices | Allows for non-invasive, frequent sampling by participants in their natural environment for circadian profiling. | Salivettes for saliva; containers for 24-h urine [19] |
The choice between LC-MS/MS and immunoassay for circadian hormone analysis is not a simple binary decision but a strategic one that aligns research goals with practical capabilities. LC-MS/MS is the unequivocal choice for discovery-phase research, method reference, and quantifying multiple low-abundance hormones (like melatonin) where ultimate specificity is non-negotiable [19] [26]. Conversely, modern direct immunoassays present a robust and practical solution for high-volume routine testing, such as UFC measurement for Cushing's syndrome screening, where their diagnostic accuracy has been validated and their throughput is advantageous [3] [18].
The evolving landscape, marked by improvements in immunoassay specificity and the gradual reduction of LC-MS/MS operational barriers, promises to narrow the current practicality gap. For the contemporary researcher, a hybrid approach often proves most effective: employing LC-MS/MS to establish reference values and validate biomarkers, while leveraging validated immunoassays for large-scale clinical and longitudinal studies. This synergistic use of both technologies ensures that the pursuit of scientific rigor remains firmly grounded in operational reality.
Conclusion
The choice between LC-MS/MS and immunoassay for circadian hormone analysis is a strategic decision that directly impacts data quality and biological interpretation. While immunoassays offer practicality and throughput, LC-MS/MS consistently demonstrates superior specificity, sensitivity, and the unique ability to multiplex biomarkers, making it the gold standard for rigorous circadian research. The future of circadian medicine hinges on precise biomarker assessment, which will be fueled by technological advancements making LC-MS/MS more accessible and the development of standardized protocols. Embracing these precise methodologies will be crucial for unlocking the full potential of chronotherapy and understanding the profound link between circadian rhythms and human health.
References
- 1. Methods for Assessment of Sleep and Circadian Rhythms in ... [https://pmc.ncbi.nlm.nih.gov/articles/PMC12540570/]
- 2. Methodological Insights into the Detection of Melatonin and ... [https://pubmed.ncbi.nlm.nih.gov/40723877/]
- 3. Comparative evaluation of four new immunoassays and LC ... [https://pubmed.ncbi.nlm.nih.gov/40584217/]
- 4. Analytical Validation of an LC-MS/MS Method for ... [https://www.mdpi.com/1422-0067/26/13/6358]
- 5. Circadian inference of rhythmicity using comparative ... [https://www.sciencedirect.com/science/article/pii/S2590137025000834]
- 6. Detection and Analysis of Circadian Biomarkers for Metabolic ... [https://medinform.jmir.org/2025/1/e69328]
- 7. Circadian Biomarkers in Humans: Methodological Insights into ... [https://pmc.ncbi.nlm.nih.gov/articles/PMC12293921/]
- 8. Melatonin-Measurement Methods and the Factors Modifying ... [https://pmc.ncbi.nlm.nih.gov/articles/PMC7142625/]
- 9. Status of research on the application of melatonin ... [https://www.frontiersin.org/journals/psychiatry/articles/10.3389/fpsyt.2025.1640198/full]
- 10. A Sensitive and Specific Liquid Chromatography-Tandem ... [https://pmc.ncbi.nlm.nih.gov/articles/PMC7443521/]
- 11. Comparing immunoassay and mass spectrometry ... [https://www.sciencedirect.com/science/article/pii/S0306453025001027]
- 12. Human circadian rhythm studies: Practical guidelines for ... [https://www.sciencedirect.com/science/article/pii/S2451994422000062]
- 13. LC-MS Data Processing Software [https://www.thermofisher.com/us/en/home/industrial/mass-spectrometry/liquid-chromatography-mass-spectrometry-lc-ms/lc-ms-software/lc-ms-data-processing-software.html]
- 14. LC-MS Data Acquisition Software [https://www.thermofisher.com/us/en/home/industrial/mass-spectrometry/liquid-chromatography-mass-spectrometry-lc-ms/lc-ms-software/lc-ms-data-acquisition-software.html]
- 15. Comparative analysis of salivary cortisol measurements ... [https://www.sciencedirect.com/science/article/pii/S2352551724000398]
- 16. Circadian rhythm homeostasis biomarkers [https://www.sciopen.com/article/10.26599/OSHM.2025.9610028]
- 17. Comparative evaluation of four new immunoassays and LC ... [https://www.sciencedirect.com/science/article/pii/S235255172500037X]
- 18. Comparative evaluation of four new immunoassays and LC ... [https://pmc.ncbi.nlm.nih.gov/articles/PMC12205834/]
- 19. Circadian Biomarkers in Humans: Methodological Insights ... [https://www.mdpi.com/2218-273X/15/7/1006]
- 20. Circadian Rhythm Dysfunction in Neurodegenerative Diseases [https://pmc.ncbi.nlm.nih.gov/articles/PMC12640578/]
- 21. Study on the sleep–wake circadian rhythm and phenotypic ... [https://www.frontiersin.org/journals/neuroscience/articles/10.3389/fnins.2025.1633011/full]
- 22. UPLC-MS/MS simultaneous quantification of urinary ... [https://www.sciencedirect.com/science/article/abs/pii/S1570023223000740]
- 23. Blood Clock Correlation Distance (BloodCCD) as a novel ... [https://www.nature.com/articles/s44276-025-00176-9]
- 24. Cortisol Detection Methods and the Hormone's Role in ... [https://www.mdpi.com/1422-0067/26/18/9141]
- 25. A method for simultaneous analysis of urinary melatonin ... [https://www.sciencedirect.com/science/article/abs/pii/S003991402501118X]
- 26. Multicenter comparison of LC-MS/MS, radioimmunoassay, ... [https://pubmed.ncbi.nlm.nih.gov/41107114/]
- 27. A promising new direct immunoassay for urinary free ... [https://www.degruyterbrill.com/document/doi/10.1515/cclm-2024-1192/html?recommended=sidebar&srsltid=AfmBOopUuogRbmxmhEhOdoUBH-YuPjN4Evlgt3p9VfJFGT0lyU8zOwsq]
- 28. Raptin, a sleep-induced hypothalamic hormone, ... [https://www.nature.com/articles/s41422-025-01078-8]
- 29. Development and Validation of LC-MS/MS Method for ... [https://www.mdpi.com/1422-0067/24/20/15364]
- 30. Enzyme-Linked Immunosorbent Assay versus ... [https://gjmpbu.org/enzyme-linked-immunosorbent-assay-versus-chemiluminescent-immunoassay-a-general-overview/]
- 31. Immunoassay Methods - Assay Guidance Manual - NCBI - NIH [https://www.ncbi.nlm.nih.gov/books/NBK92434/]
- 32. Comparing Assay Performance of ELISA and ... [https://pmc.ncbi.nlm.nih.gov/articles/PMC5198321/]
- 33. Comparison of Simoa, high‑sensitivity ELISA, and CLIA for ... [https://www.nature.com/articles/s41598-025-25926-0]
- 34. Comparative evaluation of immunoassays to improve ... [https://www.sciencedirect.com/science/article/pii/S1201971219303078]
- 35. Application to air traffic controllers [https://pubmed.ncbi.nlm.nih.gov/37040674/]
- 36. Mass Spectrometry-Based Multiplexing for the Analysis of ... [https://pmc.ncbi.nlm.nih.gov/articles/PMC3640576/]
- 37. A comparison of four methods to estimate dim light ... [https://pubmed.ncbi.nlm.nih.gov/36519316/]
- 38. Circadian rhythms revealed: unraveling the genetic ... [https://www.frontiersin.org/journals/sleep/articles/10.3389/frsle.2025.1544945/full]
- 39. A 5-h DLMO Sampling Protocol Using Wearable Data [https://pure.kaist.ac.kr/en/publications/enhanced-circadian-phase-tracking-a-5-h-dlmo-sampling-protocol-us/]
- 40. Laboratory validation of an in-home method for assessing ... [https://www.sciencedirect.com/science/article/pii/S1389945712000068]
- 41. Laboratory validation of an in-home method for ... - PubMed [https://pubmed.ncbi.nlm.nih.gov/22445311/]
- 42. Comprehensive integrative analysis of circadian rhythms in ... [https://www.nature.com/articles/s44323-025-00035-3]
- 43. Evaluation and update of the expert consensus guidelines ... [https://www.sciencedirect.com/science/article/abs/pii/S0306453022002876]
- 44. Assessment of the cortisol awakening response: Expert ... [https://pubmed.ncbi.nlm.nih.gov/26563991/]
- 45. Conditioning of the Cortisol Awakening Response in ... [https://www.researchprotocols.org/2023/1/e38087/]
- 46. SBB - Measuring Cortisol & the HPA Axis [https://salimetrics.com/sbb-measuring-cortisol-the-hpa-axis/]
- 47. Relationship between the cortisol awakening response and ... [https://pmc.ncbi.nlm.nih.gov/articles/PMC3812410/]
- 48. Simultaneous measurement of 17 endogenous steroid ... [https://www.sciencedirect.com/science/article/pii/S0960076024001262]
- 49. UPLC–TOF–MS Method for Simultaneous Quantification of ... [https://www.mdpi.com/1420-3049/26/20/6213]
- 50. Simultaneous Quantification of Steroid Hormones Using ... [https://pmc.ncbi.nlm.nih.gov/articles/PMC9414922/]
- 51. LC-MS/MS Quantitative Assays [https://mscore.web.unc.edu/lc-ms-ms-quantitative-assays/]
- 52. A suggested standard for validation of LC-MS/MS based ... [https://pmc.ncbi.nlm.nih.gov/articles/PMC8600988/]
- 53. Interferences in Immunoassay - PMC - PubMed Central - NIH [https://pmc.ncbi.nlm.nih.gov/articles/PMC1904417/]
- 54. An Introduction To Immunoassay Interference | Blog [https://www.biosynth.com/blog/immunoassay-interference]
- 55. Cross-reactivity of steroid hormone immunoassays [https://bmcclinpathol.biomedcentral.com/articles/10.1186/1472-6890-14-33]
- 56. Solutions to immunoassay interference, cross reactivity and ... [https://www.gyrosproteintechnologies.com/spinblog/immunoassay-interference-crossreactivity-challenges]
- 57. Discovering Cross-Reactivity in Urine Drug Screening ... [https://pmc.ncbi.nlm.nih.gov/articles/PMC7055671/]
- 58. The advantages and the limitations of LC-MS/MS and Elisa ... [https://www.biotrial.com/bioanalysis-lc-ms-ms-vs-elisa/]
- 59. Salivary Melatonin & DLMO for Sleep Research [https://salimetrics.com/analyte/salivary-melatonin/]
- 60. An LC-MS/MS-based method for the simultaneous ... [https://www.sciencedirect.com/science/article/abs/pii/S000326972400040X]
- 61. New Ultrasensitive LC–MS/MS Method Allows for Accurate ... [https://www.chromatographyonline.com/view/new-ultrasensitive-lc-ms-ms-method-allows-for-accurate-melatonin-quantification-in-human-saliva]
- 62. Salivary Melatonin ELISA Kit [https://salimetrics.com/assay-kit/salivary-melatonin-elisa-kit/]
- 63. A dual-channel self-amplifying lateral flow immunoassay ... [https://pubmed.ncbi.nlm.nih.gov/41135997/?utm_source=FeedFetcher&utm_medium=rss&utm_campaign=None&utm_content=00FZdH0qyNuwAqnGGskjyvFouwUkfiR7z1Rp39QUxtt&fc=None&ff=20251025230337&v=2.18.0.post22+67771e2]
- 64. A dual-channel self-amplifying lateral flow immunoassay ... [https://www.sciencedirect.com/science/article/abs/pii/S0003267025010918]
- 65. Comparing immunoassay and mass spectrometry ... [https://pubmed.ncbi.nlm.nih.gov/39933211/]
- 66. A Sensitive and Specific Liquid Chromatography-Tandem Mass Spectrometry Assay for Simultaneous Quantification of Salivary Melatonin and Cortisol: Development and Comparison With Immunoassays - PMC [https://www.ncbi.nlm.nih.gov/pmc/articles/PMC7443521/]
- 67. Using LC-MS/MS to Determine Salivary Steroid Reference ... [https://www.mdpi.com/2218-1989/13/2/265]
- 68. Development and Validation of Sensitive, Fast and Simple ... [https://www.mdpi.com/2218-1989/13/7/825]
- 69. LC-MS/MS in the Clinical Laboratory – Where to From Here? [https://pmc.ncbi.nlm.nih.gov/articles/PMC3052391/]
- 70. Predicting circadian phase across populations: a comparison ... [https://pmc.ncbi.nlm.nih.gov/articles/PMC8503830/]
- 71. Estimating the dim light melatonin onset of adolescents within ... [https://pmc.ncbi.nlm.nih.gov/articles/PMC4913029/]
- 72. Shift Right: Assessing Circadian Rhythm Sleep Disorders ... [https://salimetrics.com/salivary-melatonin-and-dim-light-melatonin-onset-dlmo/]
- 73. Calculating the dim light melatonin onset [https://stacks.cdc.gov/view/cdc/193223]
- 74. Reliable in-house LC-MS/MS method for steroid hormone ... [https://www.sciencedirect.com/science/article/pii/S0009898125004899]
- 75. Determination of human urinary cortisol, cortisone and ... [https://www.sciencedirect.com/science/article/pii/S0009898125002037]
- 76. Validation of a LC-MS/MS method for establishing ... [https://pubmed.ncbi.nlm.nih.gov/38309552/]
- 77. Comparison of Direct and Extraction Immunoassay ... [https://synapse.koreamed.org/articles/1516083887]
- 78. Preserved circadian variation in cortisol and androgens ... [https://www.nature.com/articles/s41598-025-01165-1]
- 79. Taking steps toward safer skies [https://aasm.org/taking-steps-toward-safer-skies/]
- 80. Disturbance of the Circadian System in Shift Work and Its ... [https://pmc.ncbi.nlm.nih.gov/articles/PMC8832572/]
- 81. Time Zones and the American Air Traffic Controller [https://www.timetrex.com/blog/time-zones-and-the-american-air-traffic-controller]
- 82. Sleep deprivation affects air traffic controllers & other shift ... [https://sleepeducation.org/sleep-deprivation-affects-air-traffic-controllers-other-shift-workers/]
- 83. LC-MS/MS-Based Diagnostics Market Size, Trends and ... [https://www.towardshealthcare.com/insights/lc-ms-ms-based-diagnostics-market-sizing]
- 84. How Much Does LCMS Analysis Service Cost in 2025? ... [https://resolvemass.ca/lcms-analysis-service/]
- 85. LC-MS/MS-Based Diagnostics Market Trends and ... [https://finance.yahoo.com/news/lc-ms-ms-based-diagnostics-120000999.html]