Hypogonadal and Hypergonadal Models: Decoding Oral Contraceptive Effects on the HPG Axis for Drug Development
This article provides a comprehensive analysis for researchers and drug development professionals on the application of hypogonadal and hypergonadal models to elucidate the effects of oral contraceptives (OCs).
Hypogonadal and Hypergonadal Models: Decoding Oral Contraceptive Effects on the HPG Axis for Drug Development
Abstract
This article provides a comprehensive analysis for researchers and drug development professionals on the application of hypogonadal and hypergonadal models to elucidate the effects of oral contraceptives (OCs). We explore the foundational science, from the structural impact of OCs on the hypothalamus and pituitary to the mechanistic suppression of the hypothalamic-pituitary-gonadal (HPG) axis. The piece delves into advanced methodological applications, including mathematical modeling for dose optimization and the translation of these principles to male contraceptive development. It further addresses critical challenges in the field, such as accounting for inter-individual variability and validating self-reported data in research. Finally, we present a comparative analysis of model validation techniques and the assessment of hormonal contraceptives beyond ovulation suppression. This synthesis aims to bridge theoretical models with practical clinical application, offering a roadmap for future innovation in contraceptive technology.
The HPG Axis Under Suppression: Foundational Mechanisms of Oral Contraceptives
This guide provides a comparative analysis of hypogonadal and hypergonadal models in contraception research, examining their distinct physiological mechanisms, experimental efficacy data, and applications in drug development. Hypogonadal states are characterized by suppressed gonadotropin-releasing hormone (GnRH) and consequent reduction in luteinizing hormone (LH) and follicle-stimulating hormone (FSH), leading to inhibited spermatogenesis or ovulation. Hypergonadal models typically involve functional gonads with disrupted regulatory feedback mechanisms. We synthesize findings from key clinical trials and experimental protocols, presenting quantitative efficacy data in structured tables and detailing essential methodological approaches. This resource aims to support researchers and pharmaceutical developers in navigating the complex landscape of contraceptive models and their translational applications.
Physiological Foundations and Signaling Pathways
The Hypothalamic-Pituitary-Gonadal (HPG) Axis
The hypothalamic-pituitary-gonadal (HPG) axis regulates reproductive function through a tightly coordinated feedback system. In normal physiological conditions, the hypothalamus secretes gonadotropin-releasing hormone (GnRH) in pulses, which stimulates the anterior pituitary to release follicle-stimulating hormone (FSH) and luteinizing hormone (LH). FSH acts on Sertoli cells in males and ovarian follicles in females to support gametogenesis, while LH stimulates Leydig cells in males and theca cells in females to produce testosterone and other sex steroids. These sex steroids, including testosterone and estradiol, subsequently provide negative feedback to the hypothalamus and pituitary to maintain hormonal balance [1] [2].
Hypogonadal Models in Contraception
Hypogonadal states feature suppressed GnRH secretion or action, resulting in low levels of LH and FSH, which in turn leads to reduced gonadal sex steroid production and impaired gametogenesis. In male hormonal contraception, this is achieved through administration of exogenous testosterone, often combined with a progestin. The exogenous testosterone provides negative feedback on the hypothalamus and pituitary, suppressing endogenous GnRH and gonadotropin secretion. This dramatically reduces intratesticular testosterone levels—by up to 94% with testosterone monotherapy—which is essential for spermatogenesis, thereby inducing a contraceptive state of azoospermia (zero sperm count) or severe oligozoospermia (sperm count <1 million/mL) [1] [3]. In females, combined oral contraceptives (COCs) containing ethinyl estradiol and a progestin suppress the HPG axis, inhibiting the mid-cycle LH surge and preventing ovulation. Different progestins exhibit varying degrees of gonadotropin suppression; for instance, COCs containing cyproterone acetate demonstrate more significant suppression of FSH and LH compared to those containing drospirenone or desogestrel [4].
Hypergonadal Models in Research
In contrast to the suppressed axis in hypogonadal models, research on oral contraceptive effects sometimes references a hypergonadal model, particularly a hypothesized hyperprogestogenic state in the brain. Despite overall systemic reduction of endogenous steroid hormones with oral contraceptive use, some resting-state functional connectivity studies suggest that the brain may experience a high-progesterone environment. This model proposes that oral contraceptives may mimic the connectivity patterns observed in the high-progesterone luteal phase of the natural menstrual cycle, potentially increasing prefrontal connectivity and decreasing parietal connectivity [5]. This represents a unique disconnect between systemic hormone levels and central nervous system effects.
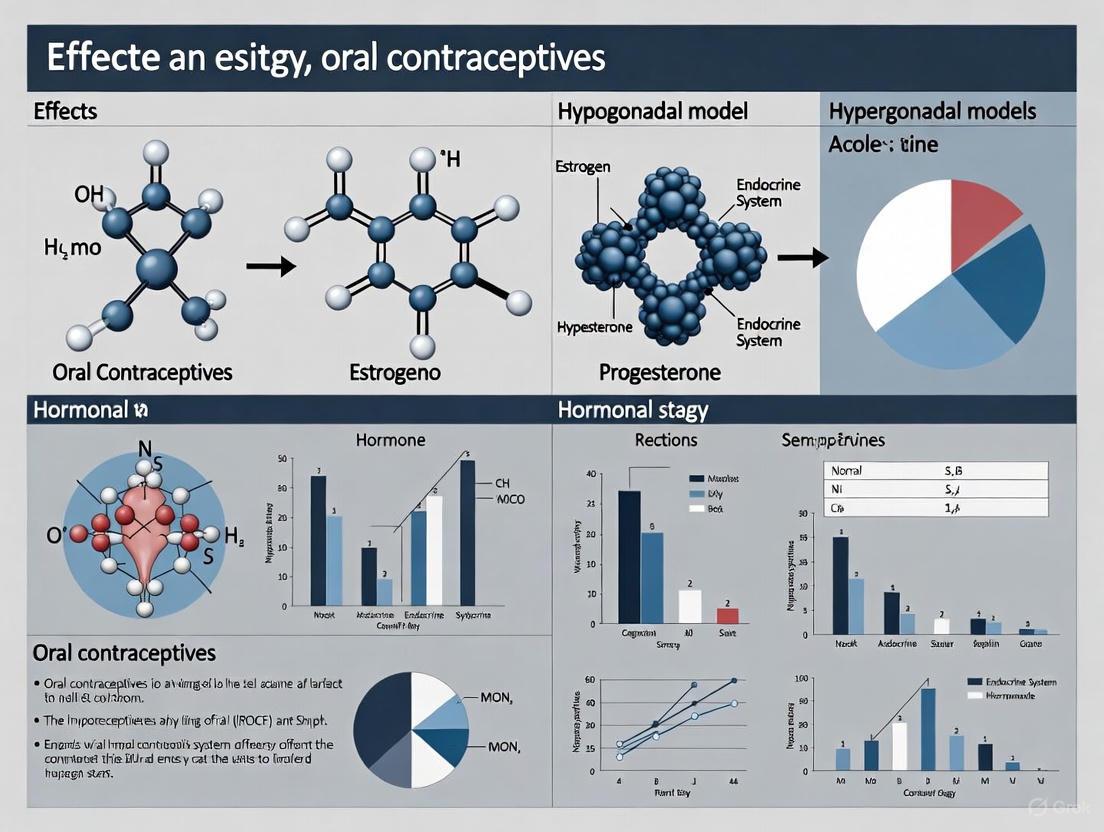
The following diagram illustrates the comparative physiological pathways of normal, hypogonadal, and hypergonadal states:
Comparative Efficacy Data in Contraceptive Development
Male Hormonal Contraception Clinical Trials
Male hormonal contraception primarily utilizes hypogonadal models to achieve contraceptive efficacy. The following table summarizes key efficacy outcomes from landmark clinical trials:
Table 1: Efficacy of Male Hormonal Contraceptive Regimens in Clinical Trials
| Study Formulation | Androgen Component | Progestin Component | Target Sperm Threshold | Subjects Achieving Target (%) | Pregnancies During Efficacy Phase | Failure Rate (Pearl Index) |
|---|---|---|---|---|---|---|
| Testosterone only [3] | Testosterone Enanthate 200 mg/week | None | Azoospermia (0 million/mL) | 157/225 (69.8%) | 1 | 0.8 |
| Testosterone only [3] | Testosterone Enanthate 200 mg/week | None | <3 million/mL | 349/357 (97.8%) | 4 | 1.4 |
| T+Progestin [3] | Testosterone Implants | Depot Medroxyprogesterone Acetate | <1 million/mL | 53/55 (94%) | 0 | - |
| T+Progestin [3] | Testosterone Undecanoate | Norethisterone Enanthate | <1 million/mL | 274/283 (95.9%) | 4 | 2.2 |
The data demonstrate that combination regimens (androgen plus progestin) achieve target sperm suppression thresholds in >94% of participants, with contraceptive efficacy comparable to many female-directed methods when severe oligozoospermia (<1 million/mL) is achieved [3]. The addition of a progestin enhances the speed and degree of sperm suppression compared to testosterone alone [6].
Female Contraception and Hypogonadal Effects
In females, combined oral contraceptives (COCs) create a hypogonadal state through suppression of the HPG axis. Different progestin types exhibit varying degrees of gonadotropin suppression:
Table 2: Gonadotropin Suppression by Combined Oral Contraceptives in PCOS Patients (Meta-Analysis Data) [4]
| Progestin Type | Treatment Duration | FSH Reduction (WMD) | LH Reduction (WMD) | Estradiol Impact |
|---|---|---|---|---|
| Cyproterone Acetate | 3 months | -0.48 (-0.81 to -0.15) | -3.57 (-5.14 to -1.99) | Significant decrease |
| Cyproterone Acetate | 6 months | -2.33 (-3.48 to -1.18) | -5.68 (-9.57 to -1.80) | Significant decrease |
| Cyproterone Acetate | 12 months | -4.70 (-4.98 to -4.42) | -11.60 (-17.60 to -5.60) | Significant decrease |
| Drospirenone | 6 months | -0.93 (-1.79 to -0.08) | -4.59 (-7.53 to -1.66) | No significant effect |
COCs containing cyproterone acetate demonstrated the most pronounced suppression of gonadotropins in a time-dependent manner, with FSH suppression increasing from -0.48 at 3 months to -4.70 at 12 months [4]. All COCs improved androgenic profiles, with similar effects on total testosterone and sex hormone-binding globulin regardless of progestin type.
Experimental Protocols and Methodologies
Male Contraceptive Efficacy Trial Design
Phase 2b efficacy trials for male hormonal contraceptives employ specific methodological approaches to demonstrate contraceptive effectiveness:
- Study Population: Healthy, fertile men with normal baseline semen analysis (sperm concentration >15 million/mL) [3]
- Suppression Phase: Typically 12-20 weeks of treatment to achieve sperm suppression threshold
- Efficacy Phase: Couples rely solely on the investigational regimen for contraception for 12 months
- Sperm Monitoring: Regular semen analyses during efficacy period (usually every 4-6 weeks) to confirm maintained suppression
- Threshold Criteria: Historically, azoospermia (zero sperm) was required, but later studies used <1 million/mL or <3 million/mL thresholds with comparable efficacy [3] [6]
- Recovery Phase: Monitoring of spermatogenesis return after discontinuation, typically within 4-12 weeks [3]
These trials face unique challenges, including the need to minimize pregnancy risk during the efficacy phase while generating valid typical-use pregnancy rate data necessary for regulatory approval [3].
Hypogonadal State Reversal Protocols
Research on reversing hypogonadal states to restore fertility has yielded specific therapeutic protocols:
Human Chorionic Gonadotropin (hCG) Therapy: In men who develop infertility due to testosterone supplementation therapy, hCG can reverse azoospermia. A randomized controlled trial demonstrated that low-dose hCG (125-500 IU every other day) maintained intratesticular testosterone levels despite concurrent testosterone enanthate administration (200 mg/week). While intratesticular testosterone was suppressed by 94% in the placebo group, the 500 IU hCG group showed a 26% increase from baseline [1].
Combined hCG and SERM Protocol: For hypogonadal men requiring testosterone supplementation but wishing to maintain fertility, concomitant low-dose hCG (e.g., 500 IU every other day) with selective estrogen receptor modulators (SERMs) like clomiphene can maintain spermatogenesis. A retrospective study of 26 hypogonadal men receiving TST with hCG showed no significant deterioration in semen parameters during one year of follow-up, with no participants becoming azoospermic [1].
Female Hypogonadism and Fertility Treatment
Women with hypogonadotropic hypogonadism (HH) require specialized protocols for ovulation induction and assisted reproduction:
- Pretreatment: Often includes 2 months of combined oral contraceptives for endometrial regeneration and cycle regulation prior to stimulation [7]
- Stimulation Protocol: Gonadotropin initiation (typically 150-225 IU of human menopausal gonadotropin) starting on day 2 of withdrawal bleeding [7]
- Monitoring: Follicular tracking until at least 3 mature follicles are observed
- Triggering: Human chorionic gonadotropin (10,000 IU IM) administered when follicles reach maturity [7]
- Luteal Support: Vaginal progesterone gel (8%) continued for 2 weeks until pregnancy confirmation, then through first trimester
In one case series, this protocol resulted in a pregnancy rate of 31.6% and live birth rate of 21% in women with congenital HH [7].
The Scientist's Toolkit: Essential Research Reagents
Table 3: Key Reagents for Hypogonadal/Hypergonadal Contraception Research
| Reagent / Solution | Research Application | Experimental Function |
|---|---|---|
| Testosterone Enanthate | Male contraceptive trials | Suppresses HPG axis via negative feedback on hypothalamus/pituitary |
| Human Chorionic Gonadotropin (hCG) | Fertility restoration studies | Mimics LH activity; stimulates intratesticular testosterone production |
| Selective Estrogen Receptor Modulators (SERMs) | Hypogonadal male fertility preservation | Antagonizes estrogen negative feedback on hypothalamus in males |
| GnRH Agonists/Antagonists | Experimental hypogonadal models | Directly modulates GnRH receptor activity to suppress/control HPG axis |
| Various Progestins | Male and female contraceptive development | Enhances suppression of gonadotropins when combined with androgens |
| Human Menopausal Gonadotropin (hMG) | Female HH fertility protocols | Provides both FSH and LH activity for ovulation induction |
| Recombinant FSH and LH | Controlled ovarian stimulation | Enables precise dosing of individual gonadotropins in fertility research |
Research Implications and Future Directions
The investigation of hypogonadal and hypergonadal models continues to inform contraceptive development across several frontiers:
Novel Androgen Development: Next-generation androgens like dimethandrolone and 11β-methyl-19-nortestosterone are being evaluated as single-agent male contraceptives that may provide both androgen replacement and reliable spermatogenesis suppression with improved safety profiles [6].
Natural Estrogen Formulations: Recent female contraceptive development has shifted toward natural compounds like estradiol (E2) and estradiol valerate (E2V) combined with newer progestins to potentially decrease thrombotic risk while maintaining contraceptive efficacy [8].
Dual-Purpose Technologies: Emerging research focuses on combining contraception with antiretroviral agents for dual protection against pregnancy and sexually transmitted infections, particularly in vaginal ring delivery systems [8].
Neuroendocrine Effects: The hypergonadal model of oral contraceptive effects on brain function represents an emerging research frontier, with neuroimaging studies suggesting that synthetic hormones may alter resting-state functional connectivity in patterns resembling high-progesterone states [5].
The progression of these investigative fronts relies on continued refinement of hypogonadal and hypergonadal models, standardized measurement of contraceptive-induced changes [9], and innovative trial designs that can effectively translate preclinical findings into clinically available methods addressing significant unmet needs in reproductive health.
Within the broader investigation of hypogonadal and hypergonadal models in endocrine research, the impact of synthetic hormones on central nervous system structures represents a critical area of study. The hypothalamic-pituitary-gonadal (HPG) axis serves as the master regulator of reproductive function, and its structural plasticity in response to pharmacological interventions remains incompletely characterized. This review synthesizes current evidence regarding the structural effects of oral contraceptives (OCs) on hypothalamic and pituitary volume, focusing on quantitative magnetic resonance imaging (MRI) findings and their implications for understanding the fundamental mechanisms of OC action on the human brain. While direct evidence for hypothalamic volume changes is currently limited in the available literature, emerging data suggests that oral contraceptive use is associated with measurable reductions in pituitary gland volume, providing a structural correlate to the well-established functional suppression of the HPG axis [10].
The pituitary gland, as a central component of multiple neuroendocrine axes, exhibits structural plasticity in response to various physiological and pharmacological challenges. Research across psychiatric disorders has consistently demonstrated that pituitary volume alterations occur in conditions characterized by hypothalamic-pituitary-adrenal (HPA) axis dysregulation [11] [12] [13]. These findings establish a precedent for investigating structural adaptations in endocrine organs in response to hormonal manipulations, including oral contraceptive administration.
Quantitative Evidence of Oral Contraceptive Effects on Pituitary Volume
Table 1: Documented Effects of Oral Contraceptives on Pituitary Gland Volume (PGV)
| Study Population | Sample Characteristics | PGV Findings | Reported Effect Size | Contextual Notes |
|---|---|---|---|---|
| Female Adolescents & Adults [10] | Population-based cohort | Smaller PGV in OC users | Not specified | Association observed after controlling for confounders |
| General Population Adults [10] | SHIP-TREND-0 cohort (N=1868) | Smaller PGV in OC users | Not specified | Association independent of other factors |
Table 2: Comparative Pituitary Volumes Across Neuroendocrine Conditions
| Condition | Population | Pituitary Volume (mm³) | Difference from Controls | Citation |
|---|---|---|---|---|
| Social Anxiety Disorder | Patients: n=21 | 594.10 ± 104.56 | Significant reduction (p<0.001) | [11] |
| Controls: n=20 | 818.01 ± 215.25 | |||
| Delusional Disorder | Patients: n=18 | 532.11 ± 125.65 | Significant reduction (p<0.01) | [13] |
| Controls: n=18 | 777.22 ± 241.28 | |||
| Drug-Naïve OCD (Males) | Patients: n=12 | 464.97 ± 55.82 | Significant reduction (p=0.027) | [14] |
| Controls: n=62 | 543.04 ± 113.70 | |||
| Medicated OCD (Males) | Patients: n=50 | 577.84 ± 129.11 | Not significant (p=0.174) | [14] |
The consistent observation of reduced pituitary volume across multiple conditions suggests a common pathway of structural adaptation to various forms of physiological stress, including hormonal manipulation. In the specific context of oral contraceptives, this structural change likely reflects functional suppression of the HPG axis, analogous to the structural adaptations observed in psychiatric conditions associated with HPA axis dysregulation [11] [10].
Methodological Considerations in Pituitary Volumetry
The measurement of pituitary volume employs standardized neuroimaging protocols with high-resolution structural MRI. The typical methodology involves:
Image Acquisition: T1-weighted volumetric sequences are acquired in the sagittal plane using 1.5T or 3T MRI scanners with slice thickness ranging from 1-1.5 mm [11] [13]. Parameters typically include: TE=15.6 ms, TR=14.4-2000 ms, flip angle=20°, FOV=240 mm, and matrix size=256×256.
Volume Measurement: Manual tracing is performed by blinded raters using advanced workstations with volumetric software (e.g., GE Volume Viewer Vox tool 4.6) [11] [13]. The superior boundary is defined by the optic chiasm and infundibular recess of the third ventricle, while the inferior boundary is identified as the sphenoid sinus.
Reliability and Quality Control: Established neuroanatomical atlases guide the tracing procedures [11]. Interrater reliability is typically excellent, with intraclass correlation coefficients reported as r=0.90 for pituitary measurements [11]. Repeated measurements show mean differences of approximately 0.2% with SD of 7.7% [10].
Statistical Control: Analyses routinely control for potential confounders including age, sex, and total brain volume using analysis of covariance (ANCOVA) [11] [13]. Additional covariates may include education, handedness, and medication status.
Diagram Title: HPG Suppression and Pituitary Volume Reduction Pathway
Neuroendocrine Mechanisms and Functional Correlates
HPG Axis Suppression by Oral Contraceptives
Oral contraceptives exert their effects through potent suppression of the hypothalamic-pituitary-gonadal axis, primarily via negative feedback mechanisms:
Gonadotropin Suppression: Combined oral contraceptives containing progestins with low androgenic and antiandrogenic activities (e.g., cyproterone acetate, desogestrel, drospirenone) significantly suppress gonadotropin levels. Products containing cyproterone acetate demonstrate the most pronounced effect, reducing FSH levels after 3 months (WMD=-0.48; 95% CI -0.81 to -0.15), 6 months (WMD=-2.33; 95% CI -3.48 to -1.18), and 12 months (WMD=-4.70; 95% CI -4.98 to -4.42) [15].
LH Reduction: Luteinizing hormone shows even greater suppression with cyproterone acetate-containing COCs, with reductions observed after 3 months (WMD=-3.57; 95% CI -5.14 to -1.99), 6 months (WMD=-5.68; 95% CI -9.57 to -1.80), and 12 months (WMD=-11.60; 95% CI -17.60 to -5.60) [15].
Androgenic Profile Improvement: All COC formulations improve biochemical hyperandrogenism in PCOS patients through increased sex hormone-binding globulin (SHBG) and reduced total testosterone, independent of the specific progestin compound or treatment duration [15].
The structural adaptations observed in pituitary volume likely reflect this functional suppression, representing a morphological correlate of reduced secretory activity and cellular hypertrophy in anterior pituitary gonadotrophs.
Integration with Stress Response Systems
Emerging evidence suggests complex interactions between OC-mediated HPG suppression and stress response systems:
HPA Axis Modulation: Oral contraceptives may mimic stress effects on the HPA axis [10], potentially contributing to the observed structural changes. Larger pituitary volumes have been associated with more severe psychopathological symptoms in participants reporting early life stress [10].
Cortisol Interactions: The relationship between pituitary volume and serum cortisol concentrations is moderated by depressive symptoms, with larger pituitary volumes associated with lower serum cortisol concentrations in participants with more severe depressive symptoms (Meta-analysis: β=-0.063; 95% CI -0.095 to -0.032, p=8.39e-05) [10].
The Scientist's Toolkit: Research Reagent Solutions
Table 3: Essential Reagents and Materials for Pituitary Volumetry and Hormonal Assessment
| Research Tool | Specific Application | Function/Utility | Example Parameters |
|---|---|---|---|
| 1.5T/3T MRI Scanner | Pituitary volumetry | High-resolution structural imaging | Slice thickness: 1-1.5mm; TE: 15.6ms; TR: 14.4-2000ms [11] |
| Manual Tracing Software | Pituitary boundary delineation | Volumetric measurement | GE Volume Viewer Vox tool 4.6 [11] [13] |
| Standard Neuroanatomical Atlas | Anatomical reference | Boundary definition guidance | Established protocols [11] |
| Salivette Sampling Device | Cortisol awakening response | Salivary cortisol collection | Samples at 0, 30, 60min post-awakening [12] [16] |
| Immunoassay Analyzer Systems | Hormonal quantification | Cortisol, gonadotropin measurement | Immulite system for cortisol [16] |
| Structured Clinical Interviews | Participant characterization | Diagnostic confirmation | SCID for DSM-IV/5 [11] [13] |
Diagram Title: Experimental Workflow for Pituitary Volume Studies
Discussion and Future Research Directions
The documented association between oral contraceptive use and reduced pituitary volume provides compelling structural evidence for the profound effects of synthetic hormones on central regulatory organs. This finding aligns with the well-established functional suppression of the HPG axis and represents a significant advancement in understanding the neuroendocrine adaptations to hormonal contraception.
Several mechanistic hypotheses may explain this structural observation:
Reduced Functional Demand: The suppression of gonadotropin secretion likely diminishes the metabolic and biosynthetic activity of pituitary gonadotrophs, potentially leading to cellular atrophy and reduced tissue volume.
Cellular Composition Changes: Altered pituitary volume may reflect shifts in the relative proportions of different endocrine cell types within the anterior pituitary, particularly relative reductions in gonadotroph populations.
Neuroendocrine Plasticity: The pituitary gland demonstrates remarkable structural plasticity throughout life, responding to physiological states such as puberty, pregnancy, and pharmacological interventions with volume changes that reflect functional adaptations.
Future research should prioritize longitudinal studies examining pituitary volume changes before and after OC initiation, direct comparisons between different OC formulations, and investigation of potential recovery following discontinuation. Additionally, the development of advanced neuroimaging techniques capable of resolving hypothalamic substructures will be essential for completing our understanding of OC effects throughout the HPG axis.
The integration of structural neuroimaging with detailed endocrine profiling represents a powerful approach for elucidating the complex interactions between synthetic hormones and central regulatory systems. This research has significant implications for understanding the broader physiological effects of hormonal contraception and informs both clinical practice and pharmaceutical development in the field of reproductive endocrinology.
The pulsatile secretion of gonadotropin-releasing hormone (GnRH) from the hypothalamus serves as the fundamental regulator of the hypothalamic-pituitary-gonadal (HPG) axis. This rhythmic release is essential for normal reproductive function, including gonadotropin secretion, steroidogenesis, and spermatogenesis. Synthetic hormones, employed in contexts ranging from contraception to hormone replacement therapy, exert their effects primarily by disrupting this precise pulsatile pattern. This review synthesizes current evidence on the mechanisms by which various synthetic steroids—including androgens, progestins, and estrogen-progestin combinations—alter GnRH pulsatility, leading to suppression of the HPG axis. We provide a comparative analysis of experimental data and detailed methodologies used in both clinical and preclinical studies to investigate these disruptive effects, offering a resource for researchers and drug development professionals working within hypogonadal and hypergonadal models.
The hypothalamic-pituitary-gonadal (HPG) axis is a classic neuroendocrine system governing reproduction. At its apex, GnRH neurons in the hypothalamus release GnRH in a pulsatile manner into the hypophyseal portal circulation [17]. This pulsatile signal is critical for the proper function of the anterior pituitary; continuous GnRH administration, in contrast, leads to desensitization of gonadotropin-releasing hormone receptors (GnRHRs) and suppression of gonadotropin release [18]. Upon receiving pulsatile GnRH signals, pituitary gonadotrope cells synthesize and secrete the gonadotropins luteinizing hormone (LH) and follicle-stimulating hormone (FSH) [3] [19]. These hormones then act on the gonads: in the testes, LH stimulates Leydig cells to produce testosterone, while FSH, in synergy with testosterone, supports Sertoli cell function and spermatogenesis [3] [20]. The system is regulated via negative feedback, where gonadal steroids (testosterone, estradiol) and peptides (inhibin) act at the hypothalamus and pituitary to inhibit gonadotropin secretion, maintaining hormonal homeostasis [3].
Mechanisms of Action: How Synthetic Hormones Disrupt GnRH Pulses
Synthetic hormones disrupt the HPG axis by exploiting its inherent negative feedback mechanisms. The primary site of action is the suppression of the hypothalamic GnRH pulse generator, which in turn leads to diminished pituitary gonadotropin secretion and consequent suppression of gonadal function.
Androgens and Progestins in Male Hormonal Contraception
Hormonal male contraception (HMC) typically uses exogenous androgens, often combined with a progestin [3] [19]. The androgen component (e.g., testosterone undecanoate) provides negative feedback at the hypothalamus and pituitary, suppressing the release of endogenous GnRH, LH, and FSH [19]. This suppression drastically reduces the high intra-testicular testosterone concentration essential for spermatogenesis, leading to azoospermia or severe oligozoospermia [3] [19]. The addition of a progestin (e.g., nestorone, depot medroxyprogesterone acetate) enhances the suppression of gonadotropins, allowing for more rapid and profound suppression of sperm production and enabling the use of lower doses of androgens [3]. The exogenous androgen maintains peripheral androgenicity, preventing symptoms of hypogonadism despite the shutdown of the testes [3].
Synthetic Estrogens and Progestins in Female Oral Contraceptives
Combined oral contraceptives (COCs) contain synthetic forms of estradiol (e.g., ethinyl estradiol) and various progestins [21]. These synthetic steroids potently suppress the production and release of GnRH from the hypothalamus [21]. The inhibition of the GnRH pulse generator prevents the mid-cycle LH surge, thereby inhibiting ovulation [21]. Additionally, progestins thicken cervical mucus, creating a barrier to sperm penetration [21]. Beyond their reproductive effects, these synthetic hormones bind to steroid receptors widely distributed in the brain, including estrogen receptors (ER-α, ER-β) and progestin receptors (PRα, PRβ) in regions like the hippocampus, prefrontal cortex, and amygdala, which may underlie reported effects on brain structure and mood [21].
Post-Androgen Abuse and Hypogonadotropic Hypogonadism
Androgen abuse, particularly with anabolic-androgenic steroids, can lead to a prolonged state of hypogonadotropic hypogonadism after cessation, a condition recently proposed to be termed Prolonged Post-Androgen Abuse Hypogonadism (PPAAH) [20]. Supraphysiological levels of androgens exert potent negative feedback, profoundly suppressing the HPG axis. Potential mechanisms for the prolonged suppression include persistent alterations at the hypothalamic and/or pituitary levels, possibly involving the kisspeptin-neurokinin B-dynorphin (KNDy) neuronal network, which is crucial for GnRH pulse generation [20]. There may also be testicular changes, including impaired Leydig cell function, as evidenced by persistently low levels of insulin-like factor 3 (INSL3) even years after discontinuation [20].
Table 1: Key Synthetic Hormone Classes and Their Primary Mechanisms in Disrupting GnRH Pulsatility
| Synthetic Hormone Class | Primary Target | Effect on GnRH Pulses | Downstream Consequence |
|---|---|---|---|
| Androgens (e.g., Testosterone esters) [3] [19] | Hypothalamus, Pituitary | Suppresses pulsatile secretion | Reduced LH/FSH, suppressed spermatogenesis |
| Androgen-Progestin Combinations [3] | Hypothalamus, Pituitary | Enhanced suppression of pulsatility | Profound and rapid sperm suppression |
| Combined Oral Contraceptives [21] | Hypothalamus | Suppresses pulsatile secretion, prevents LH surge | Inhibition of ovulation |
| Progestin-Only Formulations [21] | Hypothalamus, Cervix | Suppresses pulsatility, thickens cervical mucus | Ovulation inhibition, barrier to sperm |
Comparative Experimental Data and Protocols
Research on synthetic hormone disruption of the HPG axis spans clinical trials, endocrine studies, and neurobiological investigation. The data below highlight the efficacy and endocrine effects of different approaches.
Efficacy Trials in Male Hormonal Contraception
Clinical trials for male hormonal contraceptives have established that suppression of sperm production to a level below 1 million sperm/mL is a key threshold for effective contraception [3]. The following table summarizes results from pivotal efficacy trials.
Table 2: Summary of Selected Male Hormonal Contraceptive Efficacy Trials [3]
| Study (Reference) | Regimen | Sperm Threshold for Efficacy | Men Reaching Threshold (%) | Pregnancies (Failure Rate per 100 cy) |
|---|---|---|---|---|
| WHO 1990 [3] | Testosterone Enanthate (TE) 200 mg/week | Azoospermia (0 million/mL) | 69.8% | 1 (0.8) |
| WHO 1996 [3] | TE 200 mg/week | <3 million/mL | 97.8% | 4 (1.4) |
| Gu et al. (2009) [3] | Testosterone Undecanoate (TU) load + 500 mg/month | <1 million/mL | 95.2% | 9 (1.1) |
| Behre et al. (2014) [3] | TU 1000 mg + NETE 200 mg/8 weeks | <1 million/mL | 95.9% | 4 (2.2) |
Endocrine Profiles in Female Hormonal Contraceptive Users
Hormonal contraceptives significantly alter the broader endocrine milieu beyond the HPG axis. A review of research on basal and reactive hormone levels reveals distinct patterns.
Table 3: Hormonal Contraceptive Effects on Androgen and Cortisol Profiles [22]
| Hormone | Effect of Hormonal Contraceptive Use (vs. Naturally Cycling) | Notes on Formulation and Reactivity |
|---|---|---|
| Testosterone (Total & Free) | Significantly Reduced | Observed with oral contraceptive pills (OCPs). |
| DHEAS | Significantly Reduced | A marker of adrenal androgen production. |
| Cortisol (Total, in blood) | Increased | |
| Salivary Cortisol Reactivity | Blunted response to social stressors | Suggests an altered hypothalamic-pituitary-adrenal (HPA) axis stress response. |
Detailed Experimental Protocols
To facilitate replication and critical evaluation, this section outlines standard protocols used in key studies investigating GnRH pulsatility disruption.
Protocol for a Male Hormonal Contraceptive Efficacy Trial
Phase 2b efficacy trials for male hormonal contraceptives follow a rigorous design to assess both suppression of spermatogenesis and contraceptive efficacy [3].
- Participant Recruitment: Healthy, fertile male volunteers in stable, monogamous relationships with female partners of child-bearing potential are recruited.
- Lead-in/Run-in Phase: Participants are monitored to establish baseline semen and hormone parameters.
- Suppression Phase: Administration of the investigational drug (e.g., Nestorone-testosterone gel, injectable testosterone + progestin) for a predetermined period (e.g., 12-20 weeks) to suppress spermatogenesis.
- Efficacy Phase: Couples use the investigational method as their sole form of contraception for 12 months once the male partner's sperm concentration is confirmed to be below the predefined threshold (e.g., <1 million/mL). Semen analyses are performed regularly during this phase to monitor suppression.
- Recovery Phase: Cessation of treatment with regular follow-up until sperm concentration returns to the normal fertile range.
- Primary Endpoints: The proportion of men achieving severe oligospermia/azoospermia during suppression, and the pregnancy rate (Pearl Index) during the efficacy phase.
Protocol for Assessing Hormonal Contraceptive Effects on Stress Reactivity
This protocol is designed to investigate the interaction between the HPG and HPA axes in hormonal contraceptive users [22].
- Participant Groups: Two groups of healthy female participants: current users of combined oral contraceptives (OCs) and naturally cycling (NC) controls. Groups are matched for age, BMI, and other relevant factors.
- Hormone Sampling:
- Basal Levels: Fasting blood samples are collected to measure basal total testosterone, free testosterone, DHEAS, and cortisol (total and free). Saliva samples may also be collected for cortisol and testosterone.
- Reactive Levels: Participants undergo a standardized psychosocial stress test, such as the Trier Social Stress Test (TSST). Saliva samples are collected at baseline, immediately post-stress, and at several time points during a recovery period to map the cortisol and testosterone response curve.
- Data Analysis: Basal hormone levels are compared between OC users and NC controls using ANCOVA, controlling for potential confounders. The cortisol and testosterone reactivity trajectories are compared using repeated-measures ANOVA to assess group differences in stress reactivity and recovery.
Signaling Pathways and Experimental Workflows
Normal vs. Suppressed HPG Axis Signaling
The following diagram contrasts the normal physiological state of the HPG axis with its state under suppression by synthetic hormones, illustrating the primary sites of negative feedback.
Experimental Workflow for a Male Contraceptive Trial
This flowchart outlines the sequential stages of a clinical trial for a male hormonal contraceptive, from recruitment to recovery.
The Scientist's Toolkit: Key Research Reagents and Materials
This table catalogs essential reagents and their applications for studying GnRH pulsatility and its disruption. Table 4: Key Research Reagent Solutions for HPG Axis Studies
| Reagent / Material | Primary Function in Research | Example Application |
|---|---|---|
| Gonadorelin Acetate | Synthetic GnRH agonist used for stimulation tests to assess pituitary responsiveness [18]. | GnRH stimulation test in diagnosing hypogonadotropic hypogonadism [18]. |
| Testosterone Esters (e.g., Enanthate, Undecanoate) | Provide exogenous androgen for negative feedback studies and contraceptive trials [3] [19]. | Investigational drug in male hormonal contraceptive efficacy trials [3]. |
| Synthetic Progestins (e.g., Nestorone, DMPA, Levonorgestrel) | Enhance suppression of gonadotropins in combination with androgens or in female contraceptives [3] [21]. | Component of combined male and female hormonal contraceptive regimens [3] [21]. |
| Human Chorionic Gonadotropin (hCG) | LH analog used to stimulate Leydig cells and test testicular function [20]. | hCG stimulation test to evaluate Leydig cell capacity in former androgen abusers [20]. |
| Pulsatile GnRH Pump | Mimics physiological GnRH secretion to restore the HPG axis in deficiency states [18] [17]. | Treatment for congenital hypogonadotropic hypogonadism (CHH) to induce puberty and fertility [18]. |
| Kisspeptin / Neurokinin B (NKB) | Key neuropeptides regulating GnRH pulsatility; used as research tools to probe KNDy network function [20] [23]. | Central administration to study gonadotropin response; investigation of their role in post-androgen abuse hypogonadism and menopause [20] [23]. |
| Immunoassays for LH/FSH/Testosterone | Precisely measure hormone levels in serum/plasma to assess HPG axis status [3] [22] [18]. | Standard endpoint in all clinical trials and endocrine studies evaluating HPG axis function and suppression. |
The hypothalamic-pituitary-gonadal (HPG) axis serves as the master regulatory system for reproduction, making it a primary target for therapeutic gonadotropin suppression and ovulation inhibition. This axis is hierarchically organized: the hypothalamus releases pulsatile gonadotropin-releasing hormone (GnRH), which stimulates the anterior pituitary to secrete luteinizing hormone (LH) and follicle-stimulating hormone (FSH), which in turn regulate gonadal function, including steroid hormone production and gamete maturation [24]. The pivotal role of GnRH pulsatility is well-established; its frequency and amplitude directly determine the secretion patterns of both LH and FSH [24] [25]. Pharmacologic intervention in this axis is foundational for multiple clinical applications, including contraception, the treatment of steroid-dependent conditions, and the management of infertility. Research in this field is largely framed within hypogonadal (low hormone state) and hypergonadal (high hormone state) models to understand the effects of interventions like oral contraceptives and other suppressing agents [5]. This guide objectively compares the mechanisms and experimental data for key pharmacologic strategies that target this neuroendocrine system.
Core Neuroendocrine Signaling Pathways and Pharmacologic Intervention Sites
The following diagram illustrates the fundamental signaling pathways of the HPG axis and the key sites where pharmacologic agents exert their suppressive effects.
Comparative Analysis of Gonadotropin-Suppressing Modalities
The suppression of the HPG axis can be achieved through distinct pharmacologic mechanisms, primarily GnRH receptor antagonism and steroidal negative feedback. The table below provides a structured comparison of these modalities based on key experimental data.
Table 1: Comparative Experimental Data for Gonadotropin Suppression Modalities
| Parameter | GnRH Antagonism (Relugolix CT) | GnRH Antagonism (Nal-Glu) | Oral Contraceptive Pills (OCPs) |
|---|---|---|---|
| Primary Mechanism | Direct competitive blockade of GnRH receptors [26] | Direct competitive blockade of GnRH receptors [27] | Suppression of hypothalamic GnRH pulse generator via exogenous steroid negative feedback [28] [5] |
| Therapeutic Context | Treatment of uterine fibroids, endometriosis; ovulation inhibition [26] | Investigational male contraceptive [27] | Female contraception [28] [5] |
| Effect on LH | Suppression to low concentrations; abolition of preovulatory surge [26] | Marked suppression to a mean of 1.5 IU/L [27] | General reduction, pattern dependent on progestin type [5] |
| Effect on FSH | Suppression to low concentrations [26] | Suppression to assay detection limit (1 IU/L) [27] | General reduction [5] |
| Effect on Ovulation | Inhibited in 100% of subjects (67/67) [26] | Not applicable (male study) | Primary intended effect |
| Effect on Testosterone | Not applicable (female study) | Suppression to castrate range (<2 nmol/L) [27] | Not applicable (female study) |
| Key Experimental Endpoint | Proportion of women with inhibited ovulation over 84 days [26] | Steady-state suppression of LH, FSH, and T over 21 days [27] | Structural brain changes (e.g., hypothalamic volume) and functional connectivity [28] [5] |
| Time to Post-Treatment Recovery | Mean time to return to ovulation: 23.5 days [26] | Return to baseline after cessation [27] | Variable; some structural effects may not be fully reversible [28] |
Detailed Experimental Protocols and Methodologies
Protocol: Assessing Ovulation Inhibition with a GnRH Antagonist (Relugolix Combination Therapy)
This protocol outlines the methodology for evaluating the efficacy of a GnRH antagonist in inhibiting ovulation in women, as demonstrated in a key clinical study [26].
- Study Design: Open-label, single-cohort, pharmacodynamic study.
- Participants: 70 healthy, premenopausal, ovulatory women (age 18–35).
- Treatment: Oral administration of Relugolix Combination Therapy (relugolix 40 mg, estradiol 1 mg, norethindrone acetate 0.5 mg) once daily for 84 days.
- Phases:
- Pretreatment: Confirmation of ovulatory status via transvaginal ultrasonography and serum hormone levels.
- Treatment (Three 28-day cycles): Continuous drug administration.
- Post-treatment: Monitoring of the return to ovulation after discontinuation.
- Primary Outcome Measure: The proportion of women in whom ovulation was inhibited during the 84-day treatment period.
- Secondary Outcome Measures:
- Ovarian follicular diameter (via transvaginal ultrasonography).
- Serum concentrations of LH, FSH, estradiol, and progesterone.
- Endometrial thickness.
- Time to return to ovulation after treatment discontinuation.
- Success Criterion: Progesterone concentrations remaining below 1.57 ng/mL (5 nmol/L), confirming anovulation [26].
Protocol: Gonadotropin and Testosterone Suppression in Men with a GnRH Antagonist (Nal-Glu)
This protocol details a dose-finding study for a GnRH antagonist in men, establishing its potential as a male contraceptive [27].
- Study Design: Dose-response study.
- Participants: Two groups of five normal men.
- Intervention: Daily subcutaneous injection of either 1.5 mg or 5.0 mg of the GnRH antagonist Nal-Glu for 21 days.
- Sampling: Frequent serum samples collected before, during, and after the treatment period.
- Primary Assays:
- Immunoreactive LH and FSH: Measured to assess gonadotropin suppression.
- Bioactive LH: Measured in the 5.0 mg group to confirm functional suppression.
- Testosterone (T): Measured to assess the downstream physiological impact.
- Pulsatility Analysis: LH pulse amplitude was analyzed on the final day of treatment.
- Efficacy Endpoint: Suppression of serum T to the castrate range (<2 nmol/L) with the 5.0 mg dose [27].
The Scientist's Toolkit: Essential Research Reagents and Materials
Successful research in gonadotropin suppression relies on a specific toolkit of reagents, assays, and model systems.
Table 2: Essential Reagents and Resources for HPG Axis Suppression Research
| Tool/Reagent | Primary Function/Application | Research Context |
|---|---|---|
| GnRH Antagonists (e.g., Relugolix, Nal-Glu, Cetrorelix) | To directly block the GnRH receptor, rapidly suppressing LH/FSH secretion without an initial flare-up effect. | Used in clinical and preclinical studies to create a hypogonadotropic state for contraception or treatment of steroid-hormone-dependent diseases [26] [27]. |
| Kisspeptin Agonists/Antagonists | To probe the role of KNDy (Kisspeptin-Neurokinin B-Dynorphin) neurons, which are integral to the GnRH pulse generator and a key site for steroid feedback [24] [25]. | Used in animal models to manipulate pulsatile GnRH secretion and understand the neurocircuitry of the HPG axis. |
| Specific Hormone Immunoassays (RIAs, ELISAs for LH, FSH, Estradiol, Progesterone, Testosterone, INSL3) | To quantitatively measure hormone levels in serum or plasma with high sensitivity and specificity. | Critical for endpoint analysis in all interventional studies to confirm biochemical efficacy (e.g., suppressed LH/FSH/T, maintained anovulatory P4) [29] [26] [27]. |
| Pulsatility Analysis Software (e.g., Cluster, Detect, PULSAR) | To identify and characterize the pulsatile pattern of LH secretion from frequently sampled data, serving as a surrogate for GnRH pulse generator activity [24]. | Used in human and large animal studies where direct measurement of hypothalamic GnRH is not feasible. |
| High-Resolution MRI | To perform volumetric and microstructural analysis of hypothalamic and pituitary regions in response to interventions like OCPs [28]. | Used in human studies to identify structural correlates of long-term hormonal suppression. |
The direct and immediate suppression offered by GnRH antagonists like relugolix and Nal-Glu contrasts with the more nuanced, feedback-driven mechanism of traditional OCPs. The choice of model—hypogonadal (as induced by antagonists) or hypergonadal/hyperprogestogenic (a proposed model for OCP effects on the brain)—fundamentally shapes the physiological and structural outcomes [5]. Future research directions include refining the understanding of long-term neurostructural changes associated with these interventions [28] and developing non-steroidal oral contraceptives that leverage specific neuroendocrine targets like the KNDy system [24] [25]. The experimental protocols and comparative data outlined here provide a framework for the objective evaluation of current and future agents aimed at modulating the HPG axis.
Defining the Hypogonadal State Induced by Combined and Progestin-Only Pills
This guide provides a comparative analysis of the hypogonadal states induced by combined oral contraceptives (COCs) and progestin-only pills (POPs), two cornerstone methods of female hormonal contraception. For researchers investigating endocrine disruption models, this review systematically details the molecular mechanisms, quantitative hormonal changes, and key experimental methodologies used to define and characterize these iatrogenic hypogonadal conditions. We present structured experimental data and pathway visualizations to serve as a reference for drug development professionals working within the broader context of hypogonadal hypergonadal models in oral contraceptive effects research.
Hormonal contraceptives induce a temporary, reversible hypogonadal state as their primary mechanism of action. By suppressing the hypothalamic-pituitary-ovarian (HPO) axis, these medications significantly reduce endogenous sex hormone production, thereby preventing ovulation. Combined oral contraceptives achieve this through the synergistic action of synthetic estrogen and progestin, while progestin-only pills rely solely on progestin-mediated effects. This pharmacologically-induced hypogonadism represents a unique model for studying endocrine feedback systems and their disruption. Understanding the distinct pathways and magnitudes of suppression between these contraceptive classes is crucial for developing novel therapeutic agents and understanding the systemic effects of sex steroid withdrawal.
Physiological Mechanisms and Signaling Pathways
Normal HPO Axis Function
In the eugonadal state, the hypothalamic-pituitary-ovarian axis operates through a precisely coordinated feedback system. The hypothalamus secretes gonadotropin-releasing hormone (GnRH) in a pulsatile manner, which stimulates the anterior pituitary to release follicle-stimulating hormone (FSH) and luteinizing hormone (LH). FSH promotes follicular development in the ovaries, while LH triggers ovulation and supports the corpus luteum. The ovaries respond by producing estradiol and progesterone, which in turn provide negative feedback to the hypothalamus and pituitary to regulate gonadotropin secretion. This intricate balance ensures normal cyclic ovarian function and ovulation.
Contraceptive-Mediated Disruption
Both COCs and POPs disrupt the HPO axis, but through partially distinct mechanisms:
Combined Oral Contraceptives: The synthetic estrogen component (typically ethinyl estradiol) provides strong negative feedback on the hypothalamus and pituitary, suppressing GnRH pulsatility and consequently FSH and LH secretion. The progestin component enhances this suppression and additionally thickens cervical mucus and induces endometrial atrophy. The combined effect results in comprehensive suppression of the HPO axis and reliable inhibition of ovulation [30].
Progestin-Only Pills: Progestins primarily suppress ovulation by decreasing the frequency of GnRH pulses and reducing pituitary sensitivity to GnRH, leading to reduced LH secretion. Notably, ovulation is suppressed in only about 50-60% of cycles with traditional POPs, making their non-ovulatory effects (cervical mucus thickening and endometrial changes) critically important for their contraceptive efficacy [30].
The following diagram illustrates the key signaling pathways and points of disruption for both contraceptive classes:
Figure 1: Signaling Pathways of Contraceptive-Induced Hypogonadism. The diagram illustrates points of disruption by COCs (red) and POPs (green) on the normal HPO axis (yellow). COCs provide strong suppression at multiple levels, while POPs primarily decrease GnRH pulse frequency with partial ovulation suppression.
Quantitative Comparison of Hormonal Effects
Androgen Suppression Profiles
The hypogonadal state induced by hormonal contraceptives is characterized by significant alterations in androgen levels and binding proteins. The following table summarizes key quantitative changes derived from clinical studies and meta-analyses:
Table 1: Quantitative Hormonal Changes Induced by Contraceptive Formulations
| Parameter | Combined Oral Contraceptives | Progestin-Only Pills | Measurement Method | Study Duration |
|---|---|---|---|---|
| Total Testosterone | Mean decrease: -0.49 nmol/L (95% CI: -0.55, -0.42); P < 0.001 [31] | Limited quantitative data available; significant decrease reported | Immunoassays, LC-MS/MS | 6-12 months |
| Free Testosterone | Relative change: 0.39 (95% CI: 0.35, 0.43); P < 0.001; mean decrease of 61% [31] | Significant decrease due to reduced production | Calculated free T, equilibrium dialysis | 6-12 months |
| SHBG | Mean increase: 99.08 nmol/L (95% CI: 86.43, 111.73); P < 0.001 [31] | Moderate increase, less pronounced than COCs | Immunoassays | 6-12 months |
| LH Suppression | Profound suppression (>80% reduction from baseline) | Moderate to significant suppression | Immunoassays, LC-MS/MS | 3-6 months |
| FSH Suppression | Significant suppression (>70% reduction from baseline) | Mild to moderate suppression | Immunoassays, LC-MS/MS | 3-6 months |
Formulation-Specific Variations
The magnitude of hormonal suppression varies considerably based on contraceptive formulation characteristics:
Table 2: Formulation-Specific Effects on Key Parameters
| Formulation Characteristic | Impact on Testosterone Suppression | Impact on SHBG Elevation | Clinical Implications |
|---|---|---|---|
| Estrogen Dose (COCs) | No significant difference between 20-25 μg vs. 30-35 μg EE [31] | Significantly greater increase with 30-35 μg EE vs. 20-25 μg EE [31] | Lower estrogen doses minimize metabolic impact while maintaining efficacy |
| Progestin Generation (COCs) | No significant differences between generations [31] | Significantly greater increase with 3rd/4th generation vs. 2nd generation [31] | Second-generation progestins may offer preferable SHBG profile |
| Progestin Type (POPs) | Consistent suppression across different progestin types | Varies by progestin androgenicity; less impact than COCs | Androgenic progestins may partially mitigate SHBG elevation |
Experimental Protocols and Methodologies
Clinical Assessment Protocols
Standardized experimental protocols are essential for characterizing contraceptive-induced hypogonadism:
Protocol 1: Comprehensive Hormonal Profiling
- Subject Selection: Healthy premenopausal women (typically age 18-40) with regular ovulatory cycles
- Baseline Assessment: Daily blood sampling across one complete menstrual cycle to establish individual hormonal patterns
- Intervention Phase: Administration of study contraceptive for 3-6 months
- Sampling Schedule: Weekly blood draws for first month, then monthly assessments
- Analytical Methods:
- Total testosterone: Liquid chromatography-tandem mass spectrometry (LC-MS/MS)
- Free testosterone: Equilibrium dialysis or calculated from total T, SHBG, and albumin
- SHBG: Immunoassay techniques
- LH/FSH: High-sensitivity immunoassays with serial measurements to detect pulsatility
- Statistical Analysis: Paired t-tests for within-subject changes, mixed models for group comparisons
Protocol 2: Dynamic HPO Axis Function Testing
- GnRH Stimulation Test: Administration of exogenous GnRH (100μg IV) with frequent LH/FSH sampling over 180 minutes
- Pulsatility Assessment: Frequent blood sampling (every 10 minutes for 8-12 hours) to characterize LH pulse frequency and amplitude
- Data Interpretation: Comparison of pulse parameters between baseline and treatment phases
Long-Term Hormonal Alterations Research Protocol
Emerging research suggests potential long-term consequences of contraceptive-induced hypogonadism, particularly regarding SHBG regulation:
Experimental Design:
- Population: Women with sexual dysfunction categorized as continuous users, discontinued users (mean 80-196 days post-discontinuation), and never-users of oral contraceptives [32]
- Key Findings: SHBG levels in discontinued users remained significantly elevated compared to never-users (4-fold higher in continuous users, partially persistent after discontinuation) [32]
- Methodological Implications: Assessment of contraceptive effects should consider potential persistent SHBG elevation beyond the treatment period, suggesting possible long-term impact on androgen bioavailability
The Scientist's Toolkit: Research Reagent Solutions
Table 3: Essential Research Reagents for Contraceptive Hypogonadism Studies
| Reagent/Category | Specific Examples | Research Application | Key Function |
|---|---|---|---|
| Hormonal Assays | LC-MS/MS kits for testosterone, Immunoassays for SHBG, LH, FSH | Quantification of hormonal parameters | Precise measurement of steroid hormones and binding proteins |
| Cell Culture Models | Pituitary cell lines (e.g., LβT2), Hypothalamic neuronal cells | In vitro mechanistic studies | Investigation of direct effects on GnRH neurons and gonadotrophs |
| Animal Models | Ovariectomized rodents with hormone replacement, Transgenic models | In vivo pathway analysis | Study of HPO axis regulation without confounding ovarian feedback |
| Molecular Biology Kits | qPCR assays for GnRH, gonadotropin subunits, SHBG mRNA | Gene expression analysis | Assessment of transcriptional regulation in contraceptive response |
| Synthetic Hormones | Ethinyl estradiol, Various progestins (levonorgestrel, norethindrone) | Controlled intervention studies | Precise reproduction of contraceptive formulations for mechanistic studies |
Research Implications and Future Directions
The systematic characterization of contraceptive-induced hypogonadism provides valuable insights for both clinical practice and pharmaceutical development. The differential effects of COCs and POPs on the HPO axis represent distinct models of endocrine disruption that can inform our understanding of gonadal steroid feedback mechanisms. For drug development professionals, these models offer templates for predicting the endocrine impact of novel steroid-based therapeutics.
Future research should prioritize elucidating the long-term consequences of temporary contraceptive-induced hypogonadism, particularly the persistent SHBG elevation observed in some studies [32]. Additionally, more precise quantification of POP effects on androgen dynamics is needed, as current literature focuses predominantly on COCs. The development of increasingly sensitive hormonal assays, particularly for free testosterone assessment, will further refine our understanding of these hypogonadal states.
From a therapeutic perspective, the varying effects of different progestin classes and estrogen doses on SHBG dynamics present opportunities for developing contraceptives with minimized metabolic impact while maintaining efficacy. These considerations are particularly relevant for researchers working within the broader context of hypogonadal hypergonadal models, as contraceptive-induced hypogonadism represents one of the most prevalent and reproducible models of reversible HPO axis suppression in humans.
From Theory to Therapy: Modeling and Applying OC-Induced HPG Suppression
Mathematical Models for Predicting Hormonal Dynamics and Contraceptive Efficacy
The development of mathematical models for predicting hormonal dynamics represents a significant advancement in the field of reproductive health and contraceptive drug development. These models provide a mechanistic understanding of the female menstrual cycle and enable researchers to simulate the effects of hormonal contraceptives on the hypothalamic-pituitary-gonadal (HPG) axis [33]. For researchers and drug development professionals, these computational tools offer invaluable insights for predicting contraceptive efficacy, optimizing dosing strategies, and understanding the underlying mechanisms through which synthetic hormones prevent ovulation. By integrating mathematical modeling with clinical data, scientists can explore "what-if" scenarios in silico, potentially reducing the need for extensive clinical trials and accelerating the development of novel contraceptive formulations [34] [35]. This guide objectively compares the performance of various mathematical modeling approaches in predicting hormonal dynamics and contraceptive efficacy, providing researchers with a framework for selecting appropriate models for specific applications in hypogonadal hypergonadal models and oral contraceptive effects research.
Key Hormonal Players in the Menstrual Cycle
The menstrual cycle involves a complex interaction between the ovaries and the hypothalamus and pituitary in the brain [34] [36]. During the cycle, gonadotropin-releasing hormone (GnRH) produced by the hypothalamus affects the anterior pituitary, which in turn releases gonadotropins including luteinizing hormone (LH) and follicular stimulating hormone (FSH) [34]. These gonadotropins stimulate the ovarian system, controlling follicle growth and hormone production. The hormones produced by the follicles, notably estradiol (E2), progesterone (P4), and inhibin, feedback onto the brain, influencing pituitary hormone production and creating a tightly regulated feedback system [34] [35].
The primary contraceptive effect of hormonal contraceptives is achieved through inhibitory action on the HPG axis, resulting in decreased release of gonadotropins and ovarian steroid hormones [33]. Combined oral contraceptives typically contain synthetic forms of estrogen and progestin, which prevent ovulation through multiple mechanisms, including suppression of the mid-cycle LH surge, thickening of cervical mucus, and alteration of the endometrial lining [37]. Mathematical models of hormonal contraception aim to simulate how these exogenous hormones disrupt the normal menstrual cycle to prevent ovulation.
Table 1: Key Hormones in the Menstrual Cycle and Their Roles in Contraceptive Action
| Hormone | Source | Primary Functions in Menstrual Cycle | Role in Contraception |
|---|---|---|---|
| GnRH | Hypothalamus | Stimulates pituitary release of FSH and LH | Suppressed by synthetic steroids, reducing gonadotropin secretion |
| FSH | Anterior Pituitary | Stimulates follicle development | Suppressed, preventing follicular maturation |
| LH | Anterior Pituitary | Triggers ovulation and corpus luteum formation | Surge suppressed, preventing ovulation |
| Estradiol (E2) | Ovarian Follicles | Regulates endometrial growth; positive feedback triggers LH surge | Replaced by synthetic estrogen (e.g., ethinyl estradiol) to suppress FSH |
| Progesterone (P4) | Corpus Luteum | Prepares endometrium for implantation; negative feedback on LH | Replaced by synthetic progestins to suppress LH and thicken cervical mucus |
| Inhibin | Ovarian Follicles | Suppresses FSH secretion | Levels reduced with suppressed follicular development |
Comparative Analysis of Mathematical Modeling Approaches
Mechanistic Models of Hormonal Contraception
Mechanistic models of hormonal contraception are based on mathematical representations of the biological processes governing the menstrual cycle. Wright et al. developed a model that predicts mean daily blood concentrations of key hormones during a contraceptive state achieved by administering progestins, synthetic estrogens, or combined treatment [34] [36]. This model incorporates two autocrine mechanisms essential for achieving contraception and can simulate how changes in dose impact hormonal cycling [34]. The model outputs have been compared with data from clinical trials for both progestin-only and combined hormonal treatments, demonstrating its predictive capability [36]. A key advantage of this modeling approach is its ability to demonstrate that a contraceptive state can be obtained at lower doses when estrogen and progestin are combined rather than administered individually [34] [36].
The model structure typically involves a system of ordinary or delay differential equations that describe the feedback interactions between hormones. For example, the release of gonadotropins (LH and FSH) is modeled as being stimulated by GnRH and inhibited by ovarian hormones (E2 and P4) through dose-response functions [35]. These models operate on a time scale of days and predict mean levels of hormones, making them suitable for studying cycle-level phenomena rather than pulsatile secretions [34].
Extensions and Refinements to Menstrual Cycle Models
Recent modeling efforts have built upon earlier foundational work by Schlosser and Selgrade, who created some of the first comprehensive mathematical models of the menstrual cycle [35]. Clark et al. and Margolskee and Selgrade further developed these models, though their original formulations did not include ovarian autocrine effects and therefore could not predict the contraceptive response to exogenous administration of progestins [34] [36]. The model by Wright et al. addressed this limitation by incorporating additional autocrine mechanisms, enabling the simulation of contraceptive effects [34].
Röblitz et al. developed a model consisting of 33 ordinary differential equations that describe the feedback mechanisms between key reproductive hormones (GnRH, FSH, LH, E2, P4, inhibin A, inhibin B) and the development of follicles and corpus luteum throughout consecutive cycles [38]. Unlike some earlier models that used delay differential equations, this model relies solely on ordinary differential equations with fewer parameters, potentially making it more computationally tractable [38]. More recent models have begun to incorporate pharmacokinetic-pharmacodynamic (PKPD) components to simulate the administration of drugs, including oral contraceptive pills and GnRH analogs [38]. These PKPD models allow researchers to study how the dose and timing of administration of various drugs influence cycle dynamics.
Table 2: Comparison of Mathematical Models for Hormonal Contraception
| Model Feature | Schlosser & Selgrade Model | Clark et al. Model | Wright et al. Model | Röblitz et al. Model |
|---|---|---|---|---|
| Model Type | Differential equations with delays | Differential equations | Extended differential equations with autocrine mechanisms | System of 33 ODEs |
| Hormones Represented | GnRH, FSH, LH, E2, P4 | GnRH, FSH, LH, E2, P4, Inh | GnRH, FSH, LH, E2, P4, InhA | GnRH, FSH, LH, E2, P4, InhA, InhB |
| Contraceptive Simulation | No | No | Yes (progestin and estrogen) | Yes (with PKPD extension) |
| Follicular Representation | Maturation stages | Maturation stages | Maturation stages with autocrine | Activity levels of maturation stages |
| Menstrual Cycles Simulated | Multiple | Multiple | Multiple | Consecutive |
| Key Innovation | First comprehensive model | Incorporated inhibin | Added autocrine mechanisms for contraception | PKPD for drug administration |
Modeling Follicular Development and Ovarian Stimulation
While many models describe hormonal dynamics, some researchers have developed approaches that explicitly simulate follicular development. These models quantify the time evolution of the sizes of multiple follicles, making their outputs comparable to ultrasound data [38]. Such models have been particularly valuable for studying ovarian stimulation protocols in assisted reproductive technologies.
These follicular models have demonstrated the occurrence of follicles in a wave-like manner during a normal menstrual cycle and can qualitatively predict the outcome of ovarian stimulation initiated at different time points [38]. This capability has important implications for optimizing fertility treatments and understanding the biological basis for novel stimulation protocols such as luteal start, random start, or double stimulation. The success of these methods appears to be based on the continuous growth of multiple cohorts ("waves") of follicles throughout the menstrual cycle, which leads to the availability of ovarian follicles for controlled ovarian stimulation at several time points [38].
Experimental Protocols and Methodologies
Model Development and Validation Protocols
The development of mathematical models for hormonal contraception typically follows a systematic process that begins with a qualitative understanding of the biological system. Researchers first identify the key components and interactions of the HPG axis, often based on extensive literature review and consultation with domain experts [34] [35]. These biological relationships are then formalized into mathematical equations, typically using ordinary or delay differential equations.
Parameter estimation represents a critical step in model development. Parameters are often derived from experimental data published in the biological literature, with some parameters estimated through model fitting to time-series data of hormone concentrations [34]. For example, Wright et al. compared their model outputs with data from two clinical trials: one for a progestin-only treatment and one for a combined hormonal treatment [34] [36]. Models are typically validated by assessing their ability to reproduce known phenomena, such as the occurrence of ovulation, appropriate cycle length, and hormone concentration patterns throughout the cycle.
Simulation Protocols for Contraceptive Efficacy Testing
Once developed and validated, mathematical models can be used to simulate the effects of hormonal contraceptives. The typical protocol involves modifying state variables for blood concentrations of E2 and P4 to represent the administration of synthetic hormones [34] [36]. Contraception is considered achieved if model simulations show a reduction in the LH surge to non-ovulatory levels and/or in P4 levels throughout the cycle [36].
Researchers can systematically vary the type, dose, and timing of hormonal administration to predict which dosing levels produce contraceptive cycles [34]. Additionally, models can simulate how quickly a contraceptive treatment produces a non-ovulatory menstrual cycle and how rapidly the cycle returns to normal after treatment cessation [34] [36]. These simulations provide valuable insights for clinical experimentation with contraceptive combinations and can help identify the lowest dose required to achieve contraception.
Signaling Pathways and Hormonal Regulation
The following diagram illustrates the key hormonal interactions in the menstrual cycle and the points of intervention for hormonal contraceptives:
Diagram 1: Hormonal Regulation and Contraceptive Action. This diagram illustrates the feedback loops between the hypothalamus, pituitary, and ovaries that regulate the menstrual cycle. Solid arrows represent stimulatory effects, while dashed arrows represent inhibitory effects. Red elements indicate the points where synthetic contraceptive hormones intervene in the natural cycle.
The diagram above illustrates the complex feedback relationships that govern the menstrual cycle and highlights the points at which hormonal contraceptives intervene. Synthetic estrogens and progestins primarily act on the hypothalamus and pituitary to suppress GnRH, FSH, and LH secretion, thereby preventing the hormonal events that lead to ovulation [34] [33].
The Scientist's Toolkit: Research Reagent Solutions
Table 3: Essential Research Tools for Modeling Hormonal Contraception
| Research Tool | Function/Application | Examples/Specifications |
|---|---|---|
| Ordinary Differential Equation (ODE) Solvers | Numerical solution of model equations | MATLAB (ode45), Python (SciPy), R (deSolve) |
| Parameter Estimation Algorithms | Fitting model parameters to experimental data | Maximum likelihood estimation, Bayesian methods, particle swarm optimization |
| Sensitivity Analysis Tools | Identifying parameters with greatest impact on model outputs | Sobol method, Morris method, partial rank correlation coefficient |
| Hormone Assay Data | Model validation and parameterization | Radioimmunoassay, ELISA, LC-MS/MS data for FSH, LH, E2, P4 |
| Clinical Trial Data | Model validation for contraceptive efficacy | LH surge suppression, ovulation inhibition rates, bleeding patterns |
| Pharmacokinetic Parameters | Modeling drug absorption and metabolism | Bioavailability, half-life, volume of distribution for synthetic steroids |
Mathematical models for predicting hormonal dynamics and contraceptive efficacy have become increasingly sophisticated, incorporating key biological mechanisms such as autocrine signaling and feedback loops within the HPG axis. The current generation of models can simulate the effects of various contraceptive formulations, including progestin-only and combined hormonal contraceptives, providing valuable insights for drug development and clinical applications [34] [36] [35]. These models demonstrate that combined hormonal treatments achieve contraception at lower doses of each hormone compared to single-hormone approaches, offering a scientific basis for optimizing contraceptive formulations to minimize side effects while maintaining efficacy [34].
For researchers working in hypogonadal hypergonadal models and oral contraceptive effects research, mathematical modeling provides a powerful tool for generating hypotheses, designing experiments, and interpreting complex physiological data. As these models continue to evolve through integration with pharmacokinetic-pharmacodynamic components and more detailed representations of follicular development, they hold promise for enabling patient-specific dosing strategies and accelerating the development of novel contraceptive products [34] [38]. The ongoing refinement of these models represents a convergence of computational biology and reproductive endocrinology that may ultimately enhance contraceptive options and family planning outcomes worldwide.
The pursuit of the minimal effective dose is a fundamental objective in pharmaceutical development, aiming to maximize therapeutic benefits while minimizing adverse effects and systemic exposure. This principle is critically applied in the development of hormonal contraceptives and treatments for hypogonadism, where the goal is to achieve precise endocrine modulation. Research in this field increasingly relies on sophisticated pharmacokinetic-pharmacodynamic (PK-PD) models and biomarker discovery to guide dosing strategies. The clinical imperative is clear: optimized dosing enhances patient adherence, reduces side effects, and maintains the high efficacy required for both contraception and hormonal therapy. This article explores the experimental models and quantitative data driving the quest for optimal dosing across these therapeutic areas.
Experimental Models and Methodologies in Hormonal Research
Pharmacokinetic Modeling for Contraceptive Development
Pharmacokinetic (PK) studies are the cornerstone for establishing initial dosing regimens. A pilot study investigating biomarkers for levonorgestrel (LNG) containing combined oral contraceptives (COCs) and depot medroxyprogesterone acetate (DMPA) meticulously established sampling timepoints based on established PK data [39]. For COCs, serum and urine samples were collected prior to the first dose and at designated intervals on Days 1 and 3, reflecting the rapid peak-and-trough pharmacokinetics of oral administration. For the injectable DMPA, samples were taken prior to injection and on Days 21 and 60 post-injection, capturing the slow-release, steady-state concentrations characteristic of depot formulations [39].
The analytical methodologies employed are crucial for model accuracy. Liquid chromatography-tandem mass spectrometry (LC-MS/MS) was used to measure serum and urine concentrations of synthetic progestins (LNG and MPA) with high specificity and sensitivity [39]. This technique allows for the precise quantification of hormone levels, providing the raw data for PK model construction. Furthermore, the successful use of a DetectX LNG immunoassay kit on urine samples demonstrated the potential for more accessible biomarker testing, which could be leveraged in larger population studies or point-of-care applications [39].
Novel Endpoints and Biomarker Discovery
Beyond traditional PK analysis, research is exploring novel endpoints to assess contraceptive efficacy and biological effect. For non-hormonal methods in development, such as the investigational drug-device combination Ovaprene, researchers employed a postcoital testing model. This involved instructing participants to have intercourse around the time of ovulation and then measuring the number of progressively motile sperm that penetrated into the cervix within two hours [40]. This direct measurement of sperm inhibition serves as a functional efficacy endpoint during early-phase trials.
In biomarker discovery, transcriptome analysis of saliva has been explored as a potential marker of hormonal contraceptive exposure. While differential gene expression was detected in DMPA users on Days 21 and 60 compared to baseline, no significant changes were found among COC users at the same early timepoints [39]. This suggests that the duration and type of hormonal exposure influence the salivary transcriptome, and further research is needed to refine this approach for different contraceptive modalities.
Comparative Dosing and Efficacy Data
The application of optimal dosing principles has led to a diverse landscape of hormonal products with varying doses, durations, and efficacy profiles. The following tables summarize key data for contraceptives and hypogonadism treatments, providing a comparative view of how dosing is leveraged for effect.
Table 1: Dosing and Efficacy of Long-Acting Reversible Contraceptives (LARCs) in Australia [41]
| Method | Brand Example | Hormone & Dose | Duration | Efficacy (Perfect Use) |
|---|---|---|---|---|
| Contraceptive Implant | Implanon NXT | 68 mg Etonogestrel | 3 years | 99.9% |
| Hormonal IUD | Mirena | 52 mg Levonorgestrel | 8 years | 99.9% |
| Hormonal IUD | Kyleena | 19.5 mg Levonorgestrel | 5 years | 99.7% |
| Copper IUD | TT380 Short | – | 5-10 years | 99.2% |
Table 2: Dosing and Efficacy of Short-Acting Hormonal Contraceptives [41] [42]
| Method | Brand Example | Hormone & Dose | Efficacy (Perfect Use) | Efficacy (Typical Use) |
|---|---|---|---|---|
| Combined Oral Contraceptive Pill | Microgynon 20 ED | 20 mcg EE / 100 mcg LNG | 99.5% | 93% |
| Vaginal Ring | NuvaRing | 11.7 mg Etonogestrel / 2.7 mg EE | 99.5% | 93% |
| Progestogen-Only Pill | Noriday | 350 mcg Norethisterone | 99.5% | 91% |
| Contraceptive Injection | Depo-Provera | 150 mg Medroxyprogesterone | 99.8% | 96% |
Table 3: Dosing and Outcomes in Testosterone Replacement Therapy (TRT) for Hypogonadal Men [43]
| Treatment Modality | Dose & Regimen | Key Efficacy Outcome | Key Safety Finding |
|---|---|---|---|
| Intramuscular Testosterone Cypionate (IM-TC) | 100 mg weekly | Significant increase in trough TT (from 313.6 to 536.4 ng/dL) | Associated with higher post-therapy estradiol (E2) and hematocrit (HCT) |
| Subcutaneous Testosterone Enanthate Auto-injector (SCTE-AI) | 100 mg weekly | Significant increase in trough TT (from 246.6 to 552.8 ng/dL) | Associated with lower post-therapy E2 and HCT vs. IM-TC |
Signaling Pathways and Experimental Workflows
Understanding the biological pathways modulated by hormonal drugs is essential for rational dosing. The following diagrams illustrate the core pathways involved in contraception and hypogonadism, as well as a generalized experimental workflow for biomarker discovery.
Hormonal Contraception and Hypogonadism Pathways
Diagram 1: Key signaling pathways in hormonal contraception and hypogonadism. CHC inhibits the HPG axis to prevent ovulation [44], while HH results from its dysfunction [2]. Progestin exerts multiple contraceptive effects [41] [45].
Biomarker Identification Workflow
Diagram 2: Experimental workflow for identifying biomarkers of drug exposure. This process involves multi-matrix sampling (serum, urine, saliva) analyzed via techniques like LC-MS/MS and RNA sequencing to identify objective biomarkers for PK modeling and adherence monitoring [39].
The Scientist's Toolkit: Essential Research Reagents and Materials
The experiments cited rely on a suite of specialized reagents and materials to generate robust, reproducible data on drug dosing and effect.
Table 4: Key Research Reagent Solutions for Hormonal Drug Development
| Reagent / Material | Function in Research | Experimental Context |
|---|---|---|
| Liquid Chromatography-Tandem Mass Spectrometry (LC-MS/MS) | Precisely quantifies specific hormones and their metabolites in biological samples (serum, urine). | Used as the gold standard to measure levonorgestrel (LNG) and medroxyprogesterone acetate (MPA) levels [39]. |
| Enzyme Immunoassay Kits (e.g., DetectX) | Provides a potentially more accessible and high-throughput method for detecting specific hormones (e.g., LNG) in urine. | Demonstrated 100% sensitivity in measuring urine LNG, validating a non-invasive biomarker [39]. |
| RNA Sequencing Reagents | Enables transcriptome-wide analysis to identify differentially expressed genes (DEGs) as potential biomarkers of drug exposure or effect. | Used on saliva samples to detect DEGs in DMPA users, exploring a novel biomarker matrix [39]. |
| Synthetic Progestins & Formulations | The active pharmaceutical ingredients (APIs) used in interventional studies to establish PK-PD relationships. | Examples include levonorgestrel (in COCs, IUDs, implants) and medroxyprogesterone acetate (in DMPA) [41] [39]. |
| Validated Biomatrix Collection Kits | Standardizes the collection, preservation, and storage of biological samples (e.g., saliva with RNA stabilizers) to ensure analyte integrity. | Critical for preserving RNA in saliva samples for subsequent transcriptome analysis [39]. |
Discussion and Future Directions
The data and methodologies presented highlight a multi-faceted approach to defining optimal dosing. The extension of the 52 mg levonorgestrel IUD's duration from 5 to 8 years based on large-scale studies demonstrating maintained efficacy is a prime example of how real-world evidence and PK modeling can refine dosing intervals to maximize convenience and cost-effectiveness [41]. Similarly, the comparison of testosterone formulations reveals how delivery systems (intramuscular vs. subcutaneous) can influence peak-to-trough ratios and side-effect profiles, even with identical weekly doses [43]. This underscores that the "minimal effective dose" is not solely about the milligram quantity, but also about the kinetic profile dictated by the formulation and route of administration.
Future research directions are poised to further personalize dosing. The exploration of salivary transcriptomics and urinary biomarkers, while still investigational, points toward a future where non-invasive biomarkers could provide objective measures of adherence and biological effect, fine-tuning individual dosing recommendations [39]. Furthermore, the development of novel non-hormonal methods, such as Ovaprene, represents an alternative strategy that circumvents systemic hormonal exposure entirely while still requiring precise dosing of its active agent (e.g., the spermicidal iron compound) to achieve efficacy comparable to mid-range hormonal options [40]. As the fields of hypogonadism treatment and contraceptive development advance, the integration of sophisticated PK-PD models, genetic and molecular biomarkers, and patient-specific factors will be paramount in the continued quest for the minimal effective dose.
Ovarian autocrine signaling represents a critical regulatory mechanism wherein ovarian cells produce and respond to their own signaling molecules, creating self-regulating feedback loops essential for maintaining tissue homeostasis and function. Within the context of hypogonadal and hypergonadal models in oral contraceptive effects research, understanding these autocrine mechanisms is paramount for developing physiologically relevant experimental models. Autocrine pathways govern fundamental ovarian processes including follicular development, steroidogenesis, and cellular response to therapeutic agents, with dysregulation contributing to pathological states such as ovarian cancer and chemoresistance [46]. The fidelity of ovarian disease and contraceptive effect models hinges on accurately recapitulating these complex autocrine networks, which interface with paracrine and endocrine signaling to coordinate overall ovarian function. This review examines key autocrine mechanisms in ovarian biology and their critical implications for developing high-fidelity research models in hormonal contraception and ovarian pathophysiological studies, with particular focus on the translational relevance of current experimental approaches.
Key Ovarian Autocrine Signaling Pathways
Relaxin/RXFP1 Autocrine Signaling Loop
The relaxin and its G-protein coupled receptor RXFP1 form a critical autocrine signaling axis in ovarian cancer pathogenesis and normal ovarian function. This pathway establishes a self-sustaining loop where cancer cells produce both the ligand and receptor, leading to constitutive activation of downstream oncogenic pathways [47].
Table 1: Relaxin/RXFP1 Autocrine Signaling Components and Functions
| Component | Expression in OC | Function in Autocrine Signaling | Downstream Pathways Activated |
|---|---|---|---|
| Relaxin peptide | Elevated in tumors, ascites, serum | Autocrine growth factor | RHO, MAPK, Wnt, Notch |
| RXFP1 receptor | Overexpressed in chemoresistant cells | Autocrine signaling receiver | cAMP, ERK1/2, PI3K/AKT |
| Inflammatory cytokines (IL-6, TNF-α) | Induced in tumor microenvironment | Activate relaxin transcription via STAT3 and NF-κB | JAK/STAT, NF-κB signaling |
| Relaxin-neutralizing antibody | Therapeutic intervention | Disrupts autocrine loop | Increases cisplatin sensitivity |
This autocrine loop is initiated when inflammatory cytokines IL-6 and TNF-α activate transcription of relaxin via recruitment of STAT3 and NF-κB to the proximal promoter, establishing a feedforward loop that potentiates its own expression [47]. Inhibition of this pathway through RXFP1 blockade or relaxin-neutralizing antibodies significantly abrogates in vivo tumor formation and sensitizes ovarian cancer cells to cisplatin, highlighting its therapeutic relevance [47].
Plasma Gelsolin (pGSN) Exosome-Mediated Autocrine Signaling
Plasma gelsolin operates through an exosome-mediated autocrine mechanism that promotes chemoresistance in ovarian cancer. This pathway involves the secretion and uptake of pGSN via exosomes (Ex-pGSN), creating a self-reinforcing signaling loop that enhances cell survival under chemotherapeutic stress [46].
Figure 1: Exosome-mediated pGSN autocrine signaling in ovarian cancer chemoresistance. The pathway shows how pGSN secretion via exosomes creates a self-reinforcing loop that confers cisplatin resistance.
The clinical significance of this pathway is demonstrated by the correlation between elevated pGSN expression and poorer patient outcomes. In serous ovarian cancer patients treated with platinum derivatives, high pGSN expression was significantly associated with shorter time to tumor recurrence (16.6 months vs. 18.27 months in low pGSN expressers) [46]. This effect was particularly pronounced in patients with suboptimal surgical debulking, where elevated pGSN predicted dramatically reduced progression-free survival regardless of treatment regimen.
PI3K/AKT Mechanotransduction Signaling
The PI3K/AKT pathway serves as a central hub for mechanotransduction in ovarian tissue, translating mechanical cues from the extracellular matrix into biochemical signals that regulate follicular dormancy and activation [48]. This pathway integrates both mechanical and biochemical signals to maintain ovarian reserve and support follicular development.
Table 2: PI3K/AKT Pathway Components in Ovarian Mechanobiology
| Pathway Component | Mechanical Regulation | Role in Folliculogenesis | Impact of Dysregulation |
|---|---|---|---|
| Transcription factor FOXO3 | Nuclear localization maintained by ECM compressive forces | Central regulator of follicular dormancy | Premature follicular activation and depletion |
| PTEN (phosphatase) | Negative regulator of PI3K signaling | Maintains primordial follicle quiescence | PTEN loss causes excessive activation |
| mTOR downstream effector | Activated by AKT phosphorylation | Regulates oocyte growth and protein synthesis | Disrupted autophagy in granulosa cells |
| Kit ligand/c-Kit receptor | Initiated by granulosa-oocyte communication | Activates PI3K/AKT cascade | Impaired follicular development |
The PI3K/AKT pathway exhibits crosstalk with the Hippo signaling pathway, another mechanosensitive cascade, collectively modulating mechanical and biochemical cues within the ovarian microenvironment [48]. This integration allows ovarian cells to respond appropriately to changing tissue stiffness and composition, particularly during aging when ECM remodeling occurs.
Experimental Models for Studying Ovarian Autocrine Signaling
In Vitro Ovarian Cancer Models and Chemoresistance Assays
Experimental investigation of autocrine signaling in ovarian cancer employs sophisticated in vitro models that recapitulate the tumor microenvironment. These models enable precise dissection of autocrine mechanisms and their contribution to chemoresistance development [46].
Experimental Protocol: Exosome-Mediated Autocrine Signaling Analysis
- Cell Culture Conditions: Maintain chemosensitive (OV2295, OV4453, A2780s) and chemoresistant (OV90, Hey, A2780cp) ovarian cancer cells in appropriate media with 10% exosome-depleted FBS to eliminate confounding exogenous exosomes.
- Cisplatin Treatment: Expose cells to 10μM CDDP for 24 hours to assess stress-induced autocrine responses.
- Exosome Isolation: Harvest conditioned media and isolate exosomes using differential ultracentrifugation (100,000×g for 70 minutes) or commercial exosome isolation kits.
- Western Blot Analysis: Determine pGSN expression in cell lysates and exosome fractions using specific antibodies, with β-actin as loading control.
- ELISA Quantification: Precisely quantify secreted pGSN levels in concentrated conditioned media.
- Apoptosis Assay: Measure CDDP-induced apoptosis via flow cytometry using Annexin V/propidium iodide staining.
- Autocrine Loop Disruption: Treat cells with pGSN-neutralizing antibodies or HIF1α inhibitors to assess pathway dependence.
This experimental approach demonstrated that chemoresistant ovarian cancer cells maintain high cellular and secreted pGSN levels even after cisplatin exposure, while chemosensitive cells show marked reduction in pGSN expression and undergo significant apoptosis [46]. Furthermore, exosomal pGSN conferred cisplatin resistance to otherwise sensitive cells, confirming its functional role in autocrine-mediated chemoprotection.
3D Culture Systems and Organ-on-Chip Platforms
Advanced culture systems have emerged as essential tools for modeling the ovarian microenvironment with high physiological relevance. These platforms preserve native tissue architecture and cell-cell interactions essential for autocrine signaling [48].
Figure 2: Experimental workflow for studying mechanical activation of folliculogenesis. The diagram illustrates how mechanical disruption initiates signaling pathways leading to follicle activation and growth.
These innovative platforms enable researchers to study autocrine and paracrine signaling in a context that closely mimics the native ovarian environment, particularly the biomechanical properties that significantly influence cellular behavior. The application of ovarian tissue stretching protocols has demonstrated that mechanical forces can activate folliculogenesis through modulation of the Hippo pathway, highlighting the integration of biophysical and biochemical signaling in ovarian function [49].
Animal Models of Hormonal Contraception
Animal models, particularly rat models, provide essential in vivo systems for studying the neurobehavioral and systemic effects of hormonal contraceptives and their interaction with ovarian autocrine pathways [33].
Experimental Protocol: Hormonal Contraceptive Administration in Rat Models
- Animal Selection: Use adult female Sprague-Dawley or Long-Evans rats (3-4 months old) with regular estrous cycles confirmed by vaginal cytology.
- Contraceptive Formulation Selection:
- Progestin-only: Levonorgestrel (10μg/day) or Etonogestrel (2.5μg/day)
- Combination: Levonorgestrel (10μg/day) + Ethinyl Estradiol (1μg/day)
- Administration Method: Subcutaneous implants (Silastic tubing) or oral gavage for 4-6 weeks to ensure stable hormonal suppression.
- Control Groups: Include vehicle-treated cycling females and ovariectomized females with hormone replacement.
- Tissue Collection: Collect trunk blood for serum hormone analysis, rapidly dissect brain regions (prefrontal cortex, hippocampus, hypothalamus), and preserve ovarian tissue for immunohistochemistry.
- Outcome Measures:
- Serum LH, FSH, estradiol, and progesterone levels
- Ovarian follicle counts and staging
- Neurotransmitter and receptor analyses in brain regions
- Behavioral testing (anxiety, cognition, social behavior)
These models have revealed that hormonal contraceptives significantly alter the ovarian microenvironment and autocrine signaling, potentially influencing follicular development and oocyte quality through suppression of the HPG axis [33]. Furthermore, different progestin generations with unique receptor binding affinities produce distinct neurobehavioral and ovarian profiles, highlighting the importance of specific formulation selection in experimental design.
Research Reagent Solutions for Ovarian Autocrine Studies
Table 3: Essential Research Reagents for Ovarian Autocrine Signaling Investigation
| Reagent/Category | Specific Examples | Research Application | Experimental Function |
|---|---|---|---|
| Cell Lines | OV90, OV2295, A2780s, A2780cp, Hey, PA-1 | In vitro autocrine signaling studies | Model chemosensitive vs. chemoresistant phenotypes |
| Cytokines & Growth Factors | Recombinant relaxin, IL-6, TNF-α | Autocrine loop stimulation | Activate inflammatory signaling and relaxin transcription |
| Signaling Inhibitors | RXFP1 antagonists, HIF1α inhibitors, PI3K/AKT inhibitors | Pathway disruption studies | Target specific autocrine components for mechanistic studies |
| Antibodies | pGSN-neutralizing antibodies, anti-relaxin, anti-RXFP1 | Autocrine loop blockade; IHC, WB | Detect and inhibit autocrine signaling components |
| Exosome Isolation Kits | Total Exosome Isolation Reagent, ultracentrifugation protocols | Extracellular vesicle studies | Isolate exosomes for autocrine/paracrine communication studies |
| 3D Culture Systems | Matrigel, collagen-based matrices, organ-on-chip platforms | Tissue-mimetic culture | Maintain physiological architecture for autocrine signaling |
| Hormonal Formulations | Levonorgestrel, Nestorone, testosterone derivatives | Contraceptive effect studies | Model hormonal interventions in ovarian function |
These research reagents enable comprehensive dissection of ovarian autocrine mechanisms across multiple experimental platforms, from reductionist cell culture systems to complex animal models. The selection of appropriate reagents must consider their specific application to the research question, whether focused on basic mechanism discovery, therapeutic development, or translational model validation.
Discussion: Implications for Model Fidelity in Contraceptive Research
The fidelity of experimental models in ovarian research hinges on accurate recapitulation of autocrine signaling networks and their integration with systemic hormonal regulation. In the context of hypogonadal and hypergonadal models for oral contraceptive effects research, several critical considerations emerge.
First, the interplay between pharmaceutical hormonal suppression and endogenous ovarian autocrine signaling creates a complex regulatory landscape that must be carefully considered in model interpretation. Hormonal contraceptives suppress the HPG axis, reducing gonadotropin release and ovarian steroidogenesis, but local autocrine factors within the ovary may continue to influence follicular development and oocyte quality despite systemic suppression [33]. This compartmentalization of signaling may explain variations in individual response to contraceptive regimens and highlights the importance of including ovarian endpoints in contraceptive efficacy and safety studies.
Second, the mechanical properties of ovarian tissue and their influence on autocrine signaling represent an underappreciated dimension in model development. The stiffness gradient from cortex to medulla creates distinct mechanical microenvironments that influence follicular development through mechanotransduction pathways including Hippo and PI3K/AKT signaling [48] [49]. Age-related ECM remodeling with increased fibrosis and tissue stiffness disrupts these mechanical cues, potentially contributing to the decline in ovarian reserve. Faithful reproduction of these biomechanical properties in experimental models is essential for accurate study of ovarian function across the lifespan.
Third, autocrine pathways contributing to ovarian cancer pathogenesis, particularly the relaxin/RXFP1 and pGSN exosome-mediated loops, represent promising therapeutic targets that may also influence normal ovarian physiology [47] [46]. The development of targeted interventions against these pathways must account for their potential roles in non-pathological processes, particularly in the context of contraceptive safety for women with genetic predispositions to ovarian cancer.
Future directions in ovarian autocrine research should prioritize the development of more sophisticated model systems that integrate multiple cell types, physiological mechanical cues, and dynamic hormonal exposures to better capture the complexity of ovarian function. Additionally, increased attention to interspecies differences in autocrine signaling and hormone metabolism will enhance translational relevance of preclinical findings [33]. As our understanding of ovarian autocrine mechanisms deepens, so too will our ability to create high-fidelity models that accurately predict therapeutic outcomes and safety profiles for hormonal contraceptives and other interventions targeting ovarian function.
The development of effective, reversible male hormonal contraception represents a significant opportunity to expand family planning choices and promote shared responsibility in contraception. Research in this field is fundamentally guided by the well-established principle of suppressing the hypothalamic-pituitary-gonadal (HPG) axis, a mechanism long utilized in female oral contraceptives [4] [50]. The core biological premise is that exogenous administration of steroids—typically a combination of an androgen and a progestin—inhibits the pulsatile release of gonadotropin-releasing hormone (GnRH) from the hypothalamus [19] [51]. This suppression leads to a marked reduction in pituitary secretion of luteinizing hormone (LH) and follicle-stimulating hormone (FSH) [50]. The consequent decline in intratesticular testosterone, which falls to levels inadequate to support spermatogenesis, results in reversible contraceptive efficacy comparable to female methods [52] [50] [53]. This paper provides a comparative analysis of male hormonal contraceptive (MHC) prototypes, detailing experimental data, methodologies, and the essential research toolkit to advance this promising field.
Comparative Efficacy of Male Hormonal Contraceptive Regimens
Extensive clinical trials have demonstrated that hormonal approaches can effectively and reversibly suppress spermatogenesis. The benchmark for contraceptive efficacy is the suppression of sperm concentration to below 1 million sperm/mL, a threshold that provides contraceptive reliability comparable to female methods [52] [53]. The tables below synthesize key efficacy and recovery data from major clinical studies.
Table 1: Contraceptive Efficacy of Major Male Hormonal Formulations in Clinical Trials
| Formulation | Study Details | Sperm Suppression Rate (<1 million/mL) | Contraceptive Efficacy (Pearl Index) | Key Findings |
|---|---|---|---|---|
| Testosterone Enanthate (TE) Injections | WHO Multicenter Trial (1990s), ~700 men [52] | 98% of participants [52] | 1.4 per 100 person-years [52] | Proof-of-concept; weekly injections required. |
| Testosterone + Progestin Combinations | Various regimens (e.g., T + Levonorgestrel, T + Etonogestrel) [52] | Up to 94% of participants [52] | Ranged from 0-2.3 per 100 person-years [53] | Faster and more complete suppression than T alone. |
| Testosterone Undecanoate (TU) Injections | Chinese Phase 3 Study, 1045 men [52] | 95.2% of participants at 6 months [52] | 1.1 per 100 person-years [52] | Monthly injections; total failure rate of 6.1%. |
| Transdermal NES/T Gel | Phase 2b trials, ongoing [53] | Effective suppression demonstrated [53] | Under investigation in 400 couples [53] | Daily, self-applied gel; high user acceptability. |
Table 2: Recovery and Demographic Factors in Male Hormonal Contraception
| Parameter | Impact on Spermatogenesis Suppression & Recovery | Supporting Data |
|---|---|---|
| Recovery Time | Median time to recovery (>20 million/mL): 3.4 months; Probability of recovery: 90% within 12 months, 100% within 24 months [52]. | Integrated analysis of 30 studies (1990-2005) [52] |
| Ethnic Differences | Asian men show higher rates of azoospermia and faster suppression compared to Caucasian men [52] [50]. | WHO trials; LH pulses are more suppressed in Asian men with exogenous T [52] |
| Role of Progestin | Addition of a progestin to an androgen regimen results in faster and more complete suppression of sperm output [52]. | Integrated analysis of 1756 men from 1990-2005 [52] |
Experimental Protocols for Evaluating MHC Candidates
The evaluation of male hormonal contraceptives follows rigorous clinical protocols to establish safety, efficacy, and reversibility. The following outlines a standardized methodology.
Phase II/III Clinical Trial Protocol for MHC Efficacy
Primary Objective: To determine the ability of a hormonal combination to suppress spermatogenesis to a level of severe oligozoospermia (sperm concentration < 1 million/mL) and to assess its contraceptive efficacy in couples.
Study Design:
- Population: Healthy, fertile male volunteers in stable, mutually monogamous relationships with female partners of reproductive age [52] [53].
- Phases:
- Control/Screening Phase (1-2 months): Baseline semen quality is established with at least two samples showing normal sperm concentration (>15-20 million/mL). Hormone levels (LH, FSH, testosterone) are measured [52].
- Suppression/Treatment Phase (4-6 months): Participants receive the investigational drug (e.g., monthly TU injections, daily NES/T gel). Semen analysis is performed monthly until sperm concentration falls below the target threshold of 1 million/mL [52] [53].
- Efficacy Phase (12 months): Once severe oligozoospermia is achieved, couples are instructed to use the investigational drug as their sole method of contraception. Pregnancy rates are monitored [52] [53].
- Recovery Phase (up to 12 months): Treatment is discontinued. Semen analysis and hormone levels are monitored until they return to the individual's normal baseline [52].
Key Measurements:
- Primary Endpoint: Pregnancy rate (Pearl Index) during the efficacy phase [53].
- Secondary Endpoints: Time to suppression of spermatogenesis; time to recovery of spermatogenesis; serum levels of LH, FSH, and testosterone; safety parameters (lipid profile, hematocrit, PSA, adverse event reporting) [52] [19].
Signaling Pathways and Experimental Workflows
The mechanism of action for male hormonal contraceptives is based on the strategic suppression of the HPG axis. The following diagram illustrates this core pathway and the intervention point for MHC.
Diagram 1: HPG Axis Suppression by Male Hormonal Contraceptives. Administration of exogenous steroids inhibits GnRH release, leading to suppressed gonadotropins and decreased intratesticular testosterone, which arrests spermatogenesis.
The typical workflow for clinical development, from early-phase safety studies to large-scale efficacy trials, is structured as follows.
Diagram 2: Clinical Trial Workflow for Male Hormonal Contraceptives. The process progresses from initial safety studies in small groups to large-scale efficacy trials in couples.
The Scientist's Toolkit: Research Reagent Solutions
The following table details key reagents and compounds critical for research and development in male hormonal contraception.
Table 3: Essential Reagents for Male Hormonal Contraception Research
| Reagent / Compound | Function in Research & Development |
|---|---|
| Testosterone Esters (e.g., Testosterone Enanthate, Testosterone Undecanoate) | Serve as the foundational androgen component in regimens; provide negative feedback on the HPG axis and maintain systemic androgen levels [52] [19]. |
| Progestins (e.g., Levonorgestrel, Etonogestrel, Desogestrel, Nestorone) | Augment gonadotropin suppression when combined with androgens, leading to more rapid and reliable suppression of spermatogenesis [52] [53]. |
| Novel Androgens (e.g., DMAU, 11β-MNTDC) | Orally bioavailable compounds with both androgenic and progestogenic activity; designed for single-agent use with improved metabolic profiles [19] [53]. |
| Selective Androgen Receptor Modulators (SARMs) | Investigational agents that aim to suppress gonadotropins via androgen receptor binding while having tissue-selective effects to minimize side effects [52]. |
| GnRH Antagonists | Potently and rapidly suppress gonadotropin secretion; used in experimental protocols but limited by cost and requirement for frequent administration [52]. |
Male hormonal contraception, grounded in the precise suppression of the HPG axis, has progressed from proof-of-concept to the brink of clinical application. Current lead candidates, including oral DMAU and 11β-MNTDC and transdermal NES/T gel, are designed to meet demands for efficacy, safety, and user convenience [19] [53]. The continued development and eventual commercialization of these methods hold the potential to transform reproductive autonomy and equity, offering couples a much-needed expanded choice in reliable, reversible contraception.
Within pharmacological research on hypogonadal and hypergonadal models, the precise simulation of contraceptive states is paramount for evaluating novel compounds and formulations. This guide provides a foundational comparison of two principal classes of oral contraceptives—combined estrogen-progestin (COC) and progestin-only (POP) regimens. The objective is to delineate their distinct mechanisms of action, efficacy profiles, and experimental safety data to inform preclinical model development and clinical trial design for drug development professionals. Understanding these differences is critical for selecting appropriate control arms, interpreting experimental outcomes related to ovulation suppression, and assessing bleeding profiles in study participants [37] [54].
Comparative Drug Profiles and Mechanisms of Action
Combined oral contraceptives (COCs) and progestin-only pills (POPs) constitute the primary categories of oral hormonal contraception, each with distinct compositions and pharmacological profiles.
Combined Oral Contraceptives (COCs) contain both synthetic estrogen (typically ethinyl estradiol) and a synthetic progestin. The progestin component is responsible for the primary contraceptive effect, while the estrogen component provides cycle control [54]. COCs are classified by generation based on their progestin component:
- First-generation: Norethindrone acetate, ethynodiol diacetate
- Second-generation: Levonorgestrel (LNG), dl-norgestrel
- Third-generation: Norgestimate, gestodene (GSD), desogestrel (DSG)
- Unclassified: Drospirenone (DRSP), cyproterone acetate [54]
Progestin-Only Pills (POPs), also known as minipills, contain only a synthetic progestin without an estrogen component. Common progestins used in POP formulations include norethindrone (0.35 mg) and drospirenone (4 mg) [54] [55].
Table 1: Classification and Components of Oral Contraceptives
| Category | Estrogen Component | Progestin Components | Example Formulations |
|---|---|---|---|
| Combined (COC) | Ethinyl Estradiol (typically 10-35 mcg) | Levonorgestrel (LNG), Desogestrel (DSG), Gestodene (GSD), Drospirenone (DRSP) | Monophasic, Multiphasic, Extended-cycle |
| Progestin-Only (POP) | None | Norethindrone (0.35 mg), Drospirenone (4 mg) | Traditional POP, 24/4 DRSP formulation |
The mechanisms by which these classes achieve contraception share some pathways but differ significantly in their primary actions, particularly regarding ovulation inhibition.
Primary Mechanisms of Action
Contraceptive Mechanism Pathways
Combined Oral Contraceptives prevent pregnancy through multiple synergistic mechanisms. The primary mechanism is ovulation inhibition achieved via negative feedback on the hypothalamus and pituitary gland. Progestin negative feedback decreases gonadotropin-releasing hormone (GnRH) pulse frequency, which reduces secretion of follicle-stimulating hormone (FSH) and luteinizing hormone (LH). The estrogen component provides additional negative feedback on FSH, further inhibiting follicular development. Without follicular development and the subsequent LH surge, ovulation does not occur [54]. Secondary mechanisms include progestin-induced thickening of cervical mucus (impeding sperm penetration) and endometrial thinning (reducing receptivity to implantation) [54].
Progestin-Only Pills employ a different mechanistic profile. Their primary mechanism is cervical mucus thickening, creating a barrier that prevents sperm from entering the upper genital tract. Some POP formulations, particularly those containing drospirenone, also suppress ovulation, but this is not consistent across all progestin types [54] [55]. POPs additionally alter endometrial development and slow ovum transport through the fallopian tubes [54]. The contraceptive effect of POPs begins within 48 hours of initiation due to rapid cervical mucus changes, while full ovulation inhibition (where applicable) may take up to 28 days to establish [56].
Quantitative Efficacy and Safety Data
Clinical efficacy and safety profiles differ substantially between COCs and POPs, influencing their application in both clinical practice and research settings.
Contraceptive Efficacy and Bleeding Profiles
Table 2: Comparative Efficacy and Cycle Control Profiles
| Parameter | Combined Oral Contraceptives (COC) | Progestin-Only Pills (POP) |
|---|---|---|
| Perfect Use Failure Rate | <1% [54] | <1% (Drospirenone 4mg) [55] |
| Typical Use Failure Rate | 7%-9% [42] [54] | Data varies by formulation |
| Pearl Index (Typical Use) | 7 [57] | 0.39 (Drospirenone 4mg) [55] |
| Primary Mechanism | Ovulation Inhibition | Cervical Mucus Thickening |
| Onset of Action | 7 days for full protection with quick start [54] | 48 hours for cervical mucus effect [56] |
| Breakthrough Bleeding | Varies by progestin type: GSD demonstrates lowest incidence (OR 0.41) [37] | Common: 89.5% experience intermenstrual bleeding [55] |
Network meta-analyses of randomized controlled trials reveal nuanced differences among specific progestins within the COC class. Regarding cycle control, gestodene (GSD) demonstrates the lowest incidence of breakthrough bleeding (BTB) and irregular bleeding (IB) with odds ratios of 0.41 and 0.67, respectively [37]. For withdrawal bleeding days, drospirenone (DRSP) ranks highest, followed by GSD, LNG, and desogestrel (DSG) [37]. Contraceptive efficacy among COCs was highest for DSG, followed by DRSP and GSD, with LNG being the least effective, though all demonstrated comparable efficacy [37].
Safety and Adverse Event Profiles
Table 3: Comparative Safety and Adverse Event Profiles
| Parameter | Combined Oral Contraceptives (COC) | Progestin-Only Pills (POP) |
|---|---|---|
| Venous Thromboembolism (VTE) Risk | Increased risk, estrogen dose-dependent [54] [58] | No increased risk [55] |
| Stroke Risk | Threefold increased risk of cryptogenic stroke (adjusted OR 3.00) [58] | Not associated with increased risk |
| Common Adverse Events | Nausea, headache, breast tenderness, bloating [37] [59] | Irregular bleeding, headache, breast tenderness [55] [59] |
| Key Contraindications | History of blood clots, cardiovascular disease, migraine with aura, smokers >35 years, hypertension [54] [59] | Few absolute contraindications; caution with certain liver conditions and drug interactions [59] |
| Metabolic Effects | Potential impact on lipid profiles, blood pressure, and carbohydrate metabolism [54] | Minimal metabolic impact |
Safety considerations are paramount in both clinical application and research protocols. COCs carry established risks of venous thromboembolism (VTE) and stroke, particularly concerning for specific patient populations. Recent research presented at the European Stroke Organisation Conference (ESOC) 2025 revealed that COC use is associated with a threefold increase in the risk of cryptogenic ischemic stroke in young women (adjusted odds ratio 3.00) [58]. This risk appears independent of other known contributors such as hypertension, smoking, and migraine with aura.
In contrast, POPs are not associated with increased VTE or stroke risk, making them safer for women with contraindications to estrogen [55]. A recent study of drospirenone 4mg POP found that although 31.9% of subjects had risk factors for VTE, no VTE-related treatment-emergent adverse events were observed [55]. The most common adverse event for POPs is irregular uterine bleeding, occurring in 89.5% of users in the drospirenone study [55].
Experimental Protocols and Research Methodologies
Clinical Trial Designs for Contraceptive Efficacy
Pearl Index Calculation Protocol: The Pearl Index is a standard measurement for contraceptive efficacy, representing the number of pregnancies per 100 woman-years of exposure [55] [57]. The formula is: [ \text{Pearl Index} = \frac{\text{Number of pregnancies} \times 1300}{\text{Number of exposed cycles}} ] In recent POP trials, exposed cycles are defined as any cycle in which at least one active dose was confirmed. Pregnancies with estimated conception dates during exposure cycles are included in the calculation. The acceptable threshold for the upper limit of the 95% confidence interval is typically below 4 [55].
Ovulation Inhibition Assessment: Protocols for establishing ovulation inhibition involve regular monitoring of serum hormone levels. In recent trials, researchers measure serum estradiol (E2), progesterone, luteinizing hormone (LH), and follicle-stimulating hormone (FSH) at baseline, during treatment cycles (e.g., days 28±4 of cycles 3, 6, and 13), and during follow-up periods [55]. Ovulation is typically defined as a serum progesterone concentration >5 ng/mL, with suppressed ovulation indicated by consistently low progesterone levels throughout the treatment period.
Cycle Control Evaluation: Breakthrough bleeding (BTB) and irregular bleeding (IB) are assessed through daily patient diaries and standardized questionnaires. In network meta-analyses, these outcomes are evaluated using odds ratios with 95% confidence intervals, comparing different progestin types using standardized mean differences and random effects models [37]. Statistical analyses often employ network meta-analysis packages in STATA and R, assessing heterogeneity with I² statistics [37].
Research Reagent Solutions and Essential Materials
Table 4: Essential Research Reagents and Materials for Contraceptive Studies
| Reagent/Material | Function/Application | Research Context |
|---|---|---|
| Ethinyl Estradiol | Estrogen component for COC formulations | Positive control for estrogen-dependent effects; cycling animal models |
| Progestin Standards (Levonorgestrel, Desogestrel, Drospirenone, Norethindrone) | Reference compounds for receptor binding assays and pharmacokinetic studies | Quality control; standardization of experimental formulations |
| LH/FSH Immunoassays | Quantification of gonadotropin levels in serum/plasma | Assessment of hypothalamic-pituitary-ovarian axis suppression |
| Progesterone ELISA Kits | Determination of ovulation status | Efficacy endpoint measurement; confirmation of ovulation inhibition |
| Cervical Mucus Simulants | In vitro assessment of sperm penetration capability | Evaluation of POP primary mechanism of action |
| VTE Biomarker Panels (D-dimer, thrombin generation assays) | Assessment of thrombotic risk | Comparative safety profiling between COCs and POPs |
Research Implications for Hypogonadal/Hypergonadal Models
The distinct pharmacological profiles of COCs and POPs offer different applications for modeling contraceptive states in research settings. COCs, with their reliable ovulation suppression via potent negative feedback on the hypothalamic-pituitary-ovarian (HPO) axis, are particularly useful for creating hypogonadal models. The suppression of gonadotropins and subsequent inhibition of ovarian steroidogenesis creates a state of functional hypogonadism, useful for studying estrogen-progestin effects on extra-ovarian tissues [54].
POPs, with their variable effects on ovulation and primary action on cervical mucus, may be more appropriate for studies focusing on local reproductive tract effects or for populations with contraindications to estrogen. The recent approval of over-the-counter norgestrel POP enhances accessibility for large-scale population studies, though its specific applicability to hypogonadal models may be limited due to its less consistent suppression of the HPO axis [56].
When designing studies using these models, researchers should consider the specific research question: COCs for systemic hormonal manipulation and reliable ovulation suppression, versus POPs for local effects or safety considerations in vulnerable populations. The choice between specific progestins within each class should be informed by their distinct receptor binding affinities, metabolic profiles, and side effect spectra, as evidenced by network meta-analyses demonstrating different bleeding patterns and side effect profiles across progestin types [37].
Navigating Complexity: Challenges in Modeling and Optimizing Contraceptive Regimens
Addressing Inter-Individual and Intra-Individual Variability in Menstrual Cycles
Menstrual cycle research presents a complex challenge due to the significant interplay between inter-individual differences and intra-individual fluctuations across cycles. This review synthesizes evidence from large-scale observational studies, controlled experiments, and methodological frameworks to quantify these variabilities and their implications for research design. We examine how age, BMI, racial and ethnic factors, and baseline characteristics contribute to substantial differences in cycle parameters between individuals, while hormonal fluctuations and corpus luteum variability create meaningful within-person changes across consecutive cycles. The integration of hypogonadal and hypergonadal models provides a valuable framework for understanding oral contraceptive effects on brain structure and function in relation to naturally cycling women. By presenting standardized experimental protocols, quantitative benchmarks, and methodological recommendations, this review aims to equip researchers with tools to account for these multifaceted variabilities in study design, ultimately advancing personalized approaches in women's health research and drug development.
The menstrual cycle represents a dynamic biological system characterized by predictable yet variable fluctuations in reproductive hormones that regulate physiological functioning. Historically, clinical guidelines have described a median 28-day cycle with a consistent 14-day luteal phase, but emerging evidence from large-scale digital studies reveals substantially greater variability in both temporal and hormonal parameters [60]. This variability manifests at two distinct levels: inter-individual variability (differences in cycle characteristics between different women) and intra-individual variability (fluctuations in cycle characteristics across consecutive cycles within the same woman). Understanding these variabilities is crucial for designing robust experiments, interpreting findings in context, and developing personalized healthcare approaches.
The menstrual cycle is fundamentally a within-person process that should be treated as such in clinical assessment, experimental design, and statistical modeling [61]. The cycle begins with the first day of menses and ends the day before the subsequent bleeding onset, with the average cycle length traditionally estimated at 28 days. However, healthy cycles demonstrate natural variation between 21 days (potentially indicating polymenorrhoea) and 37 days (potentially indicating oligomenorrhoea) [61]. The follicular phase, named for the maturation of ovarian follicles containing oocytes, begins with menses onset and continues through ovulation, characterized by gradually rising estradiol (E2) levels and consistently low progesterone (P4). The subsequent luteal phase spans from the day after ovulation through the day before the next menses, marked by rising P4 and E2 levels produced by the corpus luteum [61].
Quantifying Inter-Individual Variability in Menstrual Cycles
Inter-individual variability in menstrual cycle characteristics reflects substantial differences between women based on demographic factors, anthropometric measurements, and genetic backgrounds. Large-scale observational studies utilizing menstrual tracking applications have provided unprecedented insights into the magnitude and patterns of these differences.
Age-Related Variations in Cycle Characteristics
Age represents one of the most significant determinants of menstrual cycle variability, with distinct patterns emerging across the reproductive lifespan. Analysis of 612,613 ovulatory cycles from 124,648 users revealed that mean cycle length decreased by 0.18 days (95% CI: 0.17–0.18, R² = 0.99) and mean follicular phase length decreased by 0.19 days (95% CI: 0.19–0.20, R² = 0.99) per year of age from 25 to 45 years [60]. The Apple Women's Health Study, encompassing 165,668 menstrual cycles, further demonstrated that individuals under 20 years old had menstrual cycles averaging 30.3 days—1.6 days longer than the 28.7-day average for those aged 35-39 years [62]. Cycle regularity also follows age-dependent patterns, with greater variability observed in adolescents (average 5.3 days variation in those under 20) and perimenopausal adults (average 11.2 days variation in those over 50), compared to minimal variability in mid-reproductive years (average 3.8 days variation for ages 35-39) [62].
Table 1: Age-Related Variations in Menstrual Cycle Characteristics
| Age Group | Mean Cycle Length (days) | Cycle Variability (days) | Follicular Phase Length (days) | Luteal Phase Length (days) |
|---|---|---|---|---|
| <20 years | 30.3 [62] | 5.3 [62] | Information Missing | Information Missing |
| 25-35 years | 29.3 [60] | 4.8 [62] | 16.9 [60] | 12.4 [60] |
| 35-39 years | 28.7 [62] | 3.8 [62] | Information Missing | Information Missing |
| 40-44 years | 28.2 [62] | 4-11 [62] | Information Missing | Information Missing |
| 45-50 years | 28.4 [62] | 4-11 [62] | Information Missing | Information Missing |
| >50 years | 30.8 [62] | 11.2 [62] | Information Missing | Information Missing |
Impact of BMI and Body Composition
Body mass index (BMI) demonstrates a significant association with both cycle length and regularity. Analysis of 612,613 cycles revealed that mean variation of cycle length per woman was 0.4 days or 14% higher in women with BMI >35 relative to women with BMI of 18.5–25 [60]. The Apple Women's Health Study further quantified these differences, showing that participants with healthy BMI (18.5-24.9 kg/m²) had cycles averaging 28.9 days with 4.6 days of variation, while those with BMI >40 kg/m² had significantly longer cycles (30.4 days) with greater variability (5.4 days) [62]. The proposed mechanism involves hormonal disruption, as adipose tissue produces estrogen independently of ovarian production, potentially leading to estrogen excess that disrupts normal menstrual rhythm [62].
Racial and Ethnic Differences
The Apple Women's Health Study identified significant variations in menstrual cycle characteristics across racial and ethnic groups, even after controlling for other factors. Compared to White participants (average cycle length 29.1 days), Black participants had slightly shorter cycles (28.9 days), while Hispanic and Asian participants had substantially longer cycles averaging 29.8 days and 30.7 days, respectively [62]. Cycle variability followed similar patterns, with White and Black participants showing approximately 4.8 days of variation, compared to 5.09 days for Hispanic participants and 5.04 days for Asian participants [62]. These differences may reflect differential exposures to social, cultural, and environmental stressors that affect menstrual health, though underlying mechanisms require further investigation.
Baseline Neurocognitive Differences
Inter-individual variability extends to neurocognitive responses across the menstrual cycle, particularly in domains involving inhibitory control. Research examining basal ganglia function during a Stop Signal Task revealed that women with higher baseline inhibitory control showed impaired performance (longer stop signal reaction times) during the pre-ovulatory phase compared to menses, while women with lower baseline inhibitory control demonstrated the opposite pattern [63]. This interaction between cycle phase and baseline characteristics highlights the importance of considering individual differences when studying cycle effects on brain function and behavior.
Quantifying Intra-Individual Variability in Menstrual Cycles
Intra-individual variability encompasses fluctuations in cycle parameters across consecutive cycles within the same woman, presenting methodological challenges for research design and interpretation.
Phase Length Variability
The follicular and luteal phases contribute differentially to overall cycle variability. Analysis of 1,060 cycles from 141 participants found that 69% of variance in total cycle length could be attributed to variance in follicular phase length, whereas only 3% of variance was attributed to luteal phase length [61]. This pattern reflects the relatively fixed lifespan of the corpus luteum (average 13.3 days, SD = 2.1; 95% CI: 9-18 days) compared to the more variable follicular phase (average 15.7 days, SD = 3; 95% CI: 10-22 days) [61]. In a study of 458 nongestational cycles, the LH peak—indicating the presumed ovulatory window—occurred at 14.7 ± 2.4 days, demonstrating substantial cycle-to-cycle variability in ovulation timing [64].
Physiological and Endothelial Variability
Intra-individual variability extends beyond temporal parameters to encompass physiological systems. A study of endothelial function across two consecutive menstrual cycles found that phase changes in flow-mediated dilatation (FMD) were not consistent at the individual level [65]. Only 29% of participants exhibited directionally consistent phase changes in FMD across cycles, challenging the utility of interpreting individual responses based on a single cycle assessment [65]. Fluctuations in estrogen levels between cycles potentially contributed to this variability, highlighting the dynamic nature of vascular responses across consecutive cycles.
Neurocognitive and Behavioral Variability
Intra-individual variability in inhibitory control and related neural processes presents particular challenges for research design. Women performing a Stop Signal Task across multiple cycle phases demonstrated no main effect of cycle phase on stop signal reaction time (SSRT), but revealed significant interactive effects between cycle phase and baseline inhibitory control [63]. Blood oxygen level-dependent (BOLD) response in bilateral putamen significantly decreased during the luteal phase, and connectivity strength from the left putamen displayed interactive effects of cycle and inhibitory control [63]. These findings suggest that menstrual cycle effects on cognition are not uniform across women or across cycles, but depend on individual characteristics and neural baseline states.
Hypogonadal and Hypergonadal Models in Oral Contraceptive Research
Hypogonadal and hypergonadal models provide valuable frameworks for understanding how oral contraceptives (OCs) modulate brain structure and function relative to naturally cycling women. These models conceptualize OC effects in terms of their impact on endogenous hormone production and action in the brain.
Neurostructural Alterations with Oral Contraceptive Use
Neuroimaging studies demonstrate that oral contraceptive use is associated with significant structural alterations in hypothalamic-pituitary circuitry. A prospective cohort study comparing 21 OCP users to 29 naturally cycling women found that hypothalamic (B = -81.2 ± 24.9, p = 0.002) and pituitary (B = -81.2 ± 38.7, p = 0.04) volumes were significantly smaller in OC users [28]. These findings suggest a structural correlate of central OC effects, potentially related to interference with known trophic effects of sex hormones. The hypothalamic volume reduction is particularly notable given the hypothalamus' role as the source of signals regulating the female reproductive cycle and its extensive connections to limbic structures involved in emotion, sexual behavior, and memory [28].
Functional Connectivity Patterns
Resting-state functional connectivity studies provide insights into how OCs alter intrinsic network connectivity underlying multiple behavioral domains. The preponderance of evidence indicates that as the menstrual cycle proceeds from a low to high progesterone state in naturally cycling women, prefrontal connectivity increases and parietal connectivity decreases [5]. OCs tend to mimic this connectivity pattern despite overall reductions in endogenous steroid hormone levels, suggesting that OCs may produce a hyperprogestogenic state in the brain [5]. This model positions OC effects as creating a mixed hormonal state characterized by overall hypogonadism (reduced endogenous hormone production) with specific hyperprogestogenic actions in neural circuits.
Table 2: Comparative Effects of Natural Cycles vs. Oral Contraceptives on Brain Structure and Function
| Parameter | Naturally Cycling Women | Oral Contraceptive Users | Research Implications |
|---|---|---|---|
| Hypothalamic Volume | Reference standard | Significant reduction (B = -81.2 ± 24.9, p = 0.002) [28] | Potential long-term effects on reproductive circuitry |
| Pituitary Volume | Reference standard | Significant reduction (B = -81.2 ± 38.7, p = 0.04) [28] | Altered feedback mechanisms in HPA axis |
| Functional Connectivity | Prefrontal connectivity increases, parietal connectivity decreases in luteal phase [5] | Mimics luteal phase pattern despite lower hormone levels [5] | Suggests hyperprogestogenic state in brain |
| Hormonal State | Cyclical fluctuations in E2 and P4 | Suppressed endogenous hormones with synthetic hormone exposure | Hypogonadal model with tissue-specific effects |
Methodological Considerations and Experimental Protocols
Robust menstrual cycle research requires careful attention to methodological details, including phase verification, sampling strategies, and statistical approaches that account for multiple sources of variability.
Phase Verification and Hormonal Assessment
Accurate determination of menstrual cycle phases requires multimodal assessment beyond self-reported cycle day. The gold standard approach combines hormonal assays with ovulation confirmation:
- Menstrual bleeding dates: Document first day of menstruation (cycle day 1) and bleeding characteristics [61]
- Ovulation testing: Use urinary luteinizing hormone (LH) tests to detect the LH surge preceding ovulation [60] [61]
- Hormonal assessment: Analyze estradiol and progesterone levels from saliva or blood samples [63]
- Basal body temperature (BBT): Track BBT to detect the post-ovulatory temperature rise [60]
- Cycle length criteria: Define acceptable range (e.g., 21-35 days) and exclude outliers [60]
This multimodal approach is essential for valid phase classification, as studies relying solely on calendar-based estimates misclassify ovulation timing in a substantial proportion of cycles.
Sampling Strategies and Statistical Power
Menstrual cycle studies must account for both within-subject and between-subject variability through appropriate sampling designs:
- Repeated measures designs: Collect data from the same individuals across multiple cycle phases [61]
- Multiple cycle assessment: Include at least two consecutive cycles to account for intra-individual variability [65] [61]
- Phase-specific sampling: Schedule assessments based on biologically-defined phases rather than fixed cycle days [61]
- Minimum observations: Collect at least three observations per person to estimate random effects in multilevel models [61]
Studies investigating between-person differences in within-person changes across the cycle benefit from three or more observations across two cycles, allowing greater confidence in reliability estimates [61].
Statistical Modeling Approaches
Appropriate statistical models must account for the nested structure of menstrual cycle data:
- Multilevel modeling: Account for within-person and between-person variance components [61]
- Circular or periodic models: Address the cyclical nature of menstrual data [61]
- Phase coding schemes: Define phases based on biological markers rather than arbitrary cycle divisions [61]
- Covariate adjustment: Include relevant factors such as age, BMI, and cycle regularity [60] [62]
Research Reagent Solutions and Methodological Tools
High-quality menstrual cycle research requires specific methodological tools and assessment protocols to ensure valid phase classification and hormone measurement.
Table 3: Essential Methodological Tools for Menstrual Cycle Research
| Tool Category | Specific Assessment | Research Application | Implementation Example |
|---|---|---|---|
| Ovulation Confirmation | Urinary LH tests | Detecting LH surge preceding ovulation by 24-48 hours [60] [64] | Home test kits with digital readers for objective timing |
| Hormone Assessment | Salivary/Serum E2 and P4 | Quantifying phase-specific hormone levels [63] | Radioimmunoassay or LC-MS/MS for precise measurement |
| Cycle Tracking | Basal Body Temperature (BBT) | Detecting post-ovulatory temperature rise [60] | Digital thermometers with memory function |
| Symptom Monitoring | Daily symptom ratings | Assessing cyclical symptom patterns (e.g., C-PASS for PMDD) [61] | Electronic diaries with time stamps for compliance |
| Phase Classification | Combined hormonal/temporal criteria | Defining biologically-verified cycle phases [61] | Algorithmic phase assignment based on multiple markers |
The comprehensive assessment of inter-individual and intra-individual variability in menstrual cycles reveals complex patterns that significantly impact research design and interpretation. Large-scale observational studies demonstrate substantial differences in cycle characteristics based on age, BMI, and racial/ethnic background, while controlled experiments reveal meaningful fluctuations in physiological and neurocognitive parameters across consecutive cycles within individuals. The integration of hypogonadal and hypergonadal models provides a valuable framework for understanding oral contraceptive effects on brain structure and function relative to naturally cycling women.
Future research should prioritize standardized methodological approaches that account for these multiple sources of variability, including biologically-verified phase definitions, repeated measures across multiple cycles, and appropriate statistical models that separate within-person and between-person effects. Additionally, studies examining the long-term implications of cycle variability and oral contraceptive use on health outcomes will strengthen the evidence base for personalized treatment approaches. By adopting these rigorous methodologies, researchers can advance our understanding of menstrual cycle dynamics and their implications for women's health across the lifespan.
Model Comparison: Capabilities in Mimicking Human Reproductive Biology
Advanced in vitro models are revolutionizing the study of female reproductive biology, moving beyond simplistic hormonal suppression to incorporate complex tissue-level responses. The following table compares three key model types used in contemporary research.
| Model Type | Key Characteristics | Physiological Replication | Primary Applications in Contraceptive Research |
|---|---|---|---|
| Organoids [66] | 3D cell constructs derived from tissue stem cells mimicking originating tissue. | Recapitulates endometrial biology and menstrual cycle; models diseases like endometriosis. [66] | Study of molecular mechanisms in healthy and diseased states; drug screening. [66] |
| Cervix-on-a-Chip [67] | Microfluidic device with cervical epithelial-stromal interface under dynamic flow. | Functional epithelial barrier; hormone-responsive mucus production; innate immune responses. [67] | Host-microbiome interactions (e.g., healthy vs. dysbiotic); therapeutic intervention testing. [67] |
| Static Transwell Cultures [67] | Planar cultures or inserts with porous membranes. | Limited mucus production; fails to recapitulate physiological tissue-tissue interfaces and dynamic interactions. [67] | Basic study of cell interactions with bacteria and microbicides; limited by short-term viability with microbes. [67] |
Experimental Data: Quantifying Hormonal and Model Effects
Cervical Mucus Proteomic Changes in Stimulated vs. Natural Cycles
Proteomic analysis of cervical mucus reveals significant quantitative changes induced by hormonal stimulation during fertility treatments, highlighting its sensitivity to endocrine status. [68]
| Parameter | Natural Cycle (IUI) | Stimulated Cycle (IVF) |
|---|---|---|
| Total Proteins Identified | 4370 (Collective across all samples) | 4370 (Collective across all samples) |
| Average Proteins/Sample | 97 ± 70 (Excluding outliers) | 1640 ± 428 (Excluding outliers) |
| Differentially Enriched Proteins | 199 | 422 |
| Key Biological Processes | Phosphatidic acid synthesis; response to external stimulus; neutrophil degranulation. [68] | Neutrophil degranulation; cornified envelope formation; hemostasis. [68] |
Hormonal Contraceptive Impact on Steroid Hormones
Hormonal contraceptives (HCs), particularly oral pills, exert systemic effects beyond ovulation suppression by altering the levels of other steroid hormones, which may influence the cervical and endometrial environment. [22]
| Hormone | Observed Effect of Hormonal Contraceptives |
|---|---|
| Testosterone | Significantly reduced total, free, and salivary levels. [22] |
| DHEAS | Significantly reduced levels. [22] |
| Cortisol | Increased total cortisol in blood; blunted salivary cortisol response to social stressors. [22] |
Experimental Protocols for Key Methodologies
This protocol is optimized for non-invasive sampling to assess the functional status of the endometrial tissue and the entire female reproductive tract.
- Step 1: Patient Selection and Sampling. Collect cervical mucus samples during the peri-ovulation period. For standardized timing, sample at the time of ovum pick-up in IVF cycles with controlled ovarian hyperstimulation. Compare with samples from women in natural cycles (e.g., undergoing intrauterine insemination due to male factor infertility).
- Step 2: Sample Processing and LC-MS Analysis. Perform liquid chromatography-mass spectrometry (LC-MS) analysis in a single batch to ensure stability. Use a quality control peptide (e.g., doubly charged YICDNQDTISSK) to monitor retention time, peak height, and mass error, ensuring relative standard deviation (RSD) remains below 15% and mass error below 3 ppm.
- Step 3: Data Processing and Quantification. Process raw data using software such as ProteomeDiscoverer 2.5. Utilize feature detectors like the Minora node to link peptide identification across samples based on retention times and tandem mass spectra for robust quantitative analysis.
This protocol details the creation of a microfluidic model that replicates the cervical epithelial-stromal interface and allows for long-term host-microbiome studies.
- Step 1: Chip Seeding and Culture. Use a microfluidic chip with two channels separated by a porous extracellular matrix (ECM)-coated membrane. Seed primary human cervical stromal fibroblasts on the lower surface of the membrane and a commercially available mixture of primary human cervical epithelial cells on the top surface.
- Step 2: Flow Conditioning and Differentiation. Culture under dynamic flow conditions to promote physiological maturity. Two regimens can be tested: continuous apical perfusion (40 μL/hr) or periodic perfusion (30 μL/hr for 4 hours, then static for 20 hours). The lower channel is continuously perfused with stromal growth medium. After cell expansion, replace the apical medium with a differentiation medium at a slightly acidic pH (e.g., HBSS at ~pH 5.4) and the stromal medium with differentiation medium containing 5 nM estradiol-17β (E2) for 7 days.
- Step 3: Inoculation and Analysis. Inoculate the differentiated chips with defined microbial consortia (e.g., Lactobacillus crispatus for a healthy state or Gardnerella vaginalis for dysbiosis). The model allows for co-culture for multiple days, after which outcomes like innate immune responses, barrier function, cell viability, and proteomic changes can be analyzed.
Signaling Pathways in Endometrial and Cervical Biology
Endometrial Development and Hormonal Response
The development and cyclical regeneration of the endometrium are governed by a complex interplay of transcription factors, signaling molecules, and steroid hormones. [66] [69]
Hormonal Contraceptive Effects on the HPT and HPA Axes
Hormonal contraceptives, containing progestins with or without estrogens, primarily suppress the hypothalamic-pituitary-testicular (HPT) axis in men, a mechanism similar to the suppression of the hypothalamic-pituitary-ovarian axis in women. [22] [70] These regimens also exert secondary effects on adrenal hormones.
The Scientist's Toolkit: Essential Research Reagents and Materials
Successful implementation of the described models requires specific biological materials and reagents. The following table details key components for building these complex in vitro systems.
| Item | Function/Description | Example Application |
|---|---|---|
| Primary Human Cervical Epithelial Cells [67] | Forms the mucus-producing, hormone-responsive lining of the model. Often a mixture of endo- and ecto-cervical cells. | Seeding the epithelial channel of the Cervix Chip to study host-microbiome interactions and mucus changes. [67] |
| Primary Human Cervical Stromal Fibroblasts [67] | Provides the underlying stromal support, crucial for forming a physiological tissue-tissue interface. | Co-culture with epithelial cells in the stromal channel of the Cervix Chip to replicate the epithelial-stromal junction. [67] |
| Microfluidic Chip (e.g., Emulate Inc.) [67] | The physical platform featuring two parallel microchannels separated by a porous, ECM-coated membrane. | Creates the 3D microenvironment necessary for the Cervix Chip, allowing for independent perfusion and cell seeding. [67] |
| Estradiol-17β (E2) [67] | The primary estrogenic hormone used to differentiate cells and mimic the follicular phase of the menstrual cycle. | Added to differentiation medium (e.g., 5 nM) to induce a secretory, mucus-producing phenotype in cervical epithelial cells. [67] |
| Wheat Germ Agglutinin (WGA) Lectin [67] | A fluorescently labeled lectin that binds to glycans on major mucus proteins like MUC5B. | Used to stain and visualize the mucus layer produced on the surface of the Cervix Chip epithelium. [67] |
| Defined Microbial Consortia [67] | Specific bacterial communities used to inoculate the model (e.g., L. crispatus for health, G. vaginalis for dysbiosis). | Studying the impact of different microbiomes on cervical barrier function, innate immunity, and mucus composition. [67] |
The evolution of combined oral contraceptives (COCs) has been characterized by a consistent reduction in estrogen dosage to mitigate cardiovascular risks, particularly venous thromboembolism (VTE). This pursuit of safer formulations, however, introduces a significant therapeutic challenge: the destabilization of endometrial integrity leading to breakthrough bleeding (BTB). Within hypogonadal hypergonadal research models, this represents a fundamental tension between risk reduction and patient adherence. BTB is not merely a nuisance side effect; it constitutes a primary cause of COC discontinuation, which subsequently contributes to approximately 20% of the 3.5 million annual unintended pregnancies in the United States [71]. The estrogen component, typically ethinylestradiol (EE), plays a critical role in maintaining endometrial vasculature, meaning that dose reduction strategies must carefully balance the benefits of improved safety profiles against the risk of impaired cycle control and subsequent non-adherence [72] [71]. This review examines the quantitative relationship between estrogen dose, progestin type, and bleeding outcomes to inform future contraceptive development.
Quantitative Comparison of Hormonal Formulations and Bleeding Profiles
Systematic Analysis of Estrogen Dose and Progestin Type on Breakthrough Bleeding
Table 1: Impact of EE Dose and Progestin Type on Breakthrough Bleeding Incidence Over Time
| Progestin Type | EE Dose (μg) | BTB Incidence Month 1 (%) | BTB Incidence Month 3 (%) | Time to Baseline Bleeding Pattern | Key Findings |
|---|---|---|---|---|---|
| Various (Desogestrel, Drospirenone, Gestodene, Levonorgestrel) | 15 | 25-35% | 15-20% | >6 months | Slowest resolution, significant persistent BTB [71] |
| Various (Desogestrel, Drospirenone, Gestodene, Levonorgestrel) | 20 | 20-30% | 10-15% | 3-6 months | Moderate resolution, some persistent BTB [71] |
| Various (Desogestrel, Drospirenone, Gestodene, Levonorgestrel) | 30 | 15-25% | ~5% (near baseline) | ~3 months | Rapid resolution, returns to baseline ~1.68% [71] |
| Norethindrone Acetate (NETA) | 10 | High | High | Not achieved | "Too low" dose; suboptimal bleeding profile [72] |
| Drospirenone (DRSP) | 15 (as Estetrol, E4) | Moderate | Low | Predictable schedule | Novel estrogen; predictable scheduled bleeding [72] |
| Levonorgestrel (LNG) | 20 (in 24/4 regimen) | -- | -- | Favorable | Common reference in clinical trials [72] |
Table 2: Bleeding Profile Comparison of Novel vs. Traditional Estrogens in COCs
| Formulation | Estrogen Type | Scheduled Bleeding Profile | Unscheduled Bleeding/Spotting | Key Endometrial Stability Characteristics |
|---|---|---|---|---|
| Traditional COCs | Ethinylestradiol (EE) | Regular with sufficient dose (>20μg) | Low with sufficient dose | EE balances progestin effects on endometrium [72] |
| E2V/DNG (Qlaira/Natazia) | Estradiol Valerate (E2V) | Less predictable | Increased | E2V leads to suboptimal bleeding profile due to endometrial destabilization [72] |
| E2/NOMAC (Zoely) | Estradiol (E2) | Less predictable | Increased | Replacement of EE by E2 leads to suboptimal bleeding profile [72] |
| E4/DRSP (Nextstellis) | Estetrol (E4) | Predictable and regular | Low | Stable scheduled bleeding profile while minimizing VTE risk [72] |
| POP (DRSP-only) | None (Progestin-only) | Absence of scheduled bleeding | Higher rate | Lacks estrogen stabilization; higher unscheduled bleeding [72] |
Key Findings from Comparative Data Analysis
The data reveal a clear dose-response relationship between EE and bleeding control. Higher EE doses (30μg) achieve rapid stabilization of the endometrium, typically returning BTB to near-baseline levels (approximately 1.68%) within three months. In contrast, lower-dose formulations (15-20μg EE) require substantially longer stabilization periods—often exceeding six months for the lowest doses—which creates a critical window of vulnerability for treatment discontinuation [71]. This timeline is crucial for both clinical counseling and trial design.
The development of novel estrogens represents a promising frontier. Estetrol (E4) demonstrates that alternative estrogenic compounds can provide adequate endometrial stabilization without the thrombotic risk profile associated with EE, offering a more favorable benefit-risk ratio [72]. Conversely, the replacement of EE with natural estrogens like estradiol (E2) or estradiol valerate (E2V) often results in suboptimal bleeding profiles, highlighting the unique pharmaceutical properties of EE in maintaining endometrial integrity [72].
Experimental Models and Methodologies for Assessing Endometrial Stability
Standardized Definitions and Data Collection in Clinical Trials
The accurate assessment of bleeding patterns requires rigorous methodological standardization. The field has moved away from the World Health Organization's 90-day reference period toward the more nuanced definitions established by Mishell et al. (2007), which critically distinguish between scheduled and unscheduled bleeding events [72]:
- Scheduled (Withdrawal) Bleeding: Any bleeding or spotting that occurs during hormone-free intervals, regardless of regimen duration, and may continue into the first four days of the subsequent active cycle.
- Unscheduled Bleeding: Any bleeding that occurs while taking active hormones, with specific exceptions for bleeding continuing from the hormone-free interval and bleeding during the first seven days of the initial cycle.
- Spotting: Minimal blood loss not requiring new sanitary protection.
- Bleeding: Evidence of blood loss requiring the use of sanitary protection.
These standardized definitions are essential for cross-trial comparisons and meta-analyses, as they eliminate the confounding factor of inconsistent terminology that has historically plagued the field [72].
Model-Based Meta-Analysis (MBMA) Framework
Experimental Protocol 1: MBMA for Quantitative Dose-Response Characterization
The development of a Model-Based Meta-Analysis (MBMA) represents a sophisticated quantitative approach to synthesizing bleeding data across multiple clinical trials [71]:
- Systematic Literature Review & Data Extraction: Comprehensive search across PubMed, Cochrane, and EMBASE databases using predefined terms ("hormonal contraceptives," "breakthrough bleeding," "intermenstrual bleeding") with strict inclusion/exclusion criteria.
- Data Standardization: Normalization of BTB definitions across studies to include any bleeding episode during active hormone intake, excluding initial cycle days (1-7 of first cycle, days 1-4 of subsequent cycles).
- Handling of Missing Data: For cycles with <100 subjects (where BTB event probability is <1%), imputation using baseline unscheduled bleeding rate (1.68%) observed in pre-treatment populations (n=44,420 subjects).
- Covariate Analysis: Assessment of progestin type, EE dose, time, and demographic factors using Imputation by Individual Parameter (IIP) methodology to handle missing covariates while maintaining parameter-covariate correlations.
- Model Verification & Simulation: Development of a structural model characterizing BTB over time, followed by simulation of different progestin/EE combinations to compare bleeding outcomes.
This MBMA framework enables researchers to overcome the limitations of head-to-head trial comparisons and establish robust dose-response relationships despite heterogeneous source data [71].
Clinical Management Protocols for Persistent Breakthrough Bleeding
Experimental Protocol 2: Clinical Algorithm for BTB Management
For practicing clinicians and trialists managing subjects with BTB, a standardized assessment algorithm is recommended [71]:
- Initial Assessment (Months 1-3): Reassurance during the initial stabilization period, as BTB is most prevalent in the first month but typically subsides within three months for adequate EE doses (>20μg).
- Persistent BTB Evaluation (>3 months):
- Conduct physical examination and laboratory tests to rule out underlying pathology.
- Assess treatment adherence and potential drug-drug interactions.
- Consider short-term supplemental estrogen or NSAIDs for symptom alleviation.
- Therapeutic Modification:
- Switch to a COC with a different progestin.
- Increase EE dose (e.g., from 20μg to 30μg) based on the established dose-response relationship.
- Consider extended-cycle regimens (e.g., 24/4 vs. 21/7) to improve bleeding stability.
Diagram Title: Clinical Management Path for Breakthrough Bleeding
Molecular Mechanisms of Endometrial Stability and Bleeding
The endocrine basis of breakthrough bleeding involves complex interactions between estrogen and progestin components at the endometrial level. In COCs, progestins are primarily responsible for the contraceptive effect through suppression of ovulation, but they also impair endometrial vascular integrity, potentially leading to BTB [71]. The estrogenic component counters this effect by stabilizing the endometrium and promoting vascular integrity [72]. This delicate balance becomes disrupted when estrogen doses are insufficient to counteract the progestin's effects on the endometrium.
The molecular mechanism involves estrogen-mediated maintenance of endometrial blood vessel stability and regulation of vascular endothelial growth factor (VEGF) expression. When EE doses are too low (e.g., 10μg), this stabilizing effect is inadequate, resulting in fragile vessels and subsequent breakthrough bleeding [72]. Different progestins exhibit varying degrees of endometrial effects, though clinical differences are often subtle compared to the dominant influence of the estrogen dose [73].
Diagram Title: Endometrial Stability Hormonal Balance Mechanism
The Scientist's Toolkit: Essential Research Reagents and Materials
Table 3: Key Research Reagents for Hormonal Contraceptive Studies
| Reagent/Material | Function in Research | Application Context |
|---|---|---|
| Standardized Bleeding Diaries | Daily patient-recorded bleeding/spotting episodes | Essential for consistent data collection in clinical trials; enables classification by Mishell criteria [72] |
| Ethinylestradiol Reference Standards | Dose-response calibration and bioavailability studies | Quantifying endometrial stabilization effects across dosage ranges (10-30μg) [72] [71] |
| Progestin Panel (LNG, DRSP, DSG, GSD, NETA) | Comparative assessment of endometrial effects | Evaluating class-specific contributions to BTB in combination with EE [72] [71] |
| Novel Estrogen Compounds (E4, E2, E2V) | Alternative estrogen mechanism studies | Investigating endometrial effects beyond traditional EE [72] |
| Model-Based Meta-Analysis (MBMA) Software | Quantitative integration of heterogeneous trial data | Establishing dose-response relationships across multiple studies [71] |
| Serum Hormone Assay Kits | Monitoring endogenous hormone suppression | Verifying HPG axis suppression in hypogonadal models [74] |
The practical hurdle of balancing estrogen dose reduction with acceptable cycle control remains a central challenge in oral contraceptive development. Quantitative evidence demonstrates a clear trade-off: lower estrogen doses reduce thrombotic risk but increase the incidence and duration of breakthrough bleeding, particularly during the critical first three months of use. Future research should focus on two parallel paths: first, optimizing the use of existing compounds through refined dosing strategies and improved patient selection; and second, developing novel estrogenic compounds like estetrol (E4) that may offer improved safety profiles without sacrificing endometrial stability. For researchers and drug developers, the application of sophisticated quantitative methods like Model-Based Meta-Analysis provides a powerful tool for navigating this complex therapeutic landscape and informing the design of next-generation contraceptive agents.
The interplay between peak serum levels and the dosing interval represents a fundamental pharmacokinetic challenge in drug development. Achieving therapeutic efficacy while minimizing toxicity requires a delicate balance, where the dosing regimen must account for the drug's absorption, distribution, and elimination characteristics. This balance becomes particularly crucial in endocrine pharmacology, where the hypothalamic-pituitary-gonadal (HPG) axis exhibits complex feedback mechanisms sensitive to hormonal fluctuations. Drug accumulation, a phenomenon occurring when repeated dosing outpaces elimination, sits at the heart of this challenge. It is a natural consequence of dosing frequency relative to a drug's half-life and is quantified by the accumulation ratio (AR), which predicts steady-state levels from single-dose data [75]. This review explores these pharmacokinetic principles within the context of hypogonadal and hypergonadal models and oral contraceptive effects, providing a comparative analysis of therapeutic interventions and their underlying experimental approaches.
Theoretical Foundations of Drug Accumulation
The relationship between dosing intervals and drug accumulation is governed by predictable pharmacokinetic principles. When a drug is administered at intervals shorter than its elimination time, it accumulates in the body until a steady state is reached. The degree of this accumulation can be precisely calculated using the accumulation ratio (AR). Two primary methods exist for determining AR:
The first method uses the elimination rate constant (k) and the dosing interval (τ) in the equation: AR = 1 / (1 - e^(-kτ)) This formula requires an accurate determination of the elimination rate constant, which can be derived from drug clearance, volume of distribution, or terminal half-life [75].
The second method utilizes observed clinical data, comparing exposure parameters after a single dose to those at steady state using the formula: AR = AUCτ,ss / AUCτ,sd where AUCτ,ss is the area under the curve at steady state over the dosing interval, and AUCτ,sd is the same parameter after a single dose [75]. This method is particularly valuable for drugs with complex elimination patterns or when k cannot be reliably estimated.
Understanding accumulation is critical for dosing regimen design, as it directly impacts both therapeutic success and safety profiles. Excessive accumulation can lead to toxicity, while insufficient accumulation may result in subtherapeutic effects, especially for drugs with narrow therapeutic windows.
Comparative Pharmacokinetics in Endocrine Therapies
Androgen-Induced Hypogonadism and Recovery Dynamics
The suppression of the hypothalamic-pituitary-gonadal axis (HPGA) following androgen abuse, termed Prolonged Post-Androgen Abuse Hypogonadism (PPAAH), exemplifies the clinical consequences of sustained exogenous hormone exposure. PPAAH is defined as persistent hypogonadism lasting at least six months after cessation of androgen abuse in individuals with a cumulative exposure of at least 150 mg per week for six months [20]. The proposed mechanisms for this prolonged suppression include alterations at the pituitary and/or hypothalamic levels, potentially involving the kisspeptin-neurokinin B-dynorphin (KNDy) network, which is crucial for normal gonadotropin-releasing hormone (GnRH) secretion [20]. Additional mechanisms may involve testicular changes, including persistent impairment of Leydig cell function evidenced by decreased insulin-like factor 3 (INSL3) levels years after cessation [20].
Table 1: Pharmacokinetic and Pharmacodynamic Profile of Selected Endocrine Therapies
| Therapeutic Agent / Condition | Key Pharmacokinetic Parameters | Impact on Endocrine Axis | Clinical Monitoring Parameters |
|---|---|---|---|
| Androgen Abuse (PPAAH) | Variable half-lives based on esterification (e.g., propionate, enanthate, undecanoate); supraphysiological dosing [20] | Suppression of HPGA via negative feedback; potential irreversible Leydig cell damage [20] | Total testosterone, LH, FSH, INSL3, testicular volume [20] |
| Combined Oral Contraceptive (EE/LNG) | Lower AUC and Cmax for EE in obese vs. normal-weight women; similar trough levels [76] | Suppression of HPO axis; variable ovarian follicular suppression by BMI [76] | Ethinyl Estradiol (EE) and Levonorgestrel (LNG) levels; follicular development via sonography [76] |
| Non-hormonal Male Contraceptive (YCT-529) | Dose-proportional PK from 10-180 mg; no clear food effect; half-life supports once-daily dosing [77] | No impact on FSH, LH, testosterone, or SHBG; targets retinoic acid signaling in testes [77] | Sperm count (in efficacy studies); safety and tolerability per Phase 1 protocols [77] |
| Nedosiran (RNAi therapy) | Body weight and renal function (eGFR) as key covariates for exposure; dosing adjusted by weight [78] | Silences lactate dehydrogenase (LDH) mRNA in hepatocytes, reducing oxalate production [78] | Spot urine oxalate-to-creatinine ratio (Uox/Cr); plasma oxalate levels [78] |
Oral Contraceptives and Body Weight Considerations
The pharmacokinetics of combined oral contraceptives (OCs) demonstrate how patient factors can significantly alter drug exposure and potentially impact efficacy. A comparative study of ethinyl estradiol (EE) and levonorgestrel (LNG) in normal-weight (BMI 19.0-24.9) versus obese (BMI 30.0-39.9) women revealed significant differences. Obese women had a lower area under the curve (AUC) (1077.2 pgh/mL vs. 1413.7 pgh/mL) and lower maximum concentration (Cmax) (85.7 pg/mL vs. 129.5 pg/mL) for EE compared to normal-weight women [76]. These findings suggest a larger volume of distribution for these lipophilic steroids in obese individuals. Despite these differences in peak exposure, trough levels (Cmin) were similar between groups, and the observed pharmacokinetic differences did not translate into statistically significant differences in ovarian follicular activity in this small study [76].
Novel Therapeutic Mechanisms and Dosing Strategies
Emerging therapies highlight sophisticated approaches to managing peak and trough concentrations. Nedosiran, an RNA interference therapy for primary hyperoxaluria type 1, utilizes a GalNAc ligand to target hepatocytes specifically, enhancing liver exposure while minimizing renal clearance [78]. Its pharmacokinetics are influenced by body weight and renal function, leading to a weight-based dosing regimen (3.5 mg/kg once monthly) to achieve consistent exposure and effect across age groups [78]. Similarly, the non-hormonal male contraceptive YCT-529, a retinoic acid receptor-α antagonist, exhibited favorable pharmacokinetics in a Phase 1a trial, with dose-proportional increases in exposure and no effect on LH, FSH, or testosterone levels, confirming its non-hormonal mechanism [77].
Table 2: Key Experimental Protocols in Endocrine Pharmacokinetic Research
| Experimental Method | Protocol Summary | Primary Outcome Measures | Application in Cited Research |
|---|---|---|---|
| Pharmacokinetic (PK) Profiling | Serial blood sampling over 24h during third week of OC cycle; non-compartmental analysis for AUC, Cmax, Tmax, Cmin [76] | Concentration-time curves, elimination half-life, peak-trough fluctuation [76] | Comparing OC PK in normal weight vs. obese women [76] |
| Phase 1 Single Ascending Dose (SAD) Trial | Double-blind, placebo-controlled study with sentinel dosing; PK sampling up to 144h post-dose; safety monitoring [77] | Incidence of AEs, vital signs, ECG, clinical labs, PK parameters (Cmax, Tmax, AUC, t½) [77] | Establishing safety and PK of YCT-529 male contraceptive [77] |
| Population PK/PD Modeling | Nonlinear mixed-effects modeling using data from multiple trials; covariate analysis (weight, eGFR); simulation of dosing regimens [78] | Parameter estimates for clearance, volume; impact of covariates; model-based dose recommendations [78] | Supporting nedosiran pediatric dosing (3.5 mg/kg Q1M) [78] |
| HPGA Axis Function Assessment | Measurement of testosterone, LH, FSH; GnRH stimulation test; hCG stimulation test; INSL3 as Leydig cell biomarker [20] | Basal and stimulated hormone levels; assessment of central vs. testicular dysfunction [20] | Investigating prolonged hypogonadism post-androgen abuse [20] |
Experimental Models and Methodologies
Assessing Hypogonadal States
Research into hypogonadism employs specific experimental models to dissect the level of endocrine disruption. In the context of PPAAH, the assessment includes measuring baseline testosterone, LH, and FSH to characterize the hypogonadotropic state. More specialized tests include the GnRH stimulation test to evaluate pituitary responsiveness and the hCG stimulation test to assess testicular Leydig cell reserve [20]. The measurement of insulin-like factor 3 (INSL3), a biomarker indicative of Leydig cell functional capacity, has proven valuable in demonstrating persistent impairment even years after androgen cessation [20]. These combined methodologies allow researchers to determine whether the primary defect lies at the hypothalamic/pituitary level (central) or within the testes themselves.
Oral Contraceptive Pharmacodynamics
The experimental protocol for evaluating oral contraceptives extends beyond simple pharmacokinetics to incorporate direct measures of biological effect. As demonstrated in one study, researchers combined intensive 24-hour PK sampling with twice-weekly transvaginal sonography to monitor follicular development and periodic blood draws to measure endogenous estradiol and progesterone [76]. This comprehensive approach allows for direct correlation of systemic drug concentrations with the primary therapeutic endpoint—suppression of ovarian activity. The finding that greater EE AUC was associated with smaller follicular diameters (p=0.05) and lower endogenous E2 levels (p=0.04) provides critical evidence linking pharmacokinetics to pharmacodynamic effect [76].
Signaling Pathways and Research Tools
The Hypothalamic-Pituitary-Gonadal (HPG) Axis
The HPG axis is a central regulatory system in endocrinology, and its manipulation is the target of many therapeutic interventions. The following diagram illustrates the key components and feedback mechanisms of this axis, highlighting sites of intervention for various endocrine therapies.
Diagram Title: HPG Axis and Therapeutic Intervention Sites
This diagram illustrates the core feedback loops of the HPG axis. Key regulatory elements include KNDy neurons (kisspeptin-neurokinin B-dynorphin), which stimulate pulsatile GnRH release [20]. GnRH then triggers pituitary secretion of LH and FSH, which act on the gonads to produce testosterone, inhibin, and sperm. Testosterone and inhibin complete the loop via negative feedback at the hypothalamus and pituitary. Exogenous androgens suppress the axis by amplifying this negative feedback, leading to reduced GnRH and gonadotropin secretion [20]. Oral contraceptives primarily suppress the hypothalamic-pituitary-ovarian axis, preventing ovulation.
Essential Research Reagents and Materials
The following table catalogues critical reagents and methodologies used in the pharmacokinetic and endocrine research discussed throughout this review.
Table 3: Essential Research Reagent Solutions for Endocrine PK/PD Studies
| Research Reagent / Material | Function and Application | Example Use in Context |
|---|---|---|
| Specific Radioimmunoassays (RIAs) | Quantification of steroid hormones (e.g., EE, LNG, testosterone) and peptides in serum with high sensitivity [76] | Measuring 24-hour concentration-time profiles of EE and LNG in OC PK studies [76] |
| Liquid Chromatography-Tandem Mass Spectrometry (LC-MS/MS) | Gold standard for specific and accurate measurement of sex steroids and drug concentrations in biological fluids [79] | Determining testosterone and estradiol levels in large population studies of male hypogonadism [79] |
| Ultrasonography with Transvaginal Probe | Non-invasive monitoring of ovarian follicular development and size during OC treatment to assess pharmacodynamic effect [76] | Tracking follicular diameter as a measure of ovarian suppression efficacy in OC users [76] |
| Population PK/PD Modeling Software | Nonlinear mixed-effects modeling to analyze sparse PK data from patient populations and identify covariates (e.g., weight, renal function) [78] | Developing and validating the nedosiran Pop-PK/PD model to support pediatric dosing [78] |
| GnRH and hCG Stimulation Agents | Diagnostic agents to test the functional integrity of the pituitary (GnRH) and testicular Leydig cells (hCG) [20] | Differentiating between central and testicular causes of hypogonadism in former androgen abusers [20] |
The intricate relationship between peak serum levels, dosing intervals, and therapeutic outcomes remains a pivotal consideration in endocrine pharmacology. The comparative analysis presented herein demonstrates that optimizing this relationship requires a deep understanding of a drug's pharmacokinetic properties, the physiological system it targets, and patient-specific factors. From the sustained suppression of the HPGA following androgen abuse to the altered pharmacokinetics of oral contraceptives in obesity and the targeted delivery of novel RNAi therapies, the fundamental principle is consistent: effective and safe treatment depends on achieving and maintaining appropriate drug exposure at the site of action. Future research should continue to integrate advanced pharmacokinetic modeling with robust pharmacodynamic biomarkers to further refine dosing strategies across diverse patient populations, ultimately improving the efficacy and safety of endocrine therapies.
Limitations of Estrogen-Only Models and the Risk of Unopposed Estrogen
The study of unopposed estrogen therapy is foundational to understanding the broader endocrine system, particularly in the context of hypogonadal and hypergonadal models. In reproductive physiology, the hypothalamic-pituitary-gonadal (HPG) axis operates through precise feedback mechanisms. Estrogen-only interventions represent an imbalanced hormonal environment that disrupts this delicate equilibrium, particularly in the endometrium. While research on combination therapies (estrogen plus progestin) is extensive in oral contraceptive research, estrogen-only models present a unique set of limitations and risks that are crucial for drug development professionals to recognize. These models are not merely simplified experimental systems; they represent a physiologically aberrant state with significant clinical consequences, necessitating careful interpretation in both research and therapeutic contexts.
Pathophysiological Mechanisms and Signaling Pathways
Unopposed estrogen exerts its effects through a dual mechanism: direct stimulation of cellular proliferation and disruption of normal apoptotic pathways. In the endometrium, estrogen binding to estrogen receptors (ERs) triggers a signaling cascade that activates cyclin D1 and other cell-cycle regulators, driving endometrial gland proliferation. This sustained mitogenic signaling, without the differentiating and stabilizing counter-action of progesterone, creates a permissive environment for genetic instability.
The diagram below illustrates the core signaling pathway of unopposed estrogen action and its pathological consequences on the endometrium.
Beyond the endometrium, the effects of unopposed estrogen are tissue-specific and often paradoxical. In breast tissue, evidence suggests a more complex relationship. Long-term data from the Women's Health Initiative (WHI) randomized trials indicate that estrogen-alone therapy in postmenopausal women with prior hysterectomy was associated with a significant reduction in breast cancer incidence (23% lower) and mortality (44% lower) during approximately 16 years of follow-up [80] [81]. This contrasts sharply with combination hormone therapy (estrogen plus progestin), which increased breast cancer risk by 29% [80]. This dichotomy highlights a crucial limitation of extrapolating risk profiles across tissue types and hormonal contexts in drug development.
Quantitative Risk Assessment: Comparative Data
The gynecologic consequences of long-term, unopposed estrogen therapy are well-documented through both observational studies and randomized controlled trials. The following table summarizes key comparative risk data for clinical endpoints.
Table 1: Gynecologic and Oncologic Risks of Long-Term Unopposed Estrogen Therapy
| Clinical Endpoint | Risk in Unopposed Estrogen Users | Risk in Non-Users | Risk Ratio | Study Details |
|---|---|---|---|---|
| Endometrial Cancer | 9.9% of users developed cancer [82] | 1.4% of non-users [82] | 7.7-fold increase [82] | Mean dose: 0.9 mg conjugated estrogens [82] |
| Hysterectomy Rate | 28.2% of users [82] | 5.3% of non-users [82] | 6.6-fold increase [82] | Often performed for abnormal bleeding [82] |
| Abnormal Vaginal Bleeding | Significantly higher incidence [82] | Lower incidence [82] | 7.8-fold increase [82] | Leading cause of invasive procedures [82] |
| Curettage Procedures | Significantly higher incidence [82] | Lower incidence [82] | 4.9-fold increase [82] | Diagnostic procedure for abnormal bleeding [82] |
| Breast Cancer Risk | 23% lower incidence [80] | Reference group [80] | 0.77 hazard ratio [80] | WHI trial: women with hysterectomy [80] |
The relationship between therapy duration and breast cancer risk reveals important nuances for researchers. The Nurses' Health Study found that using unopposed estrogen for less than 10 years was not associated with an increased risk of breast cancer. However, use for more than 15 years significantly increased the risk of estrogen or progesterone receptor-positive breast cancers [83]. This time-dependent risk profile underscores the importance of considering exposure duration in both research models and clinical trial design.
Experimental Models and Methodological Approaches
In Vivo Clinical Trial Designs
The Women's Health Initiative (WHI) represents one of the most comprehensive experimental approaches to studying unopposed estrogen. The study employed a randomized, double-blind, placebo-controlled design across 40 clinical centers [80]. The methodology can be summarized as follows:
- Participant Population: 10,739 postmenopausal women aged 50-79 with prior hysterectomy
- Intervention: Conjugated equine estrogen (0.625 mg/day) versus placebo
- Primary Outcomes: Coronary heart disease incidence and invasive breast cancer
- Secondary Outcomes: Fractures, other cancers, and overall mortality
- Follow-up Duration: Mean intervention period of 7.1 years, with total follow-up extending beyond 16 years [80]
This experimental protocol allowed for direct assessment of unopposed estrogen effects without the confounding protective effect of progestins on the endometrium, as all participants had undergone hysterectomy.
Genetic and Molecular Methodologies
Understanding the genetic basis of hormonal responsiveness is crucial for developing targeted therapies. Research into congenital hypogonadotropic hypogonadism (CHH) has identified over 30 genes involved in the development and function of the hypothalamic-pituitary-gonadal axis [84]. Next-generation sequencing (NGS) techniques now allow simultaneous testing of multiple gene targets, moving beyond the classic practice of testing only a few commonly affected genes [84].
Table 2: Select Genetic Mutations Associated with Hypogonadism and Their Phenotypic Expressions
| Affected Gene | Inheritance Pattern | Reproductive Phenotype | Non-Reproductive Features |
|---|---|---|---|
| ANOS1 (KAL1) | X-linked | Anosmic CHH (Kallmann Syndrome) | Cryptorchidism, small testes, unilateral renal agenesis, synkinesia [84] |
| FGFR1 | Autosomal dominant | Both anosmic and normosmic CHH | Cleft lip/palate, dental agenesis, bimanual synkinesis, digital malformations [84] |
| CHD7 | Autosomal dominant | Both anosmic and normosmic CHH | CHARGE syndrome features: coloboma, heart defects, choanal atresia, deafness [84] |
| GNRHR | Autosomal recessive | Normosmic CHH | Isolated hypogonadotropic hypogonadism without extra-reproductive features [84] |
The workflow for genetic analysis in endocrine research typically follows a structured pathway from clinical presentation to genetic diagnosis, as illustrated below.
The Scientist's Toolkit: Essential Research Reagents and Models
Advancing research in hormonal mechanisms and therapeutic safety requires specialized reagents and model systems. The following table details key resources for investigating unopposed estrogen effects.
Table 3: Research Reagent Solutions for Estrogen Pathway Investigation
| Reagent/Model | Research Function | Experimental Application |
|---|---|---|
| Conjugated Equine Estrogens | Reference standard for estrogen-only interventions | In vivo studies modeling human hormone replacement therapy [82] [80] |
| GnRH Receptor Agonists/Antagonists | Modulate hypothalamic-pituitary-gonadal axis | Creating hypogonadal models for therapeutic testing [84] |
| Next-Generation Sequencing Panels | Simultaneous analysis of 30+ CHH-associated genes | Identifying genetic contributors to hormonal dysfunction [84] [85] |
| ERα/ERβ-Specific Agonists | Dissect receptor-specific estrogen signaling | Mechanistic studies of tissue-specific estrogen effects [86] |
| Aromatase Inhibitors | Block endogenous estrogen synthesis | Control endogenous estrogen production in experimental models [86] |
| Human GnRH-Secreting Neurons | Study development and function of GnRH system | In vitro models of hypothalamic regulation [84] |
The limitations of estrogen-only models extend far beyond their established link to endometrial cancer, encompassing complex tissue-specific effects that present both risks and paradoxical benefits. The stark contrast between the proliferative endometrial response and the potential protective breast tissue effects observed in the WHI trials underscores a fundamental principle in endocrine research: hormonal actions cannot be generalized across tissue types. For drug development professionals, this necessitates:
- Tissue-Specific Risk Assessment: Evaluating hormonal agents through organ-specific models and biomarkers
- Precision Medicine Approaches: Incorporating genetic profiling to identify patients most likely to benefit from estrogen-only therapies
- Advanced Model Systems: Developing more sophisticated in vitro and in vivo models that recapitulate human endocrine physiology
Future research should focus on elucidating the molecular mechanisms underlying the tissue-specific dichotomy of estrogen action, potentially identifying novel therapeutic targets that can harness the benefits of estrogen signaling while mitigating its risks.
Ensuring Accuracy: Validating Models and Comparing Contraceptive Modalities
Within research on hormonal effects, including investigations into hypogonadal hypergonadal models, the precise measurement of exposure to exogenous hormones like oral contraceptives (OCs) is paramount. The reliability of data sources used to establish this exposure directly impacts the internal validity of study findings and the accuracy of subsequent conclusions regarding physiological and behavioral outcomes [87]. Self-reported data, collected via interview or questionnaire, is a common and resource-intensive method, but it may be subject to recall bias and social desirability bias [87] [88]. In contrast, automated pharmacy records offer an objective, less resource-intensive data source, though they are limited to documenting prescription fills and cannot confirm actual pill ingestion [87] [89]. This guide provides a comparative analysis of these two methodological approaches, summarizing key evidence on their agreement and offering practical tools for researchers designing studies on OC effects.
Comparative Analysis of Data Source Agreement
Quantitative studies directly comparing self-reported OC use with pharmacy records reveal varying levels of concordance, influenced significantly by the recency of use.
Table 1: Agreement Between Self-Reported and Pharmacy-Validated OC Use Over Time
Data derived from a study of 1,399 perimenopausal and early postmenopausal women (ages 45-59) [87] [90]
| Time Period Prior to Interview | Prevalence Adjusted and Bias Adjusted Kappa (PABAK) | Unadjusted Kappa (K) | Landis & Koch Interpretation of K | Notes |
|---|---|---|---|---|
| Within 5 years | 0.88 (95% CI: 0.85–0.90) | 0.62 | Substantial Agreement | Pharmacy data captured 11-45% more users than self-report in all periods. |
| 5.1 - 10 years | 0.82 | 0.47 | Moderate Agreement | Agreement declines with more distant recall. |
| 10.1 - 15 years | 0.74 | 0.37 | Fair Agreement | - |
| 15.1 - 20 years | 0.65 (95% CI: 0.59–0.71) | 0.29 | Fair Agreement | - |
A separate study of 384 current OC users (ages 18-40) further highlights the discrepancy between these measures when assessing recent adherence. When high adherence was defined as missing one or fewer pills per month, 76% of participants were classified as highly adherent via self-report, whereas only 68% met the threshold using the Proportion of Days Covered (PDC) metric from pharmacy claims. Merely 54% of participants were classified as highly adherent by both measures simultaneously, indicating a significant overestimation of adherence by self-report alone [89] [91].
Detailed Experimental Protocols
To ensure the validity and reproducibility of research in this field, below are detailed methodologies for key study designs used to evaluate OC data sources.
Protocol for a Long-Term Recall Agreement Study
This protocol is modeled on the study by PMC4300298, which evaluated the agreement between self-report and pharmacy data for OC use occurring up to 20 years prior [87] [90].
- 1. Population Recruitment & Eligibility: Enroll a well-defined cohort, such as members of an integrated health system. Participants should be continuously enrolled for the entire study period to ensure complete pharmacy data. For example, include women aged 45-59 who are perimenopausal or early postmenopausal.
- 2. Reference Date Assignment: Assign a specific reference date for each participant (e.g., date of an incident fracture in a case-control study, or a randomly assigned date for controls).
- 3. Self-Report Data Collection:
- Conduct structured, computer-assisted telephone interviews.
- Use a life-event calendar to aid recall.
- Collect detailed lifetime OC use history, including start/stop ages for each episode of use lasting 3 months or more, for up to 14 episodes.
- 4. Pharmacy Data Extraction: Extract all OC prescription fill records from the automated pharmacy database, using National Drug Codes (NDCs) to identify relevant medications, for a period extending back to the desired recall window (e.g., to 1980).
- 5. Data Processing & Harmonization: Derive comparable variables for OC use (yes/no) from both data sources for specific time windows relative to the reference date (e.g., 0-5, 5-10, 10-15, 15-20 years prior).
- 6. Statistical Analysis: Calculate agreement statistics, including the unadjusted Kappa and the Prevalence Adjusted and Bias Adjusted Kappa (PABAK), to account for imbalanced marginal distributions where one source consistently identifies more users than the other [87].
Protocol for a Recent Adherence Comparison Study
This protocol is based on the study by Nelson et al. (2017), which compared contemporary adherence measures [89].
- 1. Sample Definition: Identify a cohort of current OC users from an insured population with linked pharmacy claims data. Eligibility criteria may include age (18-40), sexual activity, and no intention of pregnancy.
- 2. Self-Report Adherence Measurement: Administer a survey asking, "In the past 3 months, altogether how many days did you completely miss a hormone pill that you were supposed to take?" Categorize high adherence as missing ≤3 pills in 3 months (equivalent to ≤1 pill per month) [89].
- 3. Pharmacy Adherence Measurement (PDC):
- Calculate the Proportion of Days Covered (PDC) for the 90-day period prior to the survey.
- Using pharmacy fill dates and days supplied, determine the number of days the patient "possessed" the medication. Divide this by 90 to get the PDC.
- Define high adherence as a PDC ≥96% (covering all but 3-4 days in 90 days) [89].
- 4. Analysis: Compare the proportion of users classified as highly adherent by each measure. Use multivariable logistic regression to identify predictors of adherence (e.g., age, relationship status, self-efficacy).
Visualization of Methodological Workflows
The following diagram illustrates the logical workflow and parallel processes for validating self-reported Oral Contraceptive (OC) data against pharmacy records, leading to a quantitative agreement analysis.
The following diagram situates the methodological challenge of measuring OC exposure within the broader physiological context of hormonal regulation, which is fundamental to research involving hypogonadal or hypergonadal models.
The Scientist's Toolkit: Key Research Reagents & Materials
When conducting studies that rely on accurate OC exposure data, researchers should consider the following essential components and their functions.
Table 2: Essential Materials and Methods for OC Data Collection Studies
| Item/Component | Function & Application in Research | Key Considerations |
|---|---|---|
| Structured Interview Guides | To collect self-reported OC histories in a standardized manner, minimizing interviewer bias. | Should include memory aids (e.g., life event calendars) and probe for episode start/stop times and formulation changes [87]. |
| Computer-Assisted Interviewing (CATI) | Ensures consistent question administration and direct data entry, reducing transcription errors. | Requires interviewer training and certification; allows for complex skip patterns [87]. |
| Automated Pharmacy Database | Provides objective, timestamped records of prescription fills for comparison or validation. | Limited to a closed pharmacy system; does not confirm ingestion or capture samples [87] [89]. |
| National Drug Codes (NDCs) | Standardized identifiers for precisely extracting OC-specific prescriptions from pharmacy databases. | Critical for ensuring all relevant formulations are captured in the analysis [87]. |
| Proportion of Days Covered (PDC) | A claims-based metric calculating the proportion of days a patient possesses medication over a period. | Preferred for adherence measurement in chronic diseases; applied to OCPs to quantify gaps in use [89]. |
| Kappa Statistics (K & PABAK) | Statistical measures of inter-rater agreement for categorical items (e.g., user/non-user) that correct for chance. | PABAK is crucial when prevalence of use/non-use is very high or low, as it adjusts for imbalanced margins [87]. |
Benchmarking Model Predictions Against Clinical Trial Data for Hormone Levels
Within hypogonadal and hypergonadal model research, the ability to accurately predict how a therapeutic intervention will alter hormone levels is paramount. Preclinical models provide the foundational hypotheses, but their true validation comes from benchmarking their predictions against rigorous clinical trial data. This process is crucial in fields such as oral contraceptive research, where the goal is to deliberately modulate the hypothalamic-pituitary-gonadal (HPG) axis to achieve a specific endocrine profile. This guide objectively compares the performance of various model predictions against the empirical data generated from clinical trials, focusing on interventions that target steroid hormone pathways. The supporting data, drawn from published clinical studies and trial protocols, provide a framework for evaluating the predictive strength of current modeling approaches.
Key Hormonal Pathways and Experimental Framework
Core Physiological and Interventional Pathways
The HPG axis serves as the central regulatory system for reproduction and steroid hormone production. Clinical interventions, such as hormonal contraceptives, are designed to modulate this axis predictably. The following diagram illustrates the core physiology and the primary mechanisms of intervention.
Figure 1: HPG Axis and Hormonal Contraceptive Mechanism. The diagram depicts the physiological hypothalamic-pituitary-gonadal (HPG) axis (yellow/orange/green nodes) and the suppressive mechanism of action of hormonal interventions (blue/red nodes). Exogenous steroids provide negative feedback, suppressing GnRH and subsequently LH/FSH, leading to reduced gonadal function. [3] [15]
Clinical Trial Workflow for Hormone-Level Assessment
Translating a model's prediction into clinical validation requires a structured experimental workflow. This process, from trial design to data analysis, ensures that the biomarker data used for benchmarking is robust and reliable.
Figure 2: Clinical Trial Workflow for Hormone Assessment. The workflow outlines the key stages in a clinical trial designed to assess hormonal changes, from initial design to the final benchmarking of predictive models against the collected data. [3] [20]
Comparative Analysis of Model Predictions vs. Clinical Data
Hormonal Contraceptive Effects on the HPG Axis
Combined Oral Contraceptives (COCs) exert their effects by suppressing the HPG axis. The following table summarizes the predicted versus clinically observed effects of different COC progestins on key hormonal parameters in women with Polycystic Ovary Syndrome (PCOS).
Table 1: Benchmarking Model Predictions vs. Clinical Data for Oral Contraceptives in PCOS [15]
| Progestin Compound | Hormonal Parameter | Model-Predicted Direction of Change | Clinically Observed Change (Weighted Mean Difference) | Treatment Duration for Observed Effect |
|---|---|---|---|---|
| Cyproterone Acetate | Luteinizing Hormone (LH) | Decrease | ↓ WMD = -3.57 (95% CI: -5.14 to -1.99) | 3 months |
| Decrease | ↓ WMD = -5.68 (95% CI: -9.57 to -1.80) | 6 months | ||
| Decrease | ↓ WMD = -11.60 (95% CI: -17.60 to -5.60) | 12 months | ||
| Follicle-Stimulating Hormone (FSH) | Decrease | ↓ WMD = -0.48 (95% CI: -0.81 to -0.15) | 3 months | |
| Decrease | ↓ WMD = -2.33 (95% CI: -3.48 to -1.18) | 6 months | ||
| Decrease | ↓ WMD = -4.70 (95% CI: -4.98 to -4.42) | 12 months | ||
| Total Testosterone | Decrease | Significant Decrease | 3, 6, 12 months | |
| Drospirenone | Luteinizing Hormone (LH) | Decrease | ↓ WMD = -4.59 (95% CI: -7.53 to -1.66) | 6 months |
| Follicle-Stimulating Hormone (FSH) | Decrease | ↓ WMD = -0.93 (95% CI: -1.79 to -0.08) | 6 months | |
| Total Testosterone | Decrease | Significant Decrease | 6 months | |
| Desogestrel | Luteinizing Hormone (LH) | Decrease | No statistically significant change | 3-6 months |
| Follicle-Stimulating Hormone (FSH) | Decrease | No statistically significant change | 3-6 months | |
| Total Testosterone | Decrease | Significant Decrease | 3-6 months |
Key Insights:
- Cyproterone Acetate demonstrates a strong, time-dependent suppressive effect on gonadotropins (LH and FSH), aligning with model predictions and its anti-androgenic properties.
- Drospirenone also shows significant suppression, though the clinical data for long-term effects (12 months) is less comprehensive than for Cyproterone Acetate.
- Desogestrel's clinical impact on gonadotropin levels was not statistically significant in the available studies, which may indicate a discrepancy with initial model predictions or highlight the need for more powerful trials.
Hormonal Male Contraceptive Efficacy Trials
The development of hormonal male contraceptives (HMCs) relies on accurately predicting the suppression of spermatogenesis via HPG axis modulation. The following table benchmarks the outcomes of various clinical efficacy trials against the overarching model of testosterone and progestin action.
Table 2: Benchmarking Model Predictions vs. Clinical Data for Hormonal Male Contraceptives [3]
| Contraceptive Regimen | Androgen Component | Progestin Component | Target Sperm Suppression Threshold | Clinical Efficacy: % of Men Reaching Threshold | Pregnancy Failure Rate (per 100 couple-years) |
|---|---|---|---|---|---|
| Testosterone Only | Testosterone Enanthate (200 mg/week) | None | Azoospermia (0 million/mL) | 69.8% | 0.8 |
| Testosterone Enanthate (200 mg/week) | None | < 3 million/mL | 97.8% | 1.4 | |
| Testosterone Undecanoate (Load + 500 mg/month) | None | < 1 million/mL | 95.2% | 1.1 | |
| Testosterone + Progestin | Testosterone Implants | Depot Medroxyprogesterone Acetate | < 1 million/mL | 94% | 0 (Study ongoing) |
| Testosterone Undecanoate | Norethisterone Enanthate | < 1 million/mL | 95.9% | 2.2 |
Key Insights:
- The addition of a progestin enhances the degree and speed of sperm suppression, as predicted by the model of synergistic HPG axis suppression [3].
- Clinical data strongly supports the model prediction that a sperm concentration threshold of < 1 million/mL is required for contraceptive efficacy comparable to female methods.
- Testosterone-only regimens can be effective but require supra-physiological doses (e.g., 200 mg/week) to achieve adequate suppression in most men, whereas androgen-progestin combinations achieve similar or better efficacy with lower androgen doses.
The Scientist's Toolkit: Research Reagent Solutions
Successful experimentation in this field depends on specific reagents and biomarkers. The following table details key materials and their functions in clinical protocols.
Table 3: Essential Research Reagents and Materials for HPG Axis Clinical Trials
| Reagent / Material | Function in Experimental Protocol | Example Application in Context |
|---|---|---|
| GnRH / GnRH Agonists | Diagnostic tool to stimulate pituitary gonadotropin release and assess pituitary reserve and function. | Used in stimulation tests to evaluate central (pituitary) function in recovered androgen abusers [20]. |
| Recombinant hCG | Stimulates Leydig cells in the testes to produce testosterone, directly assessing testicular function. | Used in clinical studies to evaluate Leydig cell capacity and testosterone production potential in men post-androgen abuse [20]. |
| Insulin-like Factor 3 (INSL3) | A biomarker for Leydig cell functional capacity, providing a more stable measure than fluctuating testosterone levels. | Measured in former androgen abusers to show persistent Leydig cell impairment even years after cessation [20]. |
| Sex Hormone-Binding Globulin (SHBG) Assays | Quantifies circulating SHBG levels, which directly influence the bioavailability of free testosterone and estradiol. | Critical for assessing the androgenic profile in OC trials; COCs increase SHBG, reducing free testosterone [15]. |
| Specific Immunoassays | Precisely measure concentrations of steroid hormones (testosterone, estradiol) and protein hormones (LH, FSH, cortisol). | Used to monitor hormonal suppression and recovery in all contraceptive and hypogonadism studies [22] [3]. |
Benchmarking model predictions against clinical trial data reveals a generally strong concordance between the theoretical models of HPG axis modulation and empirical outcomes. For both female and male hormonal contraception, the core model of negative feedback suppression is robustly validated. However, nuances such as the time-dependency of suppression, the differential potency of various progestins, and the importance of specific sperm thresholds in men are critical details that emerge from clinical data and refine the models. The continued integration of high-quality clinical trial results with predictive modeling is essential for advancing the development of novel endocrine therapies and expanding the contraceptive menu. Future efforts should focus on standardizing diagnostic criteria, as seen with the proposed definition for Prolonged Post-Androgen Abuse Hypogonadism (PPAAH), and on incorporating emerging biomarkers like INSL3 to improve predictive accuracy [20].
The development of hormonal contraceptives represents a cornerstone of reproductive medicine, with profound implications for public health. Within the broader thesis on hypogonadal and hypergonadal models in oral contraceptive effects research, this guide provides a comparative analysis of two distinct endocrine paradigms: the suppression of spermatogenesis in males and the suppression of ovulation in females. These approaches share the fundamental principle of leveraging hormonal feedback systems to inhibit reproductive capacity, yet they operate through distinct physiological mechanisms and efficacy benchmarks. In male models, the therapeutic aim is to induce a state of functional hypogonadism sufficient to suppress sperm production without compromising extragonadal androgen effects, while female models primarily target the disruption of the hypothalamic-pituitary-ovarian axis to prevent ovulation. Understanding the comparative efficacy, mechanisms, and methodological approaches for monitoring these interventions provides critical insights for researchers developing novel contraceptive agents and optimizing existing protocols.
The assessment of contraceptive efficacy requires different biological endpoints and validation methodologies across sexes. In males, efficacy is quantified through sperm concentration thresholds in semen analysis, whereas in females, the confirmation of anovulation through hormonal assays or ultrasound monitoring serves as the primary endpoint. This analysis synthesizes current experimental data and methodological approaches for both models, with particular attention to the quantitative benchmarks used to establish contraceptive efficacy and the protocols employed in contemporary research settings.
Comparative Efficacy Data: Quantitative Benchmarks
Table 1: Key Efficacy Parameters in Male vs. Female Contraceptive Models
| Parameter | Male Contraceptive Model | Female Contraceptive Model |
|---|---|---|
| Primary Physiological Target | Suppression of spermatogenesis | Suppression of ovulation |
| Key Efficacy Threshold | Sperm concentration ≤1 million/mL [92] | Absence of dominant follicle development and luteinization |
| Hormonal Mediators | Testosterone + progestins (e.g., Nestorone) [93] | Estrogen + progestins, or progestins alone |
| Typical Onset to Efficacy | Median ~8 weeks (Nestorone-Testosterone gel) [93] | Within first treatment cycle |
| Primary Efficacy Monitoring | Semen analysis [92] | Serum progesterone levels, pelvic ultrasonography |
| Validated At-Home Monitoring | User-controlled sperm concentration test (≥0.2 million/mL threshold) [94] | Urinary luteinizing hormone (LH) prediction kits |
Table 2: Experimental Data from Recent Clinical Trials
| Trial / Study Focus | Intervention | Results | Reference |
|---|---|---|---|
| Male Contraceptive Gel (Phase 2b) | Daily segesterone acetate (8 mg) + testosterone (74 mg) gel | 86% of men reached sperm count ≤1 million/mL by week 15; median time to suppression <8 weeks [93] | Wang et al., 2023 [94] |
| On-Demand Male Contraception | Single dose of soluble adenylyl cyclase (sAC) inhibitor TDI-11861 | Rendered male mice temporarily infertile; normal fertility returned within 24 hours [95] | Balbach et al., 2023 [95] |
| Ovulation Suppression for Endometriosis | Various ovulation suppression agents (danazol, progestins, OCPs, GnRHa) vs. placebo/no treatment | No evidence of improved pregnancy rates; not recommended for fertility improvement [96] | Hughes et al., 2009 [96] |
| At-Home Sperm Monitoring | User-controlled sperm concentration test vs. lab analysis | 100% sensitivity identifying samples >0.2 million/mL; 99% specificity for samples ≤0.2 million/mL [94] | Lue et al., 2023 [94] |
Methodologies: Experimental Protocols and Signaling Pathways
Key Experimental Protocols
Protocol for Assessing Male Spermatogenesis Suppression
The efficacy of male hormonal contraceptives is typically evaluated through sperm concentration monitoring in clinical trials. The following protocol, derived from ongoing phase 2b studies, details the standard methodology:
- Participant Recruitment: Healthy male volunteers meeting inclusion criteria (normal semen analysis, reproductive health).
- Intervention: Daily application of a transdermal gel containing a combination of segesterone acetate (8 mg) and testosterone (74 mg) applied to each shoulder blade [93].
- Monitoring Schedule: Sperm concentration is assessed through semen analysis at 4-week intervals during the suppression phase [93].
- Efficacy Endpoint: The primary efficacy threshold is defined as a sperm concentration of ≤1 million sperm per milliliter, a level demonstrated to provide effective contraception [92] [93].
- Confirmation Phase: Once suppression is achieved, participants enter an efficacy phase where contraceptive protection is evaluated with their female partners.
- At-Home Monitoring Validation: Participants can use a user-controlled sperm concentration test to distinguish between samples above or below 0.2 million/mL, reducing clinic visits [94].
Protocol for Confirming Female Ovulation Suppression
The assessment of ovulation suppression in females involves a combination of hormonal assays and follicular monitoring:
- Intervention: Administration of ovulation-suppressing agents (e.g., combined oral contraceptives, progestin-only pills, patches, rings, or implants).
- Hormonal Assessment: Measurement of serum progesterone levels during the mid-luteal phase (typically cycle days 21-24). A progesterone level below a specific threshold (e.g., <5 ng/mL) suggests anovulation.
- Ultrasonographic Monitoring: Transvaginal ultrasound is performed to track follicular development. The absence of a dominant follicle progressing to >18-20 mm and subsequent collapse (indicating ovulation) confirms suppression.
- Urinary LH Monitoring: In research settings, the absence of the LH surge can be confirmed through daily urinary LH testing.
- Endpoint: Successful ovulation suppression is confirmed by the combination of low progesterone levels and absence of follicular rupture on ultrasound.
Key Signaling Pathways in Contraceptive Action
Diagram 1: Hormonal Regulation Pathways in Male and Female Contraception
Diagram Title: Hormonal Feedback Pathways in Contraception
This diagram illustrates the primary signaling pathways through which hormonal contraceptives exert their effects in male and female models. In both sexes, the fundamental mechanism involves negative feedback inhibition on the hypothalamic-pituitary axis. In males, exogenous testosterone and progestins suppress the release of gonadotropin-releasing hormone (GnRH) from the hypothalamus, leading to reduced luteinizing hormone (LH) and follicle-stimulating hormone (FSH) secretion from the pituitary. This ultimately results in dramatically lowered intratesticular testosterone levels, which is essential for spermatogenesis [92]. In females, similar suppression of GnRH and consequent inhibition of the mid-cycle LH surge prevents ovulation by disrupting follicular development and maturation.
Emerging Paradigms and Research Tools
Novel Approaches in Male Contraception
Recent advances in male contraception have introduced innovative paradigms that diverge from traditional hormonal suppression:
On-Demand Contraception: A groundbreaking approach utilizes soluble adenylyl cyclase (sAC) inhibitors to achieve temporary infertility. A single dose of TDI-11861, a potent sAC inhibitor, effectively immobilizes sperm without affecting mating behavior in mice, with full fertility returning within 24 hours [95]. This represents a significant departure from chronic suppression methods, offering a more flexible contraceptive option.
Mechanism of Action: sAC is essential for sperm motility and maturation. Inhibition prevents the cAMP signaling cascade that activates sperm motility upon ejaculation, rendering sperm incapable of fertilization despite normal production [95].
Diagram 2: On-Demand Male Contraception via sAC Inhibition
Diagram Title: sAC Inhibition Pathway for Male Contraception
The Scientist's Toolkit: Essential Research Reagents
Table 3: Key Research Reagents and Their Applications
| Reagent / Material | Function in Contraceptive Research | Application Context |
|---|---|---|
| Segesterone Acetate (Nestorone) | Progestin component in male contraceptive gels; suppresses gonadotropins [93] | Male hormonal contraception trials |
| Recombinant FSH | Stimulates spermatogenesis in recovery phases or in HH models [84] | Hypogonadism research & contraceptive reversibility |
| TDI-11861 | Potent sAC inhibitor for on-demand male contraception [95] | Non-hormonal male contraceptive development |
| Human Chorionic Gonadotropin (hCG) | LH analog that stimulates testosterone production [84] [97] | Hypogonadism treatment & contraceptive recovery |
| GnRH Agonists/Antagonists | Directly modulate hypothalamic-pituitary axis [84] | Experimental models of hypogonadism |
| WHO Semen Analysis Manual | Standardized protocol for semen parameter assessment [92] | Efficacy monitoring in male contraceptive trials |
| User-Controlled Sperm Concentration Test | At-home monitoring of sperm suppression [94] | Male contraceptive trials & fertility assessment |
Discussion and Research Implications
The comparative analysis of sperm suppression versus ovulation suppression reveals fundamentally different pharmacological and monitoring approaches. Male contraceptive development has historically faced the challenge of achieving complete suppression of a continuous process (spermatogenesis) that produces millions of sperm daily, while female contraception primarily targets a cyclic event (ovulation) occurring approximately monthly.
The efficacy threshold for male contraception (≤1 million sperm/mL) does not require azoospermia but rather a reduction to levels incompatible with fertilization [92]. This pragmatic threshold acknowledges the challenges of completely suppressing spermatogenesis while still providing highly effective contraception. Recent advances in at-home sperm monitoring now offer practical solutions for the adherence and monitoring challenges in male contraceptive trials [94].
The emergence of on-demand approaches like sAC inhibitors represents a paradigm shift in contraceptive development, moving away from chronic hormonal suppression toward acute intervention [95]. This approach may offer advantages in minimizing systemic hormonal effects while providing user control comparable to female emergency contraception.
For researchers working within hypogonadal models, these contraceptive strategies provide valuable insights into the manipulation of the hypothalamic-pituitary-gonadal axis. The ability to induce reversible hypogonadism for contraceptive purposes, while maintaining extragonadal androgenicity in males, demonstrates the potential for targeted endocrine manipulation with therapeutic applications extending beyond contraception to various reproductive disorders.
Evaluating the Predictive Power of Different Mathematical Model Structures
Mathematical modeling has become an indispensable tool in endocrinology and drug development, providing a sophisticated means to simulate complex physiological systems and predict the outcomes of interventions. Within the specific field of hypogonadal and hypergonadal research, these models are critical for understanding the profound effects of oral contraceptives (OCs) on the hypothalamic-pituitary-gonadal (HPG) axis. OCs, one of the most widely used pharmacological interventions globally, function by deliberately inducing a state of functional hypogonadism to suppress ovulation [74]. Accurately modeling this induced state, and contrasting it with hypergonadal conditions, is essential for developing safer, more effective formulations with minimized side effects.
This guide provides a comparative evaluation of the predominant mathematical model structures employed in this domain. We objectively assess the predictive power of mechanistic pharmacokinetic/pharmacodynamic (PK/PD) models, detailed physiological feedback models, and simpler empirical models by examining their underlying structures, data requirements, validation methodologies, and performance metrics. The aim is to offer researchers and drug development professionals a clear framework for selecting and implementing the most appropriate modeling strategy for their specific research questions in contraceptive development and endocrine disruption studies.
Comparative Analysis of Model Structures
The application of mathematical models in OC research spans from predicting serum hormone concentrations to simulating entire menstrual cycles under pharmacological intervention. The table below summarizes the core characteristics of the primary model types used in this field.
Table 1: Comparison of Mathematical Model Structures in Contraceptive Research
| Model Type | Core Structure & Approach | Primary Outputs Predictions | Key Advantages | Inherent Limitations |
|---|---|---|---|---|
| Mechanistic PK/PD Models [98] | One-compartment model with time-dependent drug release rate (e.g., exponential) and first-order elimination kinetics. | Serum concentration profiles of synthetic hormones (NGMN, EE); Steady-state concentrations (Css). | High interpretability; Directly links drug dose to systemic exposure; Useful for forecasting non-compliance scenarios. | May oversimplify complex physiology; Requires precise pharmacokinetic parameter estimation. |
| Physiological Feedback Models [34] [38] | Systems of coupled ordinary differential equations (ODEs) representing the HPG axis (GnRH, FSH, LH, E2, P4) and follicular dynamics. | Daily hormone levels; Occurrence and magnitude of LH surge; Ovulation status; Follicular wave patterns. | Provides deep systems-level insight; Can simulate "what-if" scenarios for novel protocols; Incorporates key feedback loops. | High complexity and parameterization needs; Computationally intensive; Model validation can be resource-heavy. |
| Empirical & Statistical Models [99] [100] | Data-driven approaches (e.g., ANN, Fourier series) that learn input-output relationships without explicit physiological rules. | Predictive classifications (e.g., ovulation/no ovulation) or continuous forecasts (e.g., hormone level trends). | Can achieve high accuracy from complex datasets; Discovers patterns not pre-defined by modelers. | "Black-box" nature limits interpretability; Requires large, high-quality datasets; Extrapolation can be unreliable. |
Performance Metrics and Experimental Data
The predictive power of a model is quantified through its performance against experimental and clinical data. The following table consolidates key quantitative findings and validation metrics from seminal studies, providing a benchmark for model evaluation.
Table 2: Summary of Quantitative Model Performance and Clinical Validation
| Model & Source | Validated Against | Key Performance Metrics & Clinical Predictions | Therapeutic Insight |
|---|---|---|---|
| Mechanistic PK/PD (Ortho Evra Patch) [98] | Clinical PK data for NGMN and EE from patch studies. | Accurately described NGMN and EE serum concentration curves; Predicted Css; Simulated partial/full patch detachment. | Model confirmed that a single patch application maintains effective concentrations for one week, supporting the dosing regimen. |
| Physiological Model (Hormonal Contraception) [34] | Hormone level data from normal cycling women and clinical trials for progestin-only & combined treatments. | Predicted suppression of LH surge to non-ovulatory levels with exogenous progestin, estrogen, or their combination. | Demonstrated that combined low-dose estrogen and progestin achieves contraception at lower doses of each hormone, potentially improving safety. |
| Physiological Model (Ovarian Stimulation) [38] | Qualitative clinical observations of follicular waves and stimulation outcomes. | Simulation results showed follicular development in a wave-like manner, supporting stimulation protocols initiated in luteal or late follicular phases. | Provided mechanistic support for "random-start" and "double-stimulation" IVF protocols, increasing treatment flexibility. |
| Male Contraceptive Efficacy Trial [3] | Clinical trial pregnancy rates with various regimens. | With a 95% effective method, >80/100 couples had unplanned pregnancies; with a 99% effective method, ~30/100 couples had more children than planned. | Highlights the high efficacy threshold required for male contraception and contextualizes the performance goals for predictive models of suppression. |
Detailed Experimental Protocols
To ensure reproducibility and critical appraisal, this section outlines the detailed methodologies employed in developing and validating the key models discussed.
This protocol details the creation of a one-compartment model for a contraceptive transdermal patch.
- 1. Model Formulation: The model structure is based on mass balance principles. Two state variables are defined: the concentrations of Norelgestromin ([NGMN]) and Ethinyl Estradiol ([EE]) in the blood plasma. The change in these concentrations over time is governed by the differential equations:
d[NGMN]/dt = R_abs_NGMN - R_elim_NGMNandd[EE]/dt = R_abs_EE - R_elim_EE. - 2. Absorption Kinetics: Drug absorption from the patch is modeled as a time-dependent exponential process:
R_abs_NGMN = (k_o_N / V_d_N) * exp(-αt)andR_abs_EE = (k_o_E / V_d_E) * exp(-βt), wherek_ois the initial release rate,V_dis the volume of distribution, andα/βare constants governing the absorption rate decay. - 3. Elimination Kinetics: Elimination from the bloodstream is modeled as a first-order process:
R_elim_NGMN = k_elim_N * [NGMN]andR_elim_EE = k_elim_E * [EE], wherek_elimis the first-order elimination rate constant. - 4. Parameter Estimation: Model parameters (
k_o,V_d,α,β,k_elim) are estimated or calculated from previously published clinical pharmacokinetic studies for the Ortho Evra patch [98]. - 5. Model Validation: The model is validated by graphically comparing simulated serum concentration-time curves of NGMN and EE to experimentally observed clinical data. Further validation involves comparing key pharmacokinetic parameters like average steady-state concentration (Css) with values from pharmaceutical handbooks.
This protocol describes the use of a systems-level model to simulate the effects of contraceptive hormones.
- 1. Model Selection and Modification: A pre-existing, validated model of the human menstrual cycle, composed of coupled ODEs for GnRH, LH, FSH, E2, P4, and follicular development, is selected. A critical modification is the incorporation of key ovarian autocrine mechanisms, which are essential for accurately predicting the system's response to exogenous hormones.
- 2. Intervention Implementation: Administration of oral contraceptives is simulated by adding exogenous inputs of synthetic progesterone (progestin) and/or synthetic estrogen (e.g., ethinyl estradiol) to the model's state variables for P4 and E2. The doses and timing can be varied to represent different clinical regimens.
- 3. Simulation and Output Analysis: The model is run over multiple simulated cycles with and without the exogenous hormonal inputs. Key outputs analyzed include the time-series profiles of LH, FSH, E2, and P4. The primary endpoint for contraceptive efficacy is the suppression of the mid-cycle LH surge.
- 4. Validation against Clinical Endpoints: Model predictions are compared with data from clinical trials of progestin-only and combined hormonal contraceptives. Successful validation is achieved if the model accurately predicts the abolition of the LH surge and the maintenance of low P4 levels, consistent with a non-ovulatory state [34].
- 5. Protocol Exploration: The validated model is used to explore novel scenarios, such as determining the lowest dose combination of hormones required to suppress ovulation, thereby informing dose-finding studies.
Signaling Pathways and Workflow Visualizations
Hormonal Contraception in the HPG Axis
The following diagram illustrates the hypothalamic-pituitary-ovarian (HPO) axis and the mechanistic points of intervention for contraceptive hormones.
Diagram 1: HPO Axis and Contraceptive Intervention. This diagram shows the normal feedback loops of the HPO axis (yellow, green, and red nodes) and the points where exogenous contraceptive hormones (blue node) exert their suppressive effects (blue arrows), leading to a hypogonadal state and inhibition of ovulation.
PK/PD Modeling Workflow
This flowchart outlines the sequential process for developing and applying a pharmacokinetic/pharmacodynamic model for contraceptive delivery systems.
Diagram 2: PK/PD Model Development Workflow. The workflow begins with model definition and equation formulation (yellow), proceeds through parameter estimation and validation (green), and culminates in deployment for predictive simulations (blue).
Follicular Development Dynamics
This diagram visualizes the wave theory of follicular development, which underpins modern flexible ovarian stimulation protocols.
Diagram 3: Follicular Waves and Stimulation. Follicular recruitment occurs in multiple waves (yellow) across menstrual cycle phases (green and red). This model provides the physiological basis for initiating ovarian stimulation protocols (blue) at various times, including the luteal phase.
The Scientist's Toolkit: Essential Research Reagents and Materials
Successful model development and validation rely on specific data types and computational tools. The following table details these essential "research reagents."
Table 3: Key Research Reagents and Computational Tools for Model Development
| Item / Resource | Function in Model Context | Specific Application Example |
|---|---|---|
| Clinical Pharmacokinetic Data | Used to parameterize and validate PK models, ensuring accurate prediction of serum hormone levels. | Measuring serum concentrations of NGMN and EE over time following patch application [98]. |
| Hormone Level Time-Series | Serves as the primary validation dataset for physiological models, testing predictions against biological reality. | Daily measurements of LH, FSH, E2, and P4 across natural and contraceptive cycles [34] [74]. |
| Ovarian Ultrasound Data | Provides quantitative, structural data on follicular growth dynamics to validate model predictions of follicular waves. | Tracking the size and number of ovarian follicles daily via transvaginal ultrasonography [38]. |
| Ordinary Differential Equation (ODE) Solvers | Computational engines for simulating the dynamic behavior of mechanistic models over time. | Using software like MATLAB or R with deSolve to numerically integrate systems of ODEs representing the HPG axis [34] [38]. |
| Sensitivity Analysis Algorithms | Identifies which model parameters have the greatest influence on outputs, guiding refinement and highlighting biological leverage points. | Tools like Sobol' indices or Latin Hypercube Sampling to analyze complex menstrual cycle models [34]. |
Validating Non-Contraceptive Health Outcomes in Hypogonadal Models (e.g., Cancer Risk Modulation)
The investigation of hypogonadal models provides critical insights that extend far beyond their primary reproductive implications, particularly in the realm of cancer risk modulation. Hypogonadism, characterized by deficient testosterone production in males or estrogen/progesterone in females, creates a distinct endocrine environment that may significantly influence carcinogenesis and tumor progression. Within broader research on oral contraceptive effects—which fundamentally induce a temporary, controlled hypogonadal state in females—understanding these models offers a unique lens through which to examine hormone-mediated cancer pathways. This guide systematically compares experimental approaches and their resulting data in validating non-contraceptive health outcomes, specifically cancer risk, in hypogonadal models, providing researchers with a structured analysis of current methodologies and findings.
The significance of this research area is underscored by the high prevalence of hypogonadism in certain patient populations. For instance, studies report that between 40% and 90% of male cancer patients exhibit hypogonadism, a rate substantially higher than that found in the general population [101]. This strong association suggests a potential bidirectional relationship between hypogonadism and cancer pathogenesis, possibly mediated through inflammatory pathways, metabolic alterations, or direct hormonal effects on cell proliferation.
Comparative Analysis of Hypogonadal Models and Methodologies
Key Experimental Models and Their Applications
Table 1: Comparison of Primary Hypogonadal Models in Cancer Research
| Model Type | Key Features | Primary Research Applications | Genetic Considerations |
|---|---|---|---|
| Congenital Hypogonadotropic Hypogonadism (CHH) Models | - Deficient GnRH production, secretion, or action- Often genetic etiology- Can be normosmic (nCHH) or anosmic (Kallmann syndrome) | - Studying long-term hormone deprivation effects- Identifying genetic cancer risk factors- Mapping developmental pathways linking reproduction and carcinogenesis | - Over 30 known associated genes (e.g., ANOS1, FGFR1, GNRHR)- Oligogenic inheritance possible- ~50% of cases have unidentified genetic cause [84] [102] |
| Acquired Hypogonadism Models | - Induced by chemotherapy, opioids, inflammation, or chronic disease- More common in clinical practice- Often functional/reversible component | - Modeling cancer therapy-induced hypogonadism- Investigating inflammatory cytokines (IL-6, TNF-α) as mediators between cancer and hypogonadism [101] | - Multifactorial etiology- Strong inflammatory component- Leptin, ghrelin, and opioid systems implicated [101] |
| Pharmacologic Inhibition Models (e.g., Oral Contraceptives) | - Controlled, temporary hormone suppression- Specific receptor targeting- Dose-dependent effects | - Direct testing of hormone manipulation on cancer risk- Studying non-contraceptive benefits and risks- Examining brain network changes and potential CNS cancer pathways [103] | - Not primarily genetic models- Focus on pharmacogenomics of drug response- May interact with underlying genetic risk |
Methodological Approaches to Cancer Risk Validation
Table 2: Methodologies for Validating Cancer Risk in Hypogonadal Models
| Methodology | Protocol Description | Key Measured Outcomes | Strengths and Limitations |
|---|---|---|---|
| Large-Scale Population Risk Algorithms | - Cox proportional hazards models on large databases (e.g., QResearch with 4.96 million patients)- Incorporation of 1392 covariates including hormonal status, medications, comorbidities [104] [105] | - 10-year cancer risk estimates for 11 common cancers- Discrimination metrics (C-index: 0.66-0.91 across cancers)- Calibration performance | Strengths: High statistical power, real-world clinical validityLimitations: Correlation not causation, potential confounding [104] [105] |
| Genetic Association Studies | - Next-generation sequencing of known hypogonadism genes (e.g., 28-gene panels)- Oligogenicity analysis- Phenotype-genotype correlation | - Frequency of pathogenic rare genetic variants- Association with specific cancer types- Penetrance and expressivity measures | Strengths: Identifies molecular mechanisms, potential for personalized risk assessmentLimitations: Over 50% of CHH cases lack identified genetic cause [84] [85] |
| Neuroimaging and CNS Effects | - Randomized, double-blind, placebo-controlled crossover designs- fMRI to measure functional connectivity changes- Seed-based rsFC and whole-brain connectivity analysis [103] | - Altered connectivity in subcortical, executive, and somatomotor circuits- Between-subject similarity in functional connectomes (Iother, pFWE < 0.001)- Correlation with negative affect scores | Strengths: Objective CNS measures, potential link to brain cancer pathwaysLimitations: Significance unclear for direct cancer risk, mood effects may confound [103] |
| Reproductive Outcome Studies as Surrogates | - Ovarian stimulation with hMG (150-225 IU)- Embryo quality assessment- Pregnancy and live birth rates tracking [7] | - Oocytes retrieved (median: 5±7)- MII oocytes (median: 4±3)- Pregnancy rate (31.6%) and live birth rate (21%) | Strengths: Direct tissue response measurement, clinical relevanceLimitations: Indirect cancer risk proxy, focused on reproductive tissues [7] |
Signaling Pathways in Hypogonadism and Cancer Interplay
The relationship between hypogonadal states and cancer risk involves complex endocrine-immune crosstalk. Research indicates that inflammation serves as a critical mediator between these conditions, with pro-inflammatory cytokines directly suppressing testosterone production while potentially creating a microenvironment conducive to tumor development [101].
Figure 1: Signaling Pathways Linking Hypogonadism and Cancer Risk. This diagram illustrates the hypothalamic-pituitary-gonadal (HPG) axis and its disruption by inflammatory processes and other mediators that may influence cancer development. The HPG axis (green) represents normal reproductive hormone regulation, while inflammatory factors (red) and other mediators (gray) demonstrate potential pathways through which hypogonadism may influence cancer risk [101].
Experimental Workflows for Risk Validation
The validation of cancer risk in hypogonadal states requires integrated methodological approaches that combine genetic analysis, endocrine assessment, and long-term outcome tracking. The following workflow represents a comprehensive protocol for establishing causal relationships and mechanistic insights.
Figure 2: Experimental Workflow for Validating Cancer Risk in Hypogonadal Models. This workflow integrates multiple methodological approaches from patient characterization to mechanistic studies, highlighting the sequential process of hypothesis testing in this research domain. Color coding indicates different methodological categories: yellow for clinical assessment, green for genetic analysis, blue for endocrine profiling, red for risk modeling and validation, and gray for mechanistic studies [101] [84] [104].
The Scientist's Toolkit: Essential Research Reagents and Materials
Table 3: Key Research Reagent Solutions for Hypogonadism and Cancer Studies
| Reagent/Category | Specific Examples | Research Application | Experimental Notes |
|---|---|---|---|
| Genetic Analysis Tools | - Custom NGS panels (28+ genes)- Sanger sequencing reagents- Whole exome sequencing platforms | Identification of pathogenic variants in CHH genes (e.g., ANOS1, FGFR1, GNRHR) and cancer risk association | - Over 50% of CHH cases have no identified genetic cause- Oligogenicity present in 2-20% of cases [84] [102] |
| Hormone Assessment Kits | - LH/FSH immunoassays- Testosterone/estradiol RIAs- GnRH stimulation test reagents | Evaluation of hypothalamic-pituitary-gonadal axis function and response to interventions | - Low LH/FSH (<5 IU/L) with low sex steroids confirms HH- GnRH test helps localize defect [7] |
| Cell Signaling Reagents | - Recombinant IL-6, TNF-α- Leptin and ghrelin analogs- Opioid receptor agonists/antagonists | Investigation of inflammatory pathways linking hypogonadism and cancer | - IL-6 directly suppresses testosterone [101]- Testosterone replacement decreases inflammatory cytokines [101] |
| Animal Models | - 43+ homozygous mouse models for nHH/KS genes- Conditional knockout systems- Xenograft models | In vivo validation of genetic findings and therapeutic testing | - ~50% of homozygous models are lethal- ~20% show hypogonadism phenotype [102] |
| Therapeutic Agents | - Testosterone cypionate/enanthate- hCG and recombinant FSH- GnRH pumps | Restoration of hormonal milieu to study cancer risk modulation | - hMG stimulation: 150-225 IU dose- Subcutaneous testosterone may have preferable safety profile [43] [7] |
Comparative Efficacy and Safety Data Across Interventions
Therapeutic Modalities and Their Outcomes
Table 4: Comparison of Testosterone Formulations and Reproductive Outcomes
| Intervention | Protocol Details | Efficacy Outcomes | Safety & Metabolic Effects |
|---|---|---|---|
| Testosterone Cypionate (IM) | - 100 mg weekly intramuscular- 234 hypogonadal men studied- 12-week follow-up [43] | - Trough TT increased: 313.6 to 536.4 ng/dL (p<0.001)- Effective testosterone delivery | - Significant rises in estradiol (E2) and hematocrit (HCT)- Supraphysiological testosterone peaks |
| Testosterone Enanthate (SC) | - 100 mg weekly subcutaneous via autoinjector- Same cohort size and follow-up [43] | - Trough TT increased: 246.6 to 552.8 ng/dL (p<0.001)- Comparable efficacy to IM formulation | - Lower post-therapy E2 (p<0.001) and HCT (p<0.001)- Flatter peak-to-trough ratio- Potentially preferable safety profile [43] |
| Gonadotropin Therapy (hhMG) | - 150-225 IU daily for ovarian stimulation- 19 HH women undergoing ICSI- Median 15±3 days stimulation [7] | - 5±7 oocytes retrieved- 4±3 MII oocytes- 31.6% pregnancy rate | - Requires higher gonadotropin doses (median 5250±2100 IU)- Lower AFC in HH patients vs. controls |
| Assisted Reproduction in HH | - Combined oral contraceptive priming (2 months)- hCG trigger (10,000 IU)- Progesterone luteal support [7] | - 21% live birth rate- 10.5% miscarriage rate- 3±1 embryos transferred | - Reasonable reproductive outcomes despite hypogonadal state- Similar LBR to tubal factor infertility |
The validation of non-contraceptive health outcomes in hypogonadal models, particularly cancer risk modulation, represents a rapidly advancing field with significant implications for both clinical management and drug development. The comparative data presented in this guide demonstrates that while various hypogonadal models and therapeutic approaches show distinct efficacy and safety profiles, several consistent patterns emerge. The association between inflammatory pathways and hypogonadism provides a plausible biological mechanism for increased cancer risk in certain contexts, while genetic studies continue to reveal the complex interplay between reproductive hormones and carcinogenesis.
For researchers and drug development professionals, these findings highlight the importance of considering non-reproductive outcomes when evaluating hormonal therapies and designing preclinical models. The experimental protocols and methodological frameworks outlined here provide a foundation for rigorous validation of cancer risk and other non-contraceptive endpoints in hypogonadal models. As this field evolves, integrating multi-omics approaches with large-scale population data will be essential for translating these findings into targeted interventions that optimize both reproductive and overall health outcomes.
Conclusion
Hypogonadal and hypergonadal models provide an indispensable framework for deconstructing the multifaceted effects of oral contraceptives on the HPG axis. The integration of structural neuroimaging findings, advanced mathematical modeling, and rigorous clinical validation is pushing the field toward a more nuanced understanding. Key takeaways include the demonstrated structural impact of OCs on the brain, the potential of models to drastically reduce steroid doses while maintaining efficacy, and the critical importance of addressing real-world variability and multiple mechanisms of action. Future directions must focus on overcoming the significant challenge of personalizing contraceptive regimens in the face of biological variability. Furthermore, the successful application of these principles to male contraceptive development underscores their broad utility. The ultimate goal for biomedical research is to leverage these sophisticated models to engineer the next generation of safer, more tolerable, and highly personalized contraceptive options for all.
References
- 1. Preserving fertility in the hypogonadal patient: an update - PMC [https://pmc.ncbi.nlm.nih.gov/articles/PMC4378070/]
- 2. Hypogonadotropic Hypogonadism Revisited - PMC [https://pmc.ncbi.nlm.nih.gov/articles/PMC3583156/]
- 3. Testosterone and male contraception - PMC [https://pmc.ncbi.nlm.nih.gov/articles/PMC11556877/]
- 4. Comparing the Effects of Combined Oral Contraceptives ... [https://pubmed.ncbi.nlm.nih.gov/29695378/]
- 5. Hormone-based models for comparing menstrual cycle ... [https://www.sciencedirect.com/science/article/pii/S0091302222000590]
- 6. Androgens in male contraception [https://www.sciencedirect.com/science/article/abs/pii/S1521690X22000148]
- 7. Reproductive outcomes in women with hypogonadotrophic hypogonadism, a case series study | Middle East Fertility Society Journal | Full Text [https://mefj.springeropen.com/articles/10.1186/s43043-021-00055-6]
- 8. CONTRACEPTION TECHNOLOGY: PAST, PRESENT AND ... [https://pmc.ncbi.nlm.nih.gov/articles/PMC3530627/]
- 9. Consensus recommendations for measuring the impact of ... [https://www.sciencedirect.com/science/article/pii/S0010782425000204]
- 10. Pituitary gland volumes and stress: Results of a population- ... [https://www.sciencedirect.com/science/article/abs/pii/S0022395623004922]
- 11. Pituitary Volume in Individuals with Social Anxiety Disorder [https://pmc.ncbi.nlm.nih.gov/articles/PMC11099631/]
- 12. Reduced hippocampal volume and hypothalamus–pituitary ... [https://pmc.ncbi.nlm.nih.gov/articles/PMC4300007/]
- 13. Smaller Pituitary Volumes in Patients with Delusional ... [https://pmc.ncbi.nlm.nih.gov/articles/PMC6853737/]
- 14. Volumetric differences in the pituitary between drug-naïve ... [https://www.sciencedirect.com/science/article/abs/pii/S0278584609000554]
- 15. Comparing the Effects of Combined Oral Contraceptives ... [https://www.researchprotocols.org/2018/4/e113/]
- 16. HPA-axis function and grey matter volume reductions [https://www.nature.com/articles/tp201668]
- 17. Pulsatile gonadotropin-releasing hormone: clinical ... [https://www.sciencedirect.com/science/article/pii/S2666334123000077]
- 18. Therapeutic effects of a pulsatile GnRH pump on adult male ... [https://tau.amegroups.org/article/view/141175/html]
- 19. Male Hormonal Contraception—Current Stage of Knowledge [https://www.mdpi.com/2077-0383/14/7/2188]
- 20. Prolonged post-androgen abuse hypogonadism: potential ... [https://www.frontiersin.org/journals/endocrinology/articles/10.3389/fendo.2025.1621558/full]
- 21. Are adolescence and the gut-brain axis the missing links? [https://www.sciencedirect.com/science/article/abs/pii/S0091302222000644]
- 22. Hormonal contraceptive use in relation to basal and ... [https://www.sciencedirect.com/science/article/pii/S0018506X25001321]
- 23. Reproductive aging in biological females: mechanisms and ... [https://www.frontiersin.org/journals/endocrinology/articles/10.3389/fendo.2025.1658592/full]
- 24. Physiology of GnRH and Gonadotrophin Secretion - NCBI [https://www.ncbi.nlm.nih.gov/books/NBK279070/]
- 25. Neuroendocrine control of gonadotropin-releasing hormone [https://pmc.ncbi.nlm.nih.gov/articles/PMC9948945/]
- 26. Inhibition of ovulation and pharmacologic mechanism ... [https://www.sciencedirect.com/science/article/pii/S0015028225001591]
- 27. Marked suppression of gonadotropins and testosterone by ... [https://www.sciencedirect.com/science/article/pii/S001502821654076X]
- 28. Oral contraceptive use is associated with smaller ... [https://pmc.ncbi.nlm.nih.gov/articles/PMC8059834/]
- 29. The effects of gonadotropin suppression and selective ... [https://pubmed.ncbi.nlm.nih.gov/16394084/]
- 30. Progestins - StatPearls - NCBI Bookshelf - NIH [https://www.ncbi.nlm.nih.gov/books/NBK563211/]
- 31. The effect of combined oral contraception on testosterone ... [https://www.ncbi.nlm.nih.gov/books/NBK164632/]
- 32. Birth Control Pill Could Cause Long-Term Problems With ... [https://www.medicalnewstoday.com/releases/35663]
- 33. Methods and considerations for the use of hormonal ... [https://www.sciencedirect.com/science/article/abs/pii/S0091302222000346]
- 34. Mechanistic model of hormonal contraception [https://journals.plos.org/ploscompbiol/article?id=10.1371/journal.pcbi.1007848]
- 35. A Survey of Mathematical Modeling of Hormonal ... [https://link.springer.com/chapter/10.1007/978-3-031-58516-6_3]
- 36. Mechanistic model of hormonal contraception - PMC [https://pmc.ncbi.nlm.nih.gov/articles/PMC7365466/]
- 37. Comparative effectiveness and safety of different progestins in ... [https://pmc.ncbi.nlm.nih.gov/articles/PMC12334503/]
- 38. Mathematical Modeling and Simulation Provides Evidence ... [https://www.frontiersin.org/journals/endocrinology/articles/10.3389/fendo.2021.613048/full]
- 39. New approaches for developing biomarkers of hormonal ... [https://www.nature.com/articles/s41598-022-24215-4]
- 40. A new drug-device combination for non-hormonal ... [https://www.drugdiscoverynews.com/a-new-drug-device-combination-for-non-hormonal-contraception-16251]
- 41. Update on long- and short-acting contraceptive methods [https://pmc.ncbi.nlm.nih.gov/articles/PMC12187473/]
- 42. Contraceptive Effectiveness in the United States [https://www.guttmacher.org/fact-sheet/contraceptive-effectiveness-united-states]
- 43. Comparison of Outcomes for Hypogonadal Men Treated ... [https://pubmed.ncbi.nlm.nih.gov/34694927/]
- 44. An Evidence-Based Update on Contraception [https://pmc.ncbi.nlm.nih.gov/articles/PMC7533104/]
- 45. Low Dose Oral Contraceptive - an overview [https://www.sciencedirect.com/topics/pharmacology-toxicology-and-pharmaceutical-science/low-dose-oral-contraceptive]
- 46. The exosome-mediated autocrine and paracrine actions of ... [https://www.nature.com/articles/s41388-019-1087-9]
- 47. Inhibition of relaxin autocrine signaling confers therapeutic ... [https://pubmed.ncbi.nlm.nih.gov/33561012/]
- 48. Ovarian Mechanobiology: Understanding the Interplay ... [https://pmc.ncbi.nlm.nih.gov/articles/PMC11898978/]
- 49. Biomechanical properties of ovarian tissue and their impact ... [https://www.sciencedirect.com/science/article/pii/S1472648324006394]
- 50. Hormonal approaches to male contraception [https://www.sciencedirect.com/science/article/abs/pii/S0303720705004636]
- 51. The future of male contraception: a fertile ground - Khourdaji [https://tau.amegroups.org/article/view/19046/html]
- 52. Hormonal Approaches to Male contraception - PMC [https://pmc.ncbi.nlm.nih.gov/articles/PMC3078035/]
- 53. Hormonal Male Contraception: Getting to Market [https://www.frontiersin.org/journals/endocrinology/articles/10.3389/fendo.2022.891589/full]
- 54. Oral Contraceptive Pills - StatPearls - NCBI Bookshelf - NIH [https://www.ncbi.nlm.nih.gov/books/NBK430882/]
- 55. Efficacy and safety of drospirenone as a progestin‐only pill ... [https://pmc.ncbi.nlm.nih.gov/articles/PMC12167661/]
- 56. A review of recommendations, efficacy, and patient safety ... [https://www.sciencedirect.com/science/article/pii/S2667276625000320]
- 57. Birth Control Effectiveness: Different Types & Chart [https://www.naturalcycles.com/cyclematters/birth-control-effectiveness-explained]
- 58. Combined oral contraceptives triple risk of cryptogenic ... [https://www.medlink.com/news/combined-oral-contraceptives-triple-risk-of-cryptogenic-stroke-in-young-women]
- 59. Choosing a birth control pill [https://www.mayoclinic.org/tests-procedures/combination-birth-control-pills/in-depth/best-birth-control-pill/art-20044807]
- 60. Real-world menstrual characteristics of more than 600,000... cycle [https://www.nature.com/articles/s41746-019-0152-7?error=cookies_not_supported&code=e3833bca-e4e5-4efc-85df-384944c5f240]
- 61. How to study the menstrual cycle - PubMed Central - NIH [https://pmc.ncbi.nlm.nih.gov/articles/PMC8363181/]
- 62. today: how Menstrual vary by age, weight... cycles menstrual cycles [https://hsph.harvard.edu/research/apple-womens-health-study/study-updates/menstrual-cycles-today-how-menstrual-cycles-vary-by-age-weight-race-and-ethnicity/]
- 63. Individual differences in the effect of menstrual cycle on ... [https://www.nature.com/articles/s41598-019-47426-8]
- 64. The normal variabilities of the menstrual cycle [https://pubmed.ncbi.nlm.nih.gov/18433748/]
- 65. Individual variation of follicular phase changes in ... [https://pubmed.ncbi.nlm.nih.gov/33866631/]
- 66. Modeling Endometrium Biology and Disease - PMC [https://pmc.ncbi.nlm.nih.gov/articles/PMC9316888/]
- 67. Mucus production, host-microbiome interactions, hormone ... [https://www.nature.com/articles/s41467-024-48910-0]
- 68. Proteome Mapping of Cervical Mucus and Its Potential as a ... [https://www.mdpi.com/1422-0067/24/2/1038]
- 69. Cyclical endometrial repair and regeneration - PubMed Central [https://pmc.ncbi.nlm.nih.gov/articles/PMC10691302/]
- 70. Male contraception: narrative review of ongoing research - PMC [https://pmc.ncbi.nlm.nih.gov/articles/PMC10634021/]
- 71. Development of breakthrough bleeding model of combined ... [https://pmc.ncbi.nlm.nih.gov/articles/PMC11578130/]
- 72. Bleeding Patterns of Oral Contraceptives with a Cyclic ... [https://pmc.ncbi.nlm.nih.gov/articles/PMC9369460/]
- 73. Managing Adverse Effects of Hormonal Contraceptives [https://www.aafp.org/pubs/afp/issues/2010/1215/p1499.html]
- 74. Effects of an Oral Contraceptive on Dynamic Brain States ... [https://www.frontiersin.org/journals/neuroscience/articles/10.3389/fnins.2022.855582/full]
- 75. Accumulation: What It Means and How to Calculate It [https://www.certara.com/knowledge-base/accumulation-what-it-means-and-how-to-calculate-it/]
- 76. Pharmacokinetics of a combined oral contraceptive in ... [https://pmc.ncbi.nlm.nih.gov/articles/PMC3522459/]
- 77. Safety and pharmacokinetics of the non-hormonal male ... [https://www.nature.com/articles/s43856-025-01004-4]
- 78. Clinical Pharmacokinetics [https://link.springer.com/article/10.1007/s40262-025-01540-1]
- 79. Secondary male hypogonadism: a prevalent but overlooked ... [https://pmc.ncbi.nlm.nih.gov/articles/PMC6219298/]
- 80. Estrogen-only hormone replacement therapy ... [https://www.breastcancer.org/research-news/hrt-and-its-effect-on-bc-risk]
- 81. Estrogen for hormone replacement may lower breast ... [https://www.facingourrisk.org/XRAY/estrogen-without-progesterone-as-HRT-may-lower-breast-cancer]
- 82. Gynecologic consequences of long-term, unopposed ... [https://pubmed.ncbi.nlm.nih.gov/3226337/]
- 83. Unopposed Estrogen Therapy Increases Breast Cancer Risk [https://www.aafp.org/pubs/afp/issues/2006/1015/p1420.html]
- 84. Genetics of hypogonadotropic hypogonadism - PubMed Central [https://pmc.ncbi.nlm.nih.gov/articles/PMC8039576/]
- 85. Genetic and phenotypic differences between sexes in ... [https://www.frontiersin.org/journals/endocrinology/articles/10.3389/fendo.2022.965074/full]
- 86. Endometrial Cancer Prevention (PDQ®) - NCI [https://www.cancer.gov/types/uterine/hp/endometrial-prevention-pdq]
- 87. A Comparison of Self-reported Oral Contraceptive Use and ... [https://pmc.ncbi.nlm.nih.gov/articles/PMC4300298/]
- 88. Studying the Use of Oral Contraception: A Review ... [https://pmc.ncbi.nlm.nih.gov/articles/PMC2990281/]
- 89. Measuring oral contraceptive adherence using self-report ... [https://pmc.ncbi.nlm.nih.gov/articles/PMC6540974/]
- 90. A comparison of self-reported oral contraceptive use and ... [https://www.sciencedirect.com/science/article/abs/pii/S1047279714004517]
- 91. Measuring oral contraceptive adherence using self-report ... [https://pure.psu.edu/en/publications/measuring-oral-contraceptive-adherence-using-self-report-versus-p]
- 92. Contraceptive efficacy: Determining the threshold for effective ... [https://pubmed.ncbi.nlm.nih.gov/39031534/]
- 93. Novel male contraceptive gel suppresses sperm ... [https://www.news-medical.net/news/20240603/Novel-male-contraceptive-gel-suppresses-sperm-production-faster-than-similar-birth-control-methods.aspx]
- 94. Male contraception development - PubMed - NIH [https://pubmed.ncbi.nlm.nih.gov/36347310/]
- 95. On-demand male contraception via acute inhibition of ... [https://www.nature.com/articles/s41467-023-36119-6]
- 96. Ovulation suppression for endometriosis for women with ... [https://pmc.ncbi.nlm.nih.gov/articles/PMC7045467/]
- 97. Hypogonadotropic hypogonadism [https://medlineplus.gov/ency/article/000390.htm]
- 98. Ortho Evra® as a Case Study - PMC [https://pmc.ncbi.nlm.nih.gov/articles/PMC3985262/]
- 99. Comparative analysis of mathematical models and ... [https://www.sciencedirect.com/science/article/pii/S2950069925000295]
- 100. Comparing deep learning and Fourier series models for ... [https://www.nature.com/articles/s41598-025-24497-4]
- 101. Hypogonadism in male cancer patients - PMC - PubMed Central [https://pmc.ncbi.nlm.nih.gov/articles/PMC3424192/]
- 102. Genetics of hypogonadotropic Hypogonadism—Human ... [https://www.sciencedirect.com/science/article/abs/pii/S0303720721001787]
- 103. Effects of Oral Contraceptive Pills on Brain Networks [https://pmc.ncbi.nlm.nih.gov/articles/PMC12335007/]
- 104. Development and validation of risk prediction algorithms to ... [https://pmc.ncbi.nlm.nih.gov/articles/PMC4368998/]
- 105. Multi-cancer risk stratification based on national health data [https://www.sciencedirect.com/science/article/pii/S2589750024000621]