Chronobiology in Drug Development: Optimizing Sampling Timing for Circadian Hormone Fluctuations
This article provides a comprehensive guide for researchers and drug development professionals on optimizing sampling protocols for circadian hormone studies.
Chronobiology in Drug Development: Optimizing Sampling Timing for Circadian Hormone Fluctuations
Abstract
This article provides a comprehensive guide for researchers and drug development professionals on optimizing sampling protocols for circadian hormone studies. It covers the foundational science of endocrine circadian rhythms, explores advanced methodological and computational approaches for experimental design, addresses common troubleshooting and optimization challenges, and reviews validation techniques. By synthesizing the latest research, this resource aims to enhance the accuracy of hormone measurement, improve the efficacy of chronotherapy, and inform personalized treatment strategies in clinical practice.
The Circadian Clock and Hormonal Rhythms: Foundational Principles for Researchers
Core Concepts: SCN FAQ for Researchers
What is the Suprachiasmatic Nucleus (SCN) and what is its primary function? The Suprachiasmatic Nucleus (SCN) is a small, bilateral region located in the anterior hypothalamus, directly above the optic chiasm [1] [2]. It serves as the master circadian pacemaker in the mammalian brain, generating and regulating near-24-hour (circadian) rhythms in physiology and behavior [1] [3] [4]. Its primary function is to coordinate the timing of bodily functions—including sleep-wake cycles, hormone release, body temperature, and metabolism—and to synchronize these internal rhythms with the external light-dark cycle [4] [2] [5].
What is the neuroanatomical organization of the SCN? The SCN is organized into two primary subregions with distinct neurochemical and functional properties [1] [6] [2]:
- Ventral (Core): This region primarily receives direct light input from the retina via the retinohypothalamic tract (RHT) [1] [6]. It is characterized by neurons expressing Vasoactive Intestinal Polypeptide (VIP) and Gastrin-Releasing Peptide (GRP) [6] [2]. The core is crucial for entraining the clock to external light cues [6].
- Dorsal (Shell): This region is less directly innervated by the retina and is characterized by neurons expressing Arginine Vasopressin (AVP) [1] [6] [2]. The shell is critical for generating robust, self-sustained circadian rhythms and projects to other brain regions to regulate various physiological outputs [6] [2].
How does the SCN communicate timing information to the rest of the body? The SCN relays circadian timing information through multiple pathways [3] [2]:
- Neuronal Projections: Direct synaptic connections to other hypothalamic areas like the subparaventricular zone (sPVZ) and the dorsomedial hypothalamus (DMH) [1] [2].
- Humoral Signals: Diffusible signals and neurohormones help synchronize peripheral clocks [3].
- Behavioral Rhythms: By regulating rest-activity and feeding-fasting cycles, the SCN indirectly entrains circadian oscillators in peripheral organs like the liver, ensuring metabolic processes are optimally timed [3] [5].
What are the clinical consequences of a disrupted SCN rhythm? Disruptions to SCN function—through shift work, jet lag, or genetic mutations—are linked to several health issues, underscoring its importance in maintaining overall health [1] [2] [5]:
- Sleep Disorders: Advanced or Delayed Sleep Phase Disorders [2].
- Mood Disorders: Major depressive disorder, bipolar disorder, and seasonal affective disorder [2].
- Metabolic Disorders: Increased risk of obesity, type 2 diabetes, and cardiovascular disease [5].
- Neurodegenerative Disease: Disrupted rhythms are a risk factor for conditions like Alzheimer's disease [6] [5].
Essential Data for Experimental Design
Table 1: Key Neuropeptides in SCN Subregions
| SCN Subregion | Key Neuropeptides | Primary Function |
|---|---|---|
| Ventral (Core) | Vasoactive Intestinal Polypeptide (VIP) [6] [2] | Mediates neuronal synchronization within the SCN; essential for light-induced phase shifts [6] [7]. |
| Gastrin-Releasing Peptide (GRP) [2] | Activated by light; helps transmit photic information within the SCN [2]. | |
| Dorsal (Shell) | Arginine Vasopressin (AVP) [1] [2] | Generates robust endogenous rhythmicity; projects to other brain regions to regulate circadian outputs like feeding [6] [2]. |
Table 2: Summary of Major Afferent Inputs to the SCN
| Input Pathway | Origin | Primary Neurotransmitter(s) | Role in Circadian Rhythmicity |
|---|---|---|---|
| Retinohypothalamic Tract (RHT) | Retinal Ganglion Cells | Glutamate, PACAP [2] | Primary conduit for photic entrainment; resets the SCN clock in response to light [1] [2]. |
| Geniculohypothalamic Tract (GHT) | Intergeniculate Leaflet (IGL) | Neuropeptide Y (NPY), GABA [2] | Modulates pacemaker responses to both photic and non-photic (e.g., activity) stimuli [2]. |
| Raphe Nuclei | Median Raphe Nuclei | Serotonin (5-HT) [2] | Modulates light responses; inhibits SCN neuronal activity at night, promotes it during the day [2]. |
Experimental Protocols & Troubleshooting
FAQ: How can I verify a successful SCN lesion in my animal model? Challenge: Incomplete SCN lesions lead to residual circadian rhythmicity, confounding results. Solution:
- Primary Validation: Monitor wheel-running activity in constant darkness (DD) both pre- and post-lesion. A successful lesion is indicated by a complete loss of circadian rhythmicity (i.e., the animal's activity becomes arrhythmic with a period of 24 hours) [1].
- Histological Confirmation: Post-mortem, perform histological staining (e.g., for AVP or VIP) on brain sections to visualize the SCN and verify the extent of the lesion. The absence of SCN tissue confirms a complete lesion.
FAQ: Why are the circadian rhythms in my tissue explants or cell cultures dampening? Challenge: Peripheral oscillators and dissociated SCN neurons have a tendency to desynchronize and dampen their rhythms in vitro because they lack the coupling signals provided by the intact SCN network [6]. Solution:
- Synchronization Protocols: Apply a synchronizing stimulus to your culture before measurement. Common methods include a pulse of dexamethasone (100 nM for 10-20 minutes) [3] or fetal bovine serum (50% for 2 hours) [3].
- Monitor Coupling Agents: In SCN slice experiments, ensure the health of the tissue by including molecules known to promote coupling, such as VIP [6] [7].
Protocol: Investigating Light-Induced Phase Shifts in the SCN Objective: To measure light-induced phase shifts in the SCN molecular clock using Per1 or Per2 gene expression as a readout. Background: Light exposure during the subjective night causes phase delays (early night) or advances (late night), which is mediated by induction of Per genes in the SCN core [6] [3]. Methodology:
- Animal Entrainment: House and entrain mice/rats to a 12-hour light/12-hour dark (LD 12:12) cycle for at least two weeks.
- Light Pulse: At a specific circadian time (CT) in the subjective night (e.g., CT14 for delays, CT22 for advances), expose the experimental group to a 15-30 minute light pulse (e.g., 100 lux). Keep control animals in darkness.
- Tissue Collection: At defined time points post-light pulse (e.g., 1 hour for mRNA, 2-3 hours for protein), rapidly collect brains under safe (dim red) light conditions.
- Tissue Processing: Flash-freeze brains and prepare coronal hypothalamic sections (10-20 µm) using a cryostat.
- In Situ Hybridization/Immunohistochemistry: Process sections for Per1 or Per2 mRNA (via in situ hybridization) or PER1/2 protein (via immunohistochemistry).
- Data Analysis: Quantify the signal intensity specifically in the SCN core. A significant increase in the light-pulsed group compared to the dark controls indicates a successful light-induced phase-resetting signal.
Signaling Pathways & System Workflows
The Scientist's Toolkit: Research Reagent Solutions
Table 3: Essential Reagents for SCN and Circadian Rhythm Research
| Reagent / Material | Function / Application | Key Experimental Notes |
|---|---|---|
| VIP Receptor Antagonists (e.g., VPAC2 antagonist) | To block VIP signaling and study its critical role in interneuronal synchronization and light-resetting [6] [7]. | Application in SCN slices can induce desynchronization among neurons, mimicking low circadian amplitude [6]. |
| Glutamate Receptor Agonists/Antagonists (e.g., NMDA) | To mimic or block the effect of photic input from the RHT [6]. | NMDA application to SCN slices in vitro can mimic light-induced phase shifts, useful for studying resetting mechanisms [6]. |
| Melatonin | To study the hormone of darkness and its phase-resetting effects on the SCN, particularly at dusk and dawn [4]. | Acts via protein kinase C (PKC) pathways in the SCN; used to phase-shift the clock during subjective twilight [4]. |
| Dexamethasone | A synthetic glucocorticoid used to synchronize peripheral circadian clocks in cell culture or tissue explants [3]. | A brief pulse (e.g., 100 nM, 10-20 min) is sufficient to reset the phase of oscillators in fibroblasts or organ cultures [3]. |
| Per1/2::Luciferase Reporter Vectors | For real-time monitoring of circadian gene expression dynamics in SCN slices or cultured cells via bioluminescence [3]. | Allows long-term, non-invasive tracking of clock gene activity with high temporal resolution. |
| AAV Vectors for Cell-Specific Manipulation (e.g., AAV-flex-GFP) | For selective labeling or manipulation of specific SCN neuronal populations (e.g., VIP- or AVP-expressing cells) in Cre-driver mouse lines [7]. | Enables functional studies of specific SCN subpopulations via optogenetics, chemogenetics, or ablation. |
Core Mechanism and Network Motifs
The mammalian circadian clock is a cell-autonomous transcriptional-translational feedback system that generates ~24-hour rhythms in physiology and behavior. This intrinsic timing mechanism allows organisms to anticipate and adapt to daily environmental cycles [8] [9].
Core Clock Components: The central oscillator consists of transcriptional activators (CLOCK and BMAL1) and repressors (PER1/2/3 and CRY1/2). CLOCK and BMAL1 form a heterodimer that binds to E-box regulatory elements, activating transcription of Per and Cry genes. After translation, PER and CRY proteins form complexes that translocate back to the nucleus to repress CLOCK:BMAL1 activity, completing a approximately 24-hour cycle [8] [9].
Repressilator Motif: Recent systems biology approaches have identified a "repressilator" motif—a series of three sequential inhibitions—as a core design principle. This motif involves CRY inhibiting PER, PER inhibiting REV-ERB, and REV-ERB inhibiting CRY, creating a robust oscillatory circuit [10].
Additional Feedback Loops:
- REV-ERB/ROR Loop: CLOCK:BMAL1 activates transcription of Rev-erbα/β, which compete with ROR proteins for binding to ROR elements (RREs) on the Bmal1 gene, providing negative (REV-ERB) and positive (ROR) regulation [9].
- DBP/NFIL3 Loop: DBP and NFIL3 bind to D-box elements on circadian promoters, adding another layer of regulation [9].
Diagram Title: Core Circadian Clock Feedback Loops
Diagram Title: Circadian Repressilator Motif
Troubleshooting Common Experimental Issues
Unexpected arrhythmicity in animal models
Problem: Lack of consistent circadian rhythms in transgenic animals despite correct genetic background.
Solutions:
- Verify time of day for experiments: Fundamental physiological parameters including hormone levels, core body temperature, and gene expression show strong circadian variation [11]. Sample at multiple time points to capture rhythmicity.
- Control for period jumps: Mathematical models reveal that small parameter changes can cause dramatic period shifts or arrhythmicity due to coexisting oscillators in the network [10].
- Check genetic redundancy: Knockouts of single clock genes (Per1, Per2, Cry1, Cry2) may not cause arrhythmicity due to paralog compensation. Double knockouts (e.g., Cry1/Cry2 or Per1/Per2) are often necessary [9].
High variability in gene expression measurements
Problem: Inconsistent results when measuring oscillating transcripts or proteins.
Solutions:
- Standardize sampling time: Always collect samples at the same circadian time, noting that rodent daytime corresponds to their rest phase while nighttime is their active phase [11].
- Account for tissue-specific differences: Peripheral clocks may have different phases than the SCN master clock. Reference tissue-specific phase maps when designing experiments [9].
- Include appropriate controls: Use Bmal1-luciferase or Per2-luciferase reporter systems to verify circadian phase in real-time [9].
Difficulty reproducing transcriptional profiling results
Problem: Inconsistent findings in chromatin immunoprecipitation (ChIP) or RNA-seq experiments.
Solutions:
- Consider researcher chronotype effects: The timing of experiment execution by "night owl" versus "morning lark" researchers can significantly impact results, as demonstrated by the DBP transcription factor discovery [11].
- Control for epigenetic states: Clock transcription factor occupancy and RNA polymerase II recruitment undergo circadian regulation, influencing transcriptional activity independent of mRNA levels [8].
- Account for post-transcriptional regulation: ~5-20% of transcripts oscillate at the mRNA level, but additional layers exist through splicing, polyadenylation, nuclear export, and translation [8].
Inconsistent hormonal rhythm data in human studies
Problem: Variable results when measuring circadian hormone fluctuations.
Solutions:
- Implement strict inclusion criteria: Exclude participants with recent shift work, irregular sleep patterns, or drug/alcohol use that disrupts circadian rhythms [12].
- Standardize pre-test conditions: Control light exposure, posture, exercise, and dietary habits as these are potent circadian zeitgebers [12].
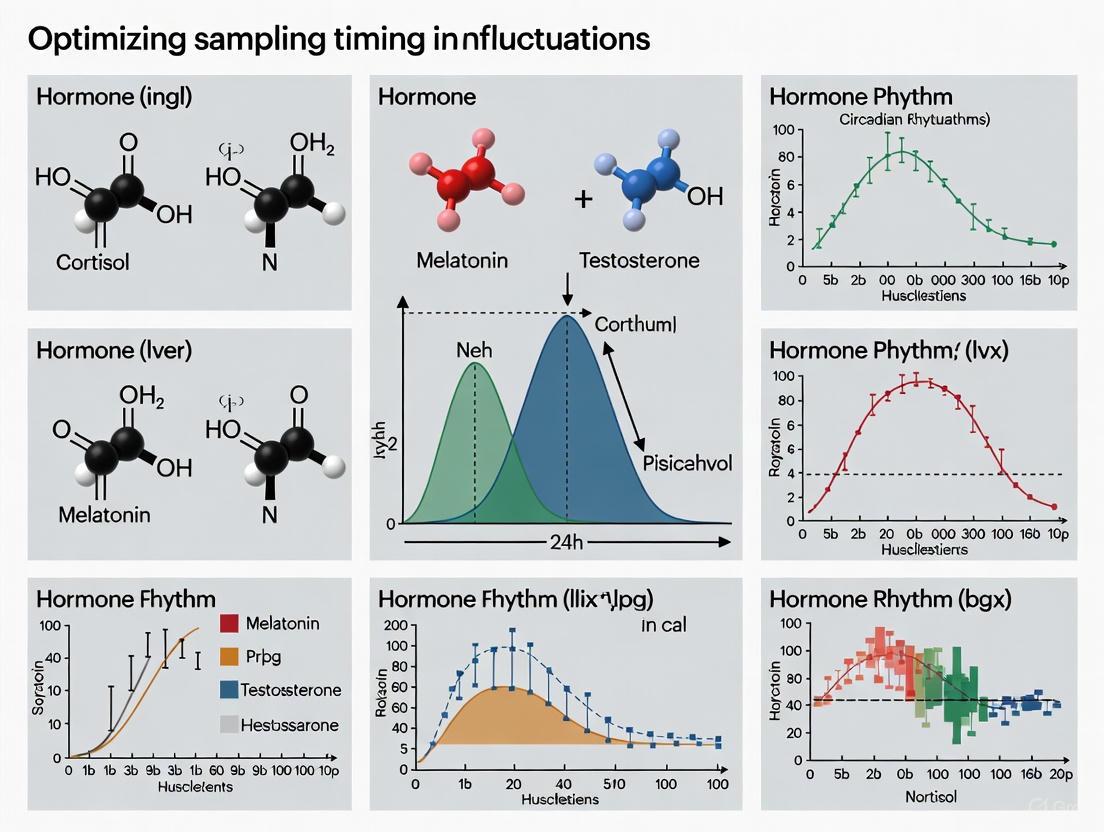
- Time sampling appropriately: Many hormones (cortisol, melatonin, PTH) have distinct circadian profiles. Sample frequently enough to capture peaks and troughs [12] [13].
Methodological Guidelines
Experimental Design for Circadian Studies
Table 1: Key Considerations for Circadian Rhythm Research
| Factor | Recommendation | Rationale |
|---|---|---|
| Sampling Density | Minimum of 4-6 time points per 24 hours | Necessary to accurately characterize rhythm waveform and detect peak timing [14] |
| Experimental Timing | Report exact time of day for all procedures | Critical for reproducibility; rodent studies should note time relative to light/dark cycle [11] |
| Light Control | Standardize light intensity and wavelength | Light is primary zeitgeber for SCN entrainment; ipRGCs are particularly sensitive to 480nm blue light [9] |
| Longitudinal vs Transverse Sampling | Hybrid designs preferred when possible | Combines individual rhythm assessment with population generalization while controlling inter-individual differences [14] |
Essential Research Reagents and Tools
Table 2: Key Research Reagents for Circadian Studies
| Reagent/Tool | Primary Function | Experimental Application |
|---|---|---|
| Bmal1-luciferase reporter | Real-time monitoring of clock function | Tracking circadian phase in live cells or tissues [9] |
| PER2::LUCIFERASE systems | Visualization of molecular clock timing | Longitudinal monitoring of circadian oscillations in SCN slices and peripheral tissues [9] |
| CK1δ/ε inhibitors | Modulating clock speed | Testing period length regulation and identifying FASPS-like phenotypes [9] |
| REV-ERB agonists/antagonists | Manipulating secondary feedback loop | Probing Bmal1 regulation and metabolic connections [9] |
| Melatonin ELISA/RIA | Phase marker assessment | Determining circadian phase in human studies; peak occurs 2h before sleep onset [12] |
Protocol: Measuring Circadian Hormone Fluctuations in Human Research
Participant Screening:
- Apply strict inclusion/exclusion criteria: exclude shift workers, individuals with sleep disorders, recent transmeridian travel, or substance use affecting circadian rhythms [12].
- Assess chronotype (morningness/eveningness) and maintain consistent sleep-wake schedules for 1-2 weeks prior to testing [12].
Pre-Study Preparation:
- Standardize light conditions (<10 lux during biological night, ~90-150 lux during day).
- Control posture (seated or semi-recumbent), exercise, and dietary intake throughout sampling period [12].
Sampling Protocol:
- Collect samples at minimum of 4-hour intervals across 24-hour period, with increased density (1-2 hour intervals) around anticipated peaks/troughs.
- For melatonin: sample under dim light conditions (<10 lux) with documented light levels at each collection [12].
- Process samples immediately or freeze at -80°C until analysis.
Data Analysis:
- Use cosine fitting or similar mathematical modeling to determine mesor, amplitude, and acrophase.
- Apply Lomb-Scargle periodogram for unequally spaced data points [14].
Quantitative Data Reference
Table 3: Circadian Parameters of Core Clock Components
| Component | Peak Phase (ZT) | Function | Knockout Phenotype |
|---|---|---|---|
| CLOCK | Constant | Basic helix-loop-helix transcription factor | Arrhythmic in constant darkness [9] |
| BMAL1 | ZT 0-4 | Heterodimerizes with CLOCK; binds E-box elements | Complete arrhythmicity [9] |
| PER1/2 | ZT 12-16 | Negative feedback repressors | Short period (Per1); arrhythmic (Per2) [9] |
| CRY1/2 | ZT 12-16 | Potent transcriptional repressors | Short period (Cry1); long period (Cry2) [10] |
| REV-ERBα | ZT 8-12 | Nuclear receptor repressor | Altered period length, metabolic defects [9] |
ZT (Zeitgeber Time): ZT0 represents lights on in standard light-dark cycles
FAQs: Hormonal Roles in Circadian Research
Q1: What is the practical difference between a hormone acting as a driver, a zeitgeber, or a tuner in the context of circadian regulation? Understanding these distinct roles is crucial for designing sampling protocols.
- Driver: A hormone that initiates or directly causes a specific physiological event on a circadian timescale. Its presence is the primary signal for a change. Example: The sharp rise in cortisol levels around dawn acts as a key driver for increasing blood glucose and preparing the body for the active phase [15].
- Zeitgeber: A hormone that synchronizes or resets the phase of the central or peripheral circadian clocks. It functions as a timing cue. Example: Insulin secreted in response to a meal can act as a zeitgeber for peripheral clocks in the liver, synchronizing metabolic processes with food intake [15] [16].
- Tuner: A hormone that modulates the amplitude or robustness of circadian rhythms without necessarily initiating a event or resetting the clock's phase. It fine-tunes the system's response. Example: Thyroid hormones can tune the expression of clock genes in various tissues, thereby modulating the strength of circadian rhythmicity in metabolic rate [16].
Q2: Why is the timing of sample collection so critical for measuring hormones like cortisol and melatonin? Many hormones exhibit strong circadian rhythms, and their concentration and functional impact vary dramatically throughout the 24-hour cycle [17] [15]. Collecting a sample at the wrong time can lead to a misdiagnosis or a complete misunderstanding of the system's state.
- Cortisol peaks in the early morning around dawn. A sample taken in the afternoon will show a much lower level, which is normal and should not be interpreted as adrenal insufficiency [17] [15].
- Melatonin is secreted during the circadian night. Its levels are nearly undetectable during the day. Sampling under dim light conditions in the evening to determine Dim Light Melatonin Onset (DLMO) is the gold standard for assessing circadian phase in humans [18] [15].
Q3: How can we accurately determine an individual's circadian phase for scheduling hormone sampling? The most reliable method is to measure the Dim Light Melatonin Onset (DLMO) [18]. This involves:
- Protocol: Collecting saliva or blood samples every 30-60 minutes in the hours before habitual bedtime under very dim light conditions (<10 lux).
- Analysis: Plotting melatonin concentration against time. The DLMO is typically defined as the time when melatonin concentration crosses a fixed threshold (e.g., 3-4 pg/mL in saliva) or rises 2 standard deviations above the daytime mean [18].
- Emerging Methods: Mathematical models that use actigraphy data (sleep-wake patterns and light exposure) to predict DLMO are in development and can offer a less burdensome alternative [18].
Q4: What are the consequences of mistiming hormone therapy or sampling in relation to circadian rhythms? Misalignment can lead to suboptimal efficacy and increased adverse effects [17].
- Therapy: Administering glucocorticoids at night, instead of in the early morning, can disrupt the natural cortisol rhythm and lead to metabolic side effects. Conversely, a bedtime dose of modified-release hydrocortisone can be used therapeutically to suppress the early-morning ACTH surge in congenital adrenal hyperplasia [17].
- Research: Sampling a hormone without regard to its circadian phase introduces significant noise and variability into the data, potentially obscuring true treatment effects or leading to incorrect conclusions about hormone levels and their relationships [17] [19].
Troubleshooting Guide: Common Experimental Pitfalls
| Problem | Possible Cause | Solution | Consequence of Inaction |
|---|---|---|---|
| High variability in hormone assay results between subjects. | Uncontrolled sampling times relative to individual circadian phases and chronotypes. | Standardize sampling times based on each participant's wake time or determine individual circadian phase via DLMO [17] [18]. | Inability to detect significant effects; data reflects timing differences rather than physiological state. |
| Inability to detect a rhythm in a hormone known to be circadian. | Sample collection interval is too long (low resolution) or does not cover the entire anticipated cycle. | Increase sampling frequency (e.g., every 2-4 hours over a 24-48 hour period) to adequately capture peaks and troughs [18]. | The rhythm and its key parameters (acrophase, amplitude) will be missed. |
| Observed hormone profile is contradictory to published literature. | Lack of control for masking effects, such as light exposure, sleep-wake state, or food intake. | For core circadian assessment, implement constant routine or forced desynchrony protocols. Control meal timing and light exposure before and during sampling [18] [15]. | The measured profile reflects environmental stimuli, not the endogenous circadian rhythm. |
| A hormonal intervention shows no effect or unexpected side effects. | The therapy was administered at a biologically inappropriate time, ignoring its intended role as driver, zeitgeber, or tuner. | Review the circadian pharmacology (chronotherapy) of the drug. Align administration time with the target pathway's sensitive phase [17]. | Reduced therapeutic efficacy and increased risk of adverse events, compromising the experiment and patient well-being. |
Key Experimental Protocols
Protocol 1: Determining Circadian Phase via Dim Light Melatonin Onset (DLMO)
Objective: To determine the timing of an individual's central circadian clock by measuring the onset of melatonin secretion under dim light conditions [18].
Materials:
- Dim red light source (<10 lux)
- Saliva collection kits (e.g., Salivettes)
- Freezer (-20°C or lower)
- Reliable melatonin immunoassay
- Actigraphy watch (to monitor activity and light exposure)
Procedure:
- Participant Preparation: Instruct the participant to avoid caffeine, alcohol, and heavy exercise for 12 hours prior. They should not brush their teeth or eat a major meal 1 hour before sampling begins.
- Light Control: 2-3 hours before habitual bedtime, move the participant to a dimly lit room (<10 lux, using dim red light). Maintain this until sampling is complete.
- Sample Collection: Beginning 6 hours before and ending 2 hours after habitual bedtime, collect saliva samples every 30 minutes.
- Sample Handling: Centrifuge saliva samples if required by the collection kit, and immediately freeze at -20°C or below.
- Data Analysis: Assay samples for melatonin. Plot concentration against clock time. Calculate DLMO using a consistent threshold method (e.g., absolute threshold of 3-4 pg/mL) [18].
Protocol 2: Assessing a Hormone's Circadian Rhythm
Objective: To characterize the 24-hour profile of a target hormone.
Materials:
- Intravenous cannula for frequent blood sampling or supplies for repeated saliva/urine collection.
- Appropriate collection tubes and freezer storage.
- Validated hormone assay.
- Controlled environment (if possible).
Procedure:
- Study Design: Decide on sampling interval. A 4-hour interval will give a coarse rhythm; 2-hour or 1-hour intervals are preferred for robust analysis.
- Standardization: Admit participants to a clinical research unit. Standardize meals, light-dark cycles, and sleep-wake times for at least 48 hours prior to sampling.
- Sample Collection: Collect samples at the predetermined interval across a full 24-hour cycle (or longer for reliability).
- Data Analysis: Use specialized software (e.g., Cosinor analysis) to fit a curve to the data. Determine key rhythm parameters:
- Mesor: The rhythm-adjusted mean.
- Amplitude: Half the distance between the peak and trough.
- Acrophase: The time at which the peak of the rhythm occurs.
Signaling Pathway & Experimental Workflow
Hormone-Circadian Interactions Diagram
Circadian Hormone Sampling Workflow
The Scientist's Toolkit: Research Reagent Solutions
| Essential Material | Function in Circadian Endocrine Research |
|---|---|
| Salivettes / Saliva Collection Kits | Standardized collection of saliva for hormone assays (e.g., melatonin, cortisol) without the need for venipuncture, enabling frequent sampling [18]. |
| Dim Red Light Source (<10 lux) | Allows for safe participant movement and sample handling during DLMO protocols without suppressing melatonin secretion, which is suppressed by blue and white light [18]. |
| Actigraphy Watch | Objectively monitors sleep-wake cycles, rest-activity rhythms, and light exposure for weeks at a time. Data can be used to estimate circadian phase and detect rhythm disruptions [18]. |
| Validated Immunoassay Kits | For the quantitative measurement of specific hormones (e.g., ELISA for cortisol, melatonin, TSH). Critical for generating the high-quality, specific data needed for rhythm analysis. |
| Controlled Environment Chambers | Allows researchers to standardize or manipulate light-dark cycles, temperature, and feeding schedules, eliminating confounding "masking" effects from the environment on circadian rhythms. |
This technical support guide provides essential information for researchers studying circadian hormone fluctuations. Proper experimental design requires a deep understanding of the dynamic, time-dependent nature of these hormones. The content below addresses common experimental challenges and provides methodologies to optimize sampling protocols for reliable, reproducible data in circadian research.
Hormone Profiles & Data Tables
Melatonin Profile
Melatonin, produced by the pineal gland, is a crucial hormonal marker of the dark phase. Its secretion is tightly controlled by the suprachiasmatic nucleus (SCN), which integrates light information from the retina [20].
Table 1: Melatonin Circadian Profile in Humans
| Parameter | Details |
|---|---|
| Primary Source | Pineal Gland [20] |
| Peak Secretion | During the night (dark phase) [20] |
| Key Regulator | SCN via light-dark cycle input [20] |
| Phase Response | Timed intake can advance or delay circadian phases [20] |
| Primary Receptors | MT1 and MT2 (G-protein coupled) [20] |
Glucocorticoid Profile
Glucocorticoids (e.g., cortisol in humans, corticosterone in rodents) are steroid hormones with a strong circadian rhythm that anticipates the active phase. Their release is characterized by a circadian rhythm with a superimposed ultradian rhythm [20].
Table 2: Glucocorticoid Circadian Profile in Humans
| Parameter | Details |
|---|---|
| Primary Source | Adrenal Cortex (zona fasciculata) [20] |
| Peak Secretion | Early morning, around wake-up time (Cortisol Awakening Response) [20] |
| Key Regulators | HPA axis (circadian control), SCN via splanchnic nerve (adrenal sensitivity) [20] |
| Molecular Role | Rhythm driver via GREs; Zeitgeber via clock gene regulation (e.g., Per) [20] |
| Receptors | Mineralocorticoid Receptor (MR), Glucocorticoid Receptor (GR) [20] |
Thyroid Hormone Profile
The hypothalamic-pituitary-thyroid (HPT) axis is under circadian control. While the thyroid hormones T4 and T3 themselves have relatively low-amplitude rhythms, the hormone that stimulates them, TSH, exhibits a clear daily variation [21].
Table 3: Thyroid-Stimulating Hormone (TSH) Circadian Profile in Humans
| Parameter | Details |
|---|---|
| Primary Source | Thyrotrophs in anterior pituitary [21] |
| Peak Secretion | Exhibits a clear daily rhythmicity; specific peak timing is a key research variable [21] |
| Key Regulator | Hypothalamic TRH; negative feedback by T3/T4 [21] |
| Research Note | Daily TSH secretion profiles are disrupted in some patients with hypothyroidism and hyperthyroidism [21] |
Experimental Protocols & Methodologies
Protocol 1: Assessing Circadian Hormone Rhythms in Human Blood
This protocol outlines the procedure for collecting serum samples to profile daily hormonal rhythms, such as those of TSH, cortisol, and melatonin.
- Participant Preparation: Recruit participants based on strict inclusion criteria (e.g., specific age, health status, chronotype). Standardize their sleep-wake cycles and meal timing for at least one week prior to sampling in a controlled environment. Exclude shift workers or those with recent transmeridian travel [15].
- Sample Collection: Establish a 24-hour sampling schedule. For a high-resolution rhythm, collect blood samples at least every 2-4 hours, including during the night. For key hormones like cortisol, more frequent sampling (e.g., hourly) may be needed to capture ultradian pulses [20]. The exact time of each sample must be meticulously recorded.
- Sample Processing: Centrifuge blood samples to separate serum or plasma. Aliquot and immediately freeze the samples at -80°C to prevent hormone degradation.
- Hormone Assay: Use sensitive and validated immunoassays (e.g., ELISA, RIA) or mass spectrometry for absolute quantification [22]. All samples from a single participant should be analyzed in the same assay batch to minimize inter-assay variability.
- Data Analysis: Plot hormone concentrations against time of day. Use cosinor analysis or other non-linear regression models to determine the rhythm's mesor (mean), amplitude (peak-trough difference), and acrophase (time of peak) [13].
Protocol 2: Optimizing Dosing Time in Preclinical Models (e.g., Teriparatide)
This methodology, derived from a recent trial, describes how to investigate the chronotherapeutic potential of a drug in an animal model [13].
- Animal Model: Use a validated preclinical model (e.g., ovariectomized rats for postmenopausal osteoporosis research).
- Group Allocation: Randomize animals into two or more groups. The experimental groups receive the drug (e.g., Teriparatide) at different, fixed times of the day (e.g., 08:00 vs. 20:00). A control group receives a vehicle.
- Environmental Control: Maintain all animals under strict 12-hour light/12-hour dark cycles with ad libitum access to food and water. Drug administration should be performed with minimal disturbance to the animals.
- Sample Collection & Analysis: After a predetermined treatment period, collect blood and tissue samples (e.g., liver) at multiple time points. Analyze relevant biomarkers (e.g., bone turnover markers like CTX and P1NP for Teriparatide) and, if possible, clock gene expression in the target tissue [13].
- Outcome Measurement: Compare the efficacy of the drug (e.g., change in bone mineral density, biomarker levels) between the different dosing-time groups.
The Scientist's Toolkit: Research Reagent Solutions
Table 4: Essential Reagents for Circadian Hormone Research
| Reagent / Material | Function in Research |
|---|---|
| ELISA or RIA Kits | Immunoassay-based absolute quantification of hormone levels in serum, plasma, or tissue homogenates. |
| LC-MS/MS Systems | Mass spectrometry-based method for highly precise and multiplexed absolute quantification of proteins/hormones, as in MS-QBiC [22]. |
| Stable Isotope-Labeled Internal Standards | Essential for mass spectrometry; allows for precise absolute quantification by correcting for sample loss and ionization variability [22]. |
| Cell-Free Protein Synthesis System | Used in MS-QBiC for simple, high-throughput preparation of isotope-labeled protein standards for absolute proteomics [22]. |
| Specific Hormone Agonists/Antagonists | Pharmacological tools to manipulate hormone signaling pathways (e.g., MT1/MT2 receptor agonists for melatonin studies) [20]. |
| RNA/DNA Isolation Kits & qPCR Reagents | For extracting and quantifying rhythmic expression of clock genes (e.g., BMAL1, PER, CRY) and clock-controlled genes in tissues. |
Troubleshooting FAQs
FAQ 1: My hormone assay data is noisy and shows no clear rhythm. What could be wrong?
- Inconsistent Sampling Times: Even small variations in daily sampling time can obscure a rhythm. Ensure a strict, recorded schedule is followed.
- Uncontrolled Environmental Factors: Light exposure, activity, and meal timing are potent zeitgebers. Failure to control these in a lab setting or to standardize patient instructions (e.g., fasting status, sleep/wake time) will increase variability [15]. Implement strict environmental controls for animal studies and detailed participant guidelines for human studies.
- Insufficient Sampling Resolution: A rhythm with a peak at one time of day and a trough 12 hours later cannot be captured with 12-hour sampling. Increase sampling frequency, especially around the anticipated peak and trough [20].
- Assay Sensitivity: Verify that your assay's detection limit is sufficiently low to measure the hormone's trough concentrations.
FAQ 2: How do I determine the optimal time to sample a specific circadian hormone in a new model?
- Literature Review: First, consult existing literature for the hormone's profile in a similar model or species.
- Pilot Kinetics Study: If no data exists, conduct a pilot 24-hour kinetics study. Sample blood or tissue every 2-4 (for broad peaks) or even every 30-60 minutes (for sharp pulses like cortisol) over a 24-hour period. This will define the baseline rhythm and identify the peak (acrophase) and trough [20] [13].
- Leverage Clock Genes: If directly measuring the hormone is difficult, the expression phase of core clock genes (e.g., Per2 mRNA in the tissue of interest) can serve as a proxy for the internal time of that tissue, helping to infer the timing of downstream processes [21].
FAQ 3: What is the best practice for administering hormones in chronotherapy studies? The goal is to align the exogenous hormone with the body's endogenous physiological rhythm.
- Glucocorticoids: Administer replacement therapy (e.g., hydrocortisone) in the early morning to mimic the natural dawn rise. For specific goals like suppressing ACTH in congenital adrenal hyperplasia, modified-release formulations taken at night can be used [17].
- Melatonin: Administer in the evening to advance the sleep-wake cycle (e.g., for Delayed Sleep Phase Disorder) or in the morning to delay it, depending on the desired phase shift [20].
- Thyroid Hormone (Levothyroxine): Consistency is key. While typically taken in the morning on an empty stomach, bedtime administration can be equally effective if meals are spaced sufficiently, offering flexibility for patient adherence [17].
Signaling Pathway Diagrams
Melatonin Secretion Pathway
Glucocorticoid Secretion & Action
Thyroid Hormone Axis & Activation
Impact of Circadian Disruption on Hormonal Homeostasis and Disease Risk
Fundamental Concepts FAQ
1. What is the core molecular mechanism of the circadian clock?
The mammalian circadian clock operates through an autoregulatory transcriptional-translational feedback loop (TTFL) with a period of approximately 24 hours [3] [23] [24]. The core components are:
- Positive Regulators: The proteins CLOCK and BMAL1 form a heterodimer. This complex binds to E-box enhancer elements in the genome, driving the transcription of various genes, including those for the negative regulators,
Per(Period) andCry(Cryptochrome) [3] [24]. - Negative Regulators: PER and CRY proteins accumulate in the cytoplasm, form complexes, and translocate to the nucleus. There, they interact with the CLOCK:BMAL1 complex, inhibiting their own transcription [3] [23].
- Post-Translational Modifications: Enzymes like Casein Kinase 1δ/ε (CK1δ/ε) phosphorylate PER proteins, targeting them for proteasomal degradation. This degradation releases the inhibition on CLOCK:BMAL1, allowing the cycle to restart [3] [23]. This entire cycle takes about 24 hours to complete.
The following diagram illustrates this core molecular feedback loop:
2. How is the circadian system organized within the body?
The system is hierarchically organized [3] [24] [25]:
- Master Clock: Located in the suprachiasmatic nucleus (SCN) of the hypothalamus. It consists of about 20,000 neurons and is directly entrained by light input from the retina via the retinohypothalamic tract (RHT) [3] [24] [25].
- Peripheral Clocks: Found in virtually all cells and tissues (e.g., liver, heart, kidney). They are synchronized by the SCN through hormonal, neural, and behavioral cues (e.g., feeding-fasting cycles) [3] [24] [25].
- Key Difference: The SCN has strong intercellular coupling, making its rhythm robust and resistant to change. Peripheral clocks are more susceptible to adjustment by local signals, such as meal timing [25].
3. Why is circadian rhythm amplitude important for metabolic health?
Circadian amplitude refers to the strength of the oscillation between peak and trough of circadian processes [25]. A high amplitude indicates a robust, well-synchronized circadian system.
- High Amplitude: Ensures optimal regulation of metabolism, hormone secretion, and energy balance. It is associated with improved health outcomes [25].
- Low Amplitude: Results from disruption (e.g., shift work, night light exposure) and leads to misalignment between the central and peripheral clocks. This desynchronization is linked to an increased risk of metabolic diseases like insulin resistance, obesity, and type 2 diabetes [25].
Experimental Design & Troubleshooting Guide
4. What are the primary causes of circadian disruption that I should model in experimental settings?
Common drivers of circadian disruption relevant to hormonal and disease research include:
- Light Exposure Aberrations: Shift work schedules, jet lag (especially eastward travel), and exposure to blue light at night [26] [25] [27].
- Timing of Nutrient Intake: Mistimed feeding, such as food consumption during the normal resting phase, is a potent disruptor of peripheral clocks in metabolic organs like the liver [3] [24].
- Genetic Mutations: Knockout or mutation of core clock genes (e.g.,
Clock,Bmal1,Per,Cry) to study the molecular basis of disruption [3] [23].
5. How does circadian disruption impact hormonal homeostasis?
Circadian disruption desynchronizes the rhythmic secretion of key hormones. The table below summarizes the impact on major hormonal pathways.
Table 1: Impact of Circadian Disruption on Key Hormones
| Hormone/Pathway | Normal Circadian Rhythm | Consequence of Disruption | Associated Disease Risk |
|---|---|---|---|
| Melatonin | Secretion peaks during the night, promoting sleep [26]. | Suppressed secretion due to evening light exposure; altered rhythm in critical illness [26] [28]. | Sleep disorders, metabolic syndrome, impaired immune function [26] [29]. |
| Glucocorticoids (e.g., Cortisol) | Peak in the early morning, aiding wakefulness and energy mobilization [25]. | Rhythm flattening (loss of amplitude) and phase shift [28]. | Immune dysregulation, metabolic disorders, mood disturbances [3] [28]. |
| Metabolism-Regulating Hormones (Insulin, Leptin) | Rhythmic secretion synchronized with feeding-fasting cycles [3] [25]. | Insulin resistance, impaired glucose tolerance, disrupted lipid metabolism [3] [25]. | Type 2 Diabetes, Obesity, Cardiovascular Disease [3] [29] [25]. |
6. What are the critical methodological points for sampling to capture circadian hormone fluctuations?
- High Sampling Density: Do not assume one timepoint is sufficient. The 24-hour rhythm requires dense sampling to accurately determine the phase (timing of peak), amplitude (strength of rhythm), and mesor (mean value) [28].
- Control Zeitgebers: Strictly control and record environmental cues, especially light intensity and spectrum, and feeding schedules [28] [25]. In human studies, this is challenging but critical.
- Multiple Biomarkers: Correlate hormonal assays with other circadian biomarkers for a robust readout:
The following workflow outlines a robust protocol for a circadian sampling experiment:
The Scientist's Toolkit: Key Research Reagents and Materials
Table 2: Essential Reagents and Tools for Circadian Hormone Research
| Item/Category | Specific Examples | Function in Research |
|---|---|---|
| Antibodies for Immunoassays | Anti-Melatonin; Anti-Cortisol; Anti-PER2/BMAL1 (for IHC/WB) | Quantifying hormone levels and core clock protein expression/ localization in tissue or serum samples. |
| ELISA/Kits | Melatonin ELISA Kit; Cortisol ELISA Kit | Provide a standardized, high-throughput method for accurate hormonal concentration measurement from biological fluids. |
| qPCR Reagents | Primers for Per2, Bmal1, Cry1, Rev-erbα; Reverse Transcriptase; SYBR Green |
Measuring rhythmic expression of core clock genes in tissue biopsies or blood samples as a molecular readout of circadian phase. |
| Actigraphy Devices | Worn like a watch on the wrist | Objectively monitoring rest-activity cycles in human subjects or animal models in their home environment over long periods. |
| RNA Sequencing | Total RNA extraction kits; library prep kits | Profiling the full circadian transcriptome to identify rhythmically expressed genes and pathways in tissues of interest. |
7. Troubleshooting: My experiment shows high variability in hormonal rhythms between subjects. What could be the cause?
- Problem: High inter-individual variability masking a significant circadian rhythm.
- Solution:
- Determine Chronotype: Account for inherent differences in circadian timing (e.g., "morning larks" vs. "night owls") using questionnaires like the Munich ChronoType Questionnaire [26] [29].
- Use Internal Time: Align samples based on an internal circadian marker (e.g., dim-light melatonin onset (DLMO)) instead of external clock time [29].
- Increase Sample Size: The inherent variability in circadian parameters necessitates larger sample sizes to achieve statistical power.
- Standardize Pre-Study Conditions: Ensure subjects maintain a stable sleep-wake cycle for at least one week before sampling to reduce social jetlag [26].
8. How can I address the challenge of sampling frequently during the night without disturbing the subject's rhythm?
- Problem: Frequent blood sampling during the sleep period can itself disrupt sleep and alter circadian rhythms.
- Solution:
- Automated Sampling: Use in-patient clinical research units with long-line catheters that allow sampling from an adjacent room without entering the subject's bedroom.
- Saliva/Uridine Sampling: For hormones like melatonin and cortisol that are measurable in saliva, use non-invasive saliva collection kits that subjects can use themselves with minimal light exposure.
- Habituation: Allow subjects to acclimatize to the sleep laboratory for 1-2 nights before the actual sampling night to reduce first-night effects.
Application in Drug Development
9. What is chronotherapy, and why is it relevant to drug development?
Chronotherapy is the practice of timing medication administration to coincide with specific phases of the circadian cycle to maximize efficacy and minimize toxicity [23] [29] [30]. This is crucial because:
- Drug Metabolism and Targets are Rhythmic: The expression and activity of many drug-metabolizing enzymes (Cytochrome P450 family), transporters, and cellular targets are under circadian control [23] [30].
- Improved Outcomes: Studies in cancer and rheumatoid arthritis have shown that timing chemotherapy or anti-inflammatory drugs can reduce side effects like nausea and improve treatment efficacy [29] [30].
10. Are there tools to help determine the optimal timing for drug administration?
Yes, this is an active area of research. Tools are being developed to move chronotherapy into clinical practice:
- Computational Models: Tools like TimeTeller use a combination of molecular data (e.g., from a few time-point blood samples) and computational modeling to characterize an individual's circadian rhythm and predict optimal treatment timing [29].
- Programmable Drug Delivery Systems: These are technologies designed to release drugs at a specific, pre-programmed time to align with the patient's internal clock, even when taken orally at a different time [30].
From Theory to Practice: Methodologies for Circadian Sampling Design
Chronotherapy is a branch of clinical pharmacology that optimizes medical treatment by aligning drug administration with the body's natural circadian rhythms [31]. The effectiveness and toxicity of many medications can vary significantly based on administration time, making timing a crucial factor in treatment plans [31]. This approach is particularly relevant for endocrine therapies, as many hormones follow a robust circadian rhythm, and administering them at inappropriate times may result in suboptimal efficacy or increased adverse effects [17].
For researchers investigating circadian hormone fluctuations, understanding these principles is fundamental to designing experiments that accurately capture physiological states and therapeutic outcomes. The following guide addresses common experimental challenges and provides practical methodologies for implementing chronotherapy principles in research settings.
Foundations of Chronobiology
The Circadian Timing System
The body's circadian rhythms are generated by a central pacemaker located in the suprachiasmatic nucleus (SCN) of the hypothalamus [32] [15]. This "master clock" regulates endocrine activity and other biological functions on an approximately 24-hour cycle [17]. This rhythmic gene expression extends beyond the SCN to "peripheral clocks" in most cells and tissues, driving processes including sleep-wake cycles, feeding-fasting patterns, and metabolic activity [17] [15].
The circadian system influences drug effects through two primary mechanisms:
- Chronopharmacokinetics: Circadian fluctuations affect drug absorption, distribution, metabolism, and excretion [31].
- Chronopharmacodynamics: Drug activity and duration vary based on the timing of administration relative to biological rhythms [31].
Frequently Asked Questions (FAQs)
Q1: Why is drug administration timing critical in circadian hormone research?
The timing of drug administration is critical because the endocrine system exhibits strong circadian rhythms [17]. Administering therapies at inappropriate times may result in suboptimal efficacy or increased adverse effects [17]. For example, bone turnover markers, including parathyroid hormone, C-terminal telopeptide of type I collagen, and N-terminal propeptide of type I procollagen, all exhibit distinct diurnal variations [13]. Similarly, cortisol follows a pronounced circadian pattern with peak levels in the early morning [15].
Q2: How do I determine the optimal sampling times for circadian hormone studies?
Optimal sampling times should be determined based on established circadian profiles of your target analyte. The following table summarizes key circadian characteristics of relevant hormones:
| Hormone/Analyte | Peak Circadian Phase | Circadian Characteristics |
|---|---|---|
| Parathyroid Hormone (PTH) | 04:00 - 06:00 [13] | Distinct circadian profile with minimum levels between 16:00-18:00 [13] |
| Cortisol | Early morning [17] [15] | Physiological circadian rise in early morning; aligned with dawn in diurnal mammals [17] [15] |
| Bone Resorption Marker (CTX) | Night [13] | Pronounced diurnal variation: suppressed daytime, elevated nighttime [13] |
| Bone Formation Marker (P1NP) | Attenuated rhythm [13] | Relatively attenuated circadian amplitude compared to resorption markers [13] |
| Melatonin | ~02:00 - 04:00 (peak) [33] | Levels high at night, low during day; onset typically 2-3 hours before sleep [33] |
Q3: What tools are available for assessing circadian phase in human studies?
- Sleep Diaries & Actigraphy: Essential for confirming sleep-wake patterns across multiple cycles [32].
- Dim Light Melatonin Onset (DLMO): Gold standard for assessing circadian phase but requires serial salivary sampling in dim light before habitual sleep onset [32] [33].
- Morningness-Eveningness Questionnaire (MEQ): A 19-item self-assessment tool that correlates with melatonin onset timing and determines chronotype [33]. Scores range from 16-84, corresponding to melatonin onset between 18:00-00:00 [33].
Q4: How do I control for confounding factors that might disrupt circadian rhythms in study participants?
Implement these key controls:
- Standardize sleep-wake cycles and mealtimes before sampling [13] [15].
- Control light exposure, as light is the primary zeitgeber (synchronizer) for the SCN [32].
- Record exact timing of all interventions and samples [17] [13].
- For outpatient studies, use detailed participant training, diary cards, and video verification of intervention timing [13].
Troubleshooting Common Experimental Challenges
Problem: High variability in hormone measurements between participants.
- Solution: Account for individual chronotypes using the MEQ questionnaire [33]. The circadian profile of hormone secretion varies significantly between individuals and is influenced by age, comorbidities, sleep hygiene, and lifestyle [17].
Problem: Inconsistent results in drug response studies.
- Solution: Standardize and document administration time precisely. Even therapies with long-term effects can be influenced by circadian regulation of their targets [17]. Implement a system to monitor and verify intervention adherence, such as diary cards with timestamps [13].
Problem: Participants unable to maintain consistent circadian routines.
- Solution: Provide detailed training on maintaining regular daily routines [13]. Consider inpatient studies for critical sampling periods or use objective adherence monitoring like timestamps and video verification [13].
Experimental Protocols for Chronotherapy Research
Protocol 1: Assessing Chronotherapy Efficacy for Bone Agents
This protocol is adapted from a randomized controlled trial investigating teriparatide timing optimization [13].
Objective: To compare the effects of morning (08:00) versus evening (20:00) administration of teriparatide on bone turnover markers in postmenopausal women with osteoporosis [13].
Methodology:
- Design: Randomized, open-label, exploratory trial with 12-week intervention.
- Participants: 28 postmenopausal women (age 60-70) with lumbar spine T-score ≤ -3.0.
- Intervention: 20 µg/day teriparatide via subcutaneous injection at 08:00 or 20:00.
- Concomitant Therapy: Standardized calcium (1000-1500 mg/day) and cholecalciferol (800-1200 IU/day) [13].
- Primary Outcomes: Between-group differences in serum PTH, CTX, and P1NP profiles at baseline, 4 weeks, and 12 weeks [13].
- Adherence Monitoring: Participants record exact injection time on diary cards and submit daily videos of the injection process within 2 hours [13].
Protocol 2: Determining Circadian Phase
Objective: To accurately assess an individual's circadian phase for optimal experimental timing.
Methodology:
- Tools: Morningness-Eveningness Questionnaire (MEQ) for initial assessment [33].
- Dim Light Melatonin Onset (DLMO): For precise phase determination [32] [33].
- Procedure:
- Conduct MEQ to estimate circadian preference [33].
- For DLMO: Place participants in dim light (<50 lux) 5-7 hours before habitual sleep onset.
- Collect salivary samples every 30-60 minutes.
- Analyze melatonin concentrations to determine the time when levels rise above a threshold (typically 3-4 pg/mL) [32] [33].
- Application: Use DLMO results to schedule drug administration or sampling relative to individual circadian phase [33].
The Scientist's Toolkit: Essential Research Reagents & Materials
| Item | Function/Application | Example Use |
|---|---|---|
| Actigraphy Device | Objective monitoring of sleep-wake patterns and rest-activity cycles [32]. | Assessing circadian rhythm stability in outpatient study participants [32]. |
| Bright Light Box (>5000 lux) | Administering controlled light exposure for phase-resetting studies [33]. | Implementing phase advance protocols for morning light therapy (e.g., 30 min upon waking) [33]. |
| Salivary Melatonin Kits | Determining dim light melatonin onset (DLMO) for circadian phase assessment [32] [33]. | Establishing individual circadian timing before scheduling experimental interventions [33]. |
| Morningness-Eveningness Questionnaire (MEQ) | Assessing individual chronotype (morningness/eveningness preference) [33]. | Screening participants and stratifying by chronotype for study enrollment [33]. |
| Diary Cards | Self-reported recording of sleep, medication timing, and meals [13] [32]. | Tracking participant adherence to timing protocols in outpatient studies [13]. |
| Bone Turnover Marker Assays | Quantifying bone formation (P1NP) and resorption (CTX) markers [13]. | Evaluating time-dependent effects of bone-active agents like teriparatide [13]. |
Advanced Methodological Considerations
Individual Variability and Chronotype
Individual circadian rhythms vary significantly based on age, genetics, comorbidities, sleep hygiene, and lifestyle [17]. Recent research emphasizes the importance of considering chronotype—an individual's intrinsic preference for activity and alertness at certain times of day—in treatment planning [17]. For example, administering a drug at the same clock time to morning-types versus evening-types may produce different effects due to their misaligned internal circadian phases.
Future Research Directions
Current limitations in chronotherapy research include incomplete evidence bases for optimal timing of many therapies and practical challenges with long-acting medications and patient compliance with time-targeted regimens [17]. Future research should focus on prospective controlled trials assessing both short-term outcomes and long-term safety, with systematic incorporation of chronotype into treatment planning [17].
Frequently Asked Questions
1. When is an equispaced design the best choice for my circadian experiment? An equispaced design is statistically optimal when your study investigates a rhythm with a known period (e.g., the 24-hour circadian cycle). For a fixed sample size, measurements taken at equal intervals over the period provide the highest statistical power for rhythm detection [34] [35]. This design maximizes the ability to detect oscillatory signals across all potential phase alignments (acrophases) under the cosinor model [34].
2. What sampling strategy should I use if the rhythm's period is unknown? For rhythms of unknown periodicity, standard equispaced designs can introduce systematic biases and blind spots, particularly near the Nyquist rate [34]. In this context, you should employ optimized sampling designs. These are constructed using mathematical frameworks to maximize statistical power across a continuous range of candidate periods or a predetermined discrete set of periods you wish to investigate [34].
3. My samples were not collected at equispaced times. Can I fix this statistically? Yes, statistical methods can help mitigate the problems of suboptimal designs. Weighted trigonometric regression is one approach, where samples collected at underrepresented time points are assigned higher weights [35]. The weights are often the normalized reciprocals of estimates from a kernel density estimator of sample collection times, which helps improve inference [35].
4. Besides period uncertainty, what other factors justify a non-equispaced design? Logistical and ethical constraints in human studies often make strict equispaced sampling impractical or impossible [35]. Examples include:
- The unethical nature of collecting samples from ill patients during their sleep [35].
- Use of data from multi-cohort repositories where the investigator had no control over original sampling times [35].
- Mis-recorded sample collection times that require correction via additional laboratory procedures [35].
Troubleshooting Guides
Problem: Inadequate Statistical Power in Rhythm Detection
Potential Cause: The use of a suboptimal sampling design for the level of period uncertainty in the experiment.
Solutions:
- For Known Periods: Verify that your sampling frequency is at least twice the highest frequency (Nyquist rate) of the rhythm you wish to detect [34]. Stick to an equispaced design to achieve optimal power [34].
- For Unknown Periods: Use computational tools to generate an optimized design. The PowerCHORD library (available for R and MATLAB) can construct designs that maximize power for rhythm discovery across a range of experimental settings, including discrete and continuous period uncertainty [34].
- For Suboptimal Existing Data: Apply a weighted trigonometric regression model during data analysis. Implement an optimization procedure to select a kernel density estimator's hyperparameter based on the D-optimality criterion to minimize generalized variance [35].
Problem: Logistically Infeasible Equispaced Sampling
Potential Cause: Real-world constraints in human studies prevent sample collection at perfectly spaced intervals.
Solutions:
- Adopt an Optimized Design: If a full equispaced design is impossible, use a pre-optimized non-equispaced design that spreads samples as evenly as possible across the time window of interest while avoiding logistical bottlenecks [34].
- Implement Weighted Analysis: Plan to use weighted regression analysis from the outset if you know your sampling will be irregular. This proactively accounts for the expected uneven distribution of time points [35].
Experimental Design & Data Comparison
Comparison of Sampling Design Strategies
The table below summarizes the core characteristics, advantages, and limitations of different sampling design approaches for biological rhythm studies.
| Design Strategy | Optimal Use Case | Key Advantage | Primary Limitation |
|---|---|---|---|
| Equispaced Design | Investigating rhythms with a known period [34] [35] | Provides statistically optimal power for a fixed sample size when the period is known [34] | Can introduce systematic biases and has low power for detecting rhythms with periods near the Nyquist rate when period is unknown [34] |
| Optimized Design (Discrete Uncertainty) | Investigating a finite, predetermined list of candidate periods [34] | Maximizes statistical power simultaneously across all specified candidate periods [34] | Requires prior knowledge to define the set of candidate periods |
| Optimized Design (Continuous Uncertainty) | Discovering novel rhythms across a continuous range of periods (e.g., hourly to circadian) [34] | Resolves blind spots near Nyquist rates and provides robust power across a wide frequency band [34] | Designs can be complex to generate and may require specialized software (e.g., PowerCHORD) [34] |
| Weighted Regression (Post-Hoc) | Analyzing data already collected from a suboptimal or irregular design [35] | Mitigates variability in inferences and can yield larger test statistics by re-weighting data points [35] | A remedial measure rather than a replacement for a good initial design |
Quantitative Power Analysis
The following table outlines key concepts for evaluating the statistical performance of different experimental designs in rhythm detection.
| Concept | Description | Implication for Experimental Design |
|---|---|---|
| Statistical Power | The probability that the experiment will correctly detect a true underlying rhythm [34] | The primary metric for comparing different sampling designs. Optimized designs aim to maximize worst-case power [34]. |
| Nyquist Rate | For a given sampling rate, it is twice the highest frequency that can be unambiguously detected [34] | In equispaced designs, rhythms with frequencies at or above this rate cannot be reliably identified [34]. |
| Worst-Case Power | The lowest statistical power across all signals of interest (e.g., all phases or a range of periods) [34] | Optimization often focuses on this metric to ensure power is above a known threshold for all relevant rhythms [34]. |
| D-Optimality Criterion | An experimental design criterion that aims to minimize the generalized variance of parameter estimates [35] | Maximizing this criterion is equivalent to maximizing the determinant of the information matrix, leading to more precise estimates [35]. |
Detailed Experimental Protocols
Protocol 1: Designing an Equispaced Sampling Experiment for a Known Circadian Rhythm
Objective: To establish a sampling protocol that provides optimal statistical power for detecting a hormone fluctuation with a known 24-hour period.
Materials:
- See "Research Reagent Solutions" table.
- Protocol scheduling software.
Procedure:
- Define Sampling Window: Determine the total duration of the experiment. For characterizing a single cycle, a 24-hour window is standard.
- Determine Sample Size (N): Based on power calculations and logistical constraints, decide the total number of samples to be collected.
- �Calculate Sampling Interval: Divide the period length (24 hours) by the total number of samples (N) to determine the fixed interval between samples. For example, for N=12, collect samples every 2 hours.
- Schedule Collections: Program automated samplers or create a collection schedule with time points at 0, 2, 4, ..., 22 hours from the experiment start.
- Maintain Consistency: Adhere strictly to the schedule to preserve the equispaced property of the design.
Protocol 2: Implementing an Optimized Sampling Design for Unknown Periods Using PowerCHORD
Objective: To generate a sampling time schedule that maximizes the power to detect biological rhythms when their period is not known precisely.
Materials:
- Computer with R or MATLAB installed.
- PowerCHORD library (available from https://github.com/t-silverthorne/PowerCHORD).
Procedure:
- Install PowerCHORD: Download and install the PowerCHORD library from the GitHub repository into your R or MATLAB environment.
- Define Period Uncertainty: Specify the range of periods you want to investigate. This can be a continuous range (e.g., 20 to 28 hours) or a discrete list of candidate periods.
- Set Sample Size: Input the total number of samples you can feasibly collect.
- Run Optimization: Execute the PowerCHORD algorithm to numerically solve for the set of sample times that maximizes worst-case statistical power for your specified conditions.
- Export Schedule: The output will be a list of optimized sample collection times. Use this list to guide your experimental timeline.
Protocol 3: Applying Weighted Trigonometric Regression to Suboptimal Data
Objective: To improve rhythmicity analysis and hypothesis testing from a dataset with irregularly spaced sampling times.
Materials:
- Dataset containing measurement values and their corresponding collection times.
- Statistical software capable of weighted regression and kernel density estimation.
Procedure:
- Model Specification: Assume a trigonometric regression model of order K (e.g., K=1 for cosinor regression) is appropriate for your data [35].
- Estimate Sampling Density: Apply a kernel density estimator to the recorded sample collection times to model the distribution of your sampling.
- Calculate Weights: For each data point, compute the weight as the normalized reciprocal of the density estimate from step 2. This inflates the influence of samples from underrepresented time points.
- Hyperparameter Tuning: Use an optimization procedure (e.g., maximizing the determinant of the Hessian of weighted squared loss) to select the concentration hyperparameter for the kernel density estimator [35].
- Perform Weighted Regression: Fit your trigonometric model using a weighted least squares algorithm, incorporating the weights derived in step 3.
- Proceed with Inference: Use the fitted weighted model for hypothesis tests (e.g., testing the significance of rhythmicity) and parameter estimation (e.g., acrophase and amplitude).
Signaling Pathways & Workflows
Decision Flowchart for Sampling and Analysis
The Scientist's Toolkit
Research Reagent Solutions
| Item/Tool | Function in Experiment |
|---|---|
| PowerCHORD Library | An open-source computational tool (for R/MATLAB) to construct optimal or near-optimal experimental designs for rhythm detection when period is unknown [34]. |
| Kernel Density Estimator | A statistical method used in weighted regression to model the probability distribution of sample collection times, which helps correct for uneven sampling [35]. |
| Cosinor Model | A harmonic regression model (often first-order) that is prevalent in circadian biology studies for modeling oscillatory data over time [35]. |
| Weighted Least Squares Algorithm | A regression estimation technique that accounts for varying variance or importance in data points; used to fit models to irregularly sampled data [35]. |
| Bright Light Therapy Lamp | Used in human studies to provide controlled light exposure, a primary Zeitgeber, for entraining circadian rhythms and manipulating the phase of the central clock [36]. |
Troubleshooting Guides
Common Issues and Solutions
| Issue Description | Possible Causes | Solution Steps | Prevention Tips |
|---|---|---|---|
| Sample Collection Timing Errors | Misalignment with individual circadian phase; irregular sleep-wake cycles of participants. | 1. Use a validated questionnaire (e.g., Munich ChronoType Questionnaire) to estimate participant chronotype [29].2. Calculate collection time based on dim light melatonin onset (DLMO) or other physiological markers where possible [15] [25].3. Cross-reference with actigraphy data from wearables to confirm activity/rest state. | Standardize protocols to account for chronotype; use consistent Zeitgebers like fixed light exposure and meal times [15] [25]. |
| Low Amplitude Rhythm Data | Weak circadian signals due to participant non-compliance (e.g., night-time light exposure, irregular meals); sample processing delays. | 1. Filter data using amplitude thresholding in the computational analysis.2. Visually inspect raw data plots for flattened curves.3. Correlate with participant self-reports to identify protocol violations. | Recruit participants with stable routines; provide clear instructions on maintaining regular sleep and fasting periods before sampling [25]. |
| Inconsistent Hormonal Assay Results | Improper sample handling affecting hormone stability (e.g., cortisol, melatonin); assay interference. | 1. Audit sample storage conditions (time, temperature) against protocol.2. Re-run assays with control samples to confirm reagent integrity.3. For melatonin, ensure samples collected in dim light to prevent suppression [15]. | Establish a strict chain-of-custody protocol; use standardized, validated assay kits; protect light-sensitive samples. |
| Failure in Model Convergence | Insufficient data points per cycle; high biological noise; incorrect initial parameter estimates. | 1. Increase sampling density, aiming for at least 6-8 time points over 24 hours for key phases [29].2. Pre-process data to smooth outliers.3. Consult tool documentation to adjust algorithm-specific tolerance settings. | Conduct a power analysis before the experiment to determine the optimal number of samples and participants. |
Advanced Technical Issues
| Issue Description | Investigation Method | Resolution Workflow |
|---|---|---|
| Misalignment between Central & Peripheral Clocks | Compare phase of central markers (e.g., DLMO from saliva) vs. peripheral markers (e.g., gene expression from blood) [15] [25]. | 1. Isolate data for each clock system.2. Plot phase relationships to identify the magnitude of misalignment.3. Statistically model the impact of mistiming (e.g., late meals) on the phase difference. |
| Confounding Effects of Medication | Unexplained shifts in hormonal rhythm peaks (e.g., cortisol, TSH). | 1. Review patient medication logs for timing of drugs known to affect circadian rhythms [17].2. Model drug administration time as a covariate in the analysis.3. Consult recent literature on chronotherapy for the specific medication [17]. |
Frequently Asked Questions (FAQs)
General Tool Usage
Q: What is the primary function of computational tools like PowerCHORD in circadian research? A: These tools are designed to analyze time-series biological data to characterize an individual's circadian rhythm phase, amplitude, and period. This allows researchers to optimize the timing of sample collection or treatment administration based on the body's internal clock, rather than external clock time, thereby improving data quality and therapeutic outcomes [29].
Q: My study involves shift workers with highly erratic schedules. Can these tools handle such data? A: Yes, but it requires careful protocol design. Computational models can be trained on data from populations with regular rhythms. For shift workers, it is critical to collect detailed logs of sleep, light exposure, and meal times as covariates. The model may require more data points and robust statistical methods to resolve the underlying rhythm from the noise of disruption [29] [25].
Experimental Design
Q: What is the minimum number of sampling time points required to reliably estimate a circadian phase? A: While more time points always yield a more robust model, for a preliminary estimate of a single rhythm (e.g., cortisol), a minimum of 6 to 8 time points spanning the 24-hour cycle is recommended. Key phases, such as the wake-up period and evening, should be densely sampled to capture critical transitions like the cortisol awakening response (CAR) and melatonin onset [29].
Q: How do I account for different chronotypes (early birds vs. night owls) in my sampling protocol? A: Do not sample all participants at the same clock time. Instead, align sampling times to each participant's individual physiology. For example, you can set time "zero" relative to their wake-up time or, more accurately, relative to their DLMO, if measured. This personalized timing is essential for synchronizing data across a cohort with varied chronotypes [17] [29].
Data Analysis and Interpretation
Q: What does "low circadian amplitude" indicate, and is it a problem for my analysis? A: Low amplitude indicates a dampened or blunted circadian rhythm, where the difference between peak and trough values of a measured variable (e.g., cortisol) is reduced. This is a significant problem as it can reflect circadian disruption, often caused by factors like shift work, social jet lag, or poor sleep hygiene. Data from low-amplitude rhythms can be difficult for models to interpret and may need to be flagged or treated with specialized algorithms [25].
Q: We collected blood for gene expression and saliva for melatonin. How do we integrate these multi-omics data streams? A: Computational tools are key for this integration. The workflow involves:
- Preprocessing: Normalizing each data type (e.g., transcripts per million for RNA, pg/mL for melatonin).
- Individual Analysis: Fitting a circadian model (e.g., cosinor) to each data stream to determine its phase and amplitude.
- Integration: The tool can then create a composite phase map, showing the relationship between the central clock (inferred from melatonin) and the peripheral clock (from tissue-specific gene expression in the blood) [29] [25].
Experimental Protocols
Protocol 1: Determining the Circadian Cortisol Rhythm
Objective: To accurately map the diurnal rhythm of cortisol secretion in a human participant for chronotherapy optimization [17].
Materials: See "Research Reagent Solutions" table below.
Methodology:
- Participant Preparation: Instruct participants to maintain a consistent sleep-wake schedule (e.g., 11:00 PM - 7:00 AM) for at least three days prior to sampling. Avoid heavy exercise, alcohol, and caffeine for 24 hours before and during the sampling day.
- Sample Collection:
- Collect the first saliva sample immediately upon waking (Time "0"). Do not get out of bed, brush teeth, or eat before this sample.
- Collect subsequent samples at 30 minutes, 60 minutes, and 90 minutes post-wake to capture the Cortisol Awakening Response (CAR).
- Continue sampling every 2-4 hours throughout the day, with the final sample taken just before bedtime.
- Record the exact clock time of each sample.
- Sample Handling: Centrifuge saliva samples at 3000 RPM for 15 minutes within 30 minutes of collection. Aliquot the supernatant into cryovials and store immediately at -80°C until assayed.
- Data Analysis:
- Input cortisol concentration and precise sample times into the computational tool.
- The tool will fit a curve to the data, identifying key parameters: the peak time (acrophase), the morning surge amplitude, and the nadir (low point).
Protocol 2: Optimizing Drug Timing Based on Peripheral Clock Gene Expression
Objective: To identify the optimal time for drug administration by aligning with the peak expression of a target gene in a specific tissue [17] [29].
Materials: See "Research Reagent Solutions" table below. Requires PAXgene Blood RNA Tubes for whole blood collection.
Methodology:
- Study Design: A crossover design is recommended where each participant is their own control.
- Phase Assessment:
- Determine the participant's circadian phase over 24-48 hours in a controlled laboratory setting or via intensive ambulatory monitoring.
- Collect blood samples every 4 hours for 24 hours (or every 2 hours for higher resolution).
- Isolate total RNA from blood and quantify expression of core clock genes (e.g., PER2, BMAL1) and target genes of interest using qPCR or RNA-Seq.
- Computational Modeling:
- Input gene expression data into the computational tool to model the phase of the peripheral clock in the blood.
- The tool will generate a phase map, predicting the time of peak expression for the target gene.
- Drug Administration:
- Administer the drug at the predicted peak time of the target gene and, in a separate session, at the predicted trough time.
- Measure pharmacokinetic (PK) and pharmacodynamic (PD) parameters after each administration.
- Outcome Analysis: Compare PK/PD results between the two administration times. The optimal time is when efficacy is highest and/or adverse effects are lowest, which should correlate with the predicted peak time of the target pathway.
Research Reagent Solutions
| Item | Function / Application in Circadian Research |
|---|---|
| Salivary Cortisol ELISA Kit | Quantifies free, biologically active cortisol levels from saliva samples non-invasively. Essential for mapping the diurnal cortisol rhythm and the Cortisol Awakening Response (CAR) [15] [17]. |
| Salivary Melatonin RIA/ELISA Kit | Measures melatonin concentration to determine Dim Light Melatonin Onset (DLMO), the gold standard marker for the phase of the central circadian clock in the SCN [15]. |
| PAXgene Blood RNA Tubes | Stabilizes intracellular RNA in whole blood immediately upon drawing, preserving the in-vivo gene expression profile at the exact moment of collection for subsequent transcriptomic analysis of clock genes [29]. |
| qPCR Reagents for Clock Genes | Quantifies the expression levels of core circadian clock genes (e.g., PER1/2, BMAL1, CRY1) from extracted RNA. Used to assess the phase and amplitude of peripheral clocks [29] [25]. |
| Actigraphy Watch | Worn on the wrist to continuously monitor activity and rest cycles, providing objective data on sleep-wake patterns and serving as a behavioral correlate of the circadian rhythm. |
Workflow Diagrams
Circadian Sampling Workflow
Molecular Clock Pathway
Troubleshooting Guides
Common Algorithm Implementation Issues
Problem: High phase estimation error in sparse single-cell RNA-seq data Solution: Sparse data from droplet-based scRNA-seq platforms (e.g., 10X Genomics Chromium) presents challenges because circadian clock genes are only moderately expressed. Tempo specifically addresses this by using a Negative Binomial distribution for transcript counts, which better approximates the true generative distribution of sparse droplet-based data compared to other likelihood distributions. Implement posterior distribution checks to ensure uncertainty quantification is well-calibrated for your data sparsity level [37] [38].
Problem: Poor identification of clock-controlled genes (CCGs) Solution: The core circadian clock comprises only ~20 moderately expressed genes, making de novo cycler identification crucial. Tempo's two-step iterative process first optimizes cell phase estimates using current cycling genes (initially just core clock genes), then uses these posterior distributions to identify additional cycling genes that exhibit phase variation. If CCG identification is poor, adjust the Bayesian evidence threshold for adding de novo cyclers to the set [37] [38].
Problem: Inaccurate phase estimates with imperfect prior knowledge Solution: When prior knowledge of core clock gene acrophases is imperfect (e.g., shifted by 2-4 hours), Tempo can still yield accurate results. However, you should set appropriate prior scales using the Von Mises distribution with 95% interval widths of approximately 4 hours around prior acrophase locations. This provides sufficient flexibility for the algorithm to adjust phases based on the observed data [37].
Problem: Algorithm fails to converge with large cell numbers Solution: Tempo uses variational inference rather than sampling techniques for computational efficiency. For datasets with 500-5000 cells and library sizes of 3000-20,000 median UMIs, ensure you're using the appropriate optimization parameters. The method scales well to droplet-based scRNA-seq data, unlike earlier approaches designed for plate-based technologies [38].
Table 1: Comparison of Phase Inference Methods for Circadian Biology
| Method | Key Approach | Optimal Data Type | Uncertainty Quantification | Computational Efficiency |
|---|---|---|---|---|
| Tempo | Bayesian variational inference | Droplet & plate-based scRNA-seq | Yes - well-calibrated posterior distributions | High - suitable for large datasets (>5000 cells) [37] [38] |
| Cyclops | Autoencoder neural network | Principal components of gene expression | No | Moderate [38] |
| Cyclum | Autoencoder neural network | Transformed counts of individual genes | No | Moderate [38] |
| PCA | Linear projection | General dimensionality reduction | No | High [38] |
| DLMO | Melatonin measurement in dim light | Clinical/human studies | Limited to assay variability | N/A - experimental gold standard [39] [40] |
| Hair follicle clock gene analysis | RT-PCR of clock genes | Human peripheral tissue sampling | Limited to technical replicates | High - minimal processing [40] |
Experimental Design Troubleshooting
Problem: Insufficient statistical power for phase inference Solution: Based on simulation studies, ensure your experimental design includes adequate cell numbers (500-5000 cells) and sequencing depth (3000-20,000 median UMIs). For unsynchronized cell populations, Tempo performs well across this range, but performance degrades with extremely sparse data. If working with time course designs (e.g., ZT0, ZT6, ZT12, ZT18), validate that sampling times appropriately capture circadian phases [37].
Problem: Integration with hormone timing studies Solution: When correlating transcriptional phases with hormone fluctuations, ensure temporal alignment of sampling protocols. For example, parathyroid hormone (PTH) shows distinct circadian profiles with peaks between 04:00-06:00, while cortisol aligns with dawn. Time-stamp all samples and consider using Tempo's phase estimates as covariates in hormone rhythm analysis [15] [13].
Frequently Asked Questions (FAQs)
Q: How does Tempo compare to traditional circadian phase assessment methods like DLMO? A: Tempo serves a fundamentally different purpose than DLMO (dim light melatonin onset). While DLMO is the clinical gold standard for assessing human circadian phase in vivo, Tempo is designed specifically for inferring circadian phases from single-cell transcriptomics data. Tempo enables researchers to study cell-to-cell heterogeneity in circadian timing within tissues, which is not possible with bulk measures like DLMO. The methods are complementary rather than directly comparable [39] [40].
Q: What prior knowledge does Tempo require about core clock genes? A: Tempo requires an initial list of core clock genes (approximately 20 genes) to initialize the algorithm. The method is robust to imperfect prior knowledge - simulation studies show it can handle acrophase prior locations shifted by 2 hours from true values while still producing accurate phase estimates. Prior knowledge is incorporated using Von Mises distributions with modifiable concentration parameters [37].
Q: Can Tempo be applied to data from peripheral tissues used in hormone research? A: Yes, since virtually all nucleated cells contain cell-autonomous circadian clocks, Tempo can theoretically be applied to scRNA-seq data from any tissue. This includes peripheral tissues relevant to hormone research such as kidneys (which show circadian regulation of electrolyte excretion) and various endocrine tissues. However, researchers should validate the method for their specific tissue type, as clock gene expression patterns can vary [41] [40].
Q: How does Tempo handle the difference between core clock genes and clock-controlled genes (CCGs)? A: Tempo explicitly distinguishes between core clock genes and CCGs in its algorithm. Initially, only core clock genes are used for phase inference. Through iterative optimization, Tempo identifies de novo cycling genes (CCGs) that exhibit rhythmic expression and incorporates them into the model. This is particularly important because CCGs (numbering 100-1000) oscillate in a cell-type-specific manner and their identities are often unknown beforehand [37] [38].
Q: What are the key advantages of Tempo over existing phase inference methods like Cyclops and Cyclum? A: Tempo provides three key advantages: (1) It uses a Negative Binomial count model that better approximates sparse scRNA-seq data; (2) It quantifies estimation uncertainty through posterior distributions, crucial for interpreting results from sparse data; and (3) It explicitly identifies de novo cycling genes. Comparative studies show Tempo yields more accurate phase estimates than Cyclops or Cyclum, especially when using only core clock genes as input [38].
Experimental Protocols
Protocol: Validating Tempo Phase Estimates with Simulated Data
Purpose: To validate Tempo performance before applying to experimental data [37] [38].
Procedure:
- Generate simulated scRNA-seq data using Tempo's Negative Binomial count model
- Set sinusoidal gene parameters (mesor, amplitude, acrophase) based on real light-dark cycle time course data
- Simulate both unsynchronized cell populations and time course designs (ZT0, ZT6, ZT12, ZT18)
- Run Tempo with:
- Non-informative priors over cell phases
- Core clock acrophase prior locations shifted from true values (simulating imperfect knowledge)
- Von Mises prior distributions with 4-hour 95% interval widths
- Calculate point estimate errors as empirical cumulative distribution functions (eCDFs)
- Compare against maximum likelihood phases computed using true generative model
Validation Metrics:
- Phase estimate error distribution across cell populations
- Calibration of uncertainty quantification
- Comparison to optimal performance benchmark
Protocol: Integrating Tempo with Hormone Fluctuation Studies
Purpose: To correlate single-cell circadian phases with hormonal rhythms [41] [15] [13].
Procedure:
- Design sampling schedule aligned with expected hormone peaks:
- For cortisol-related studies: focus on dawn periods
- For melatonin-related studies: include evening/dark periods
- For PTH studies: include pre-dawn hours (04:00-06:00)
- Collect matched samples for:
- scRNA-seq processing
- Hormone level quantification (e.g., ELISA, mass spectrometry)
- Process scRNA-seq data through Tempo pipeline
- Extract posterior phase distributions for each cell
- Correlate cellular phase distributions with hormone concentration measurements
- Perform statistical testing for phase-dependent hormone effects
Workflow for Hormone-Phase Integration
The Scientist's Toolkit: Research Reagent Solutions
Table 2: Essential Materials for Circadian Phase Inference Experiments
| Reagent/Resource | Function/Purpose | Implementation Notes |
|---|---|---|
| Tempo Algorithm | Bayesian variational inference for circadian phase estimation | Available as computational tool; requires list of core clock genes for initialization [37] [38] |
| Core Clock Gene Panel | ~20 genes constituting circadian transcriptional-translational feedback loop | Includes CLOCK, BMAL1, PER1/2, CRY1/2; essential for initializing Tempo [37] [41] |
| scRNA-seq Platform | Single-cell transcriptome profiling | Droplet-based (10X Genomics) or plate-based (Fluidigm C1); Tempo optimized for both [38] |
| Negative Binomial Model | Models transcript counts in sparse scRNA-seq data | Built into Tempo; better approximates true generative distribution than alternatives [37] |
| Von Mises Distribution | Circular probability distribution for phase parameters | Used in Tempo for modeling acrophase priors; allows incorporation of domain knowledge [37] |
| Peripheral Tissue Samples | Source for circadian phase estimation in relevant tissues | Hair follicle cells, blood samples, or tissue biopsies; enables phase assessment without DLMO [40] |
| Zeitgeber Controls | Environmental timing cues for synchronization | Light-dark cycles, feeding schedules; crucial for experimental design in model systems [15] |
Circadian System & Measurement Techniques
Advanced Applications in Hormone Timing Optimization
Chronotherapeutic Integration
Tempo's phase inference capabilities enable precise timing of interventions based on cellular circadian rhythms rather than external time alone. This is particularly valuable for optimizing hormone-based therapies where timing significantly impacts efficacy [13].
Case Example: Teriparatide Timing Optimization A recent randomized controlled trial illustrates how circadian principles can optimize hormone therapy timing. The study compares morning (08:00) versus evening (20:00) administration of teriparatide (PTH 1-34) for postmenopausal osteoporosis, based on the natural circadian rhythm of endogenous PTH, which peaks between 04:00-06:00. Such chronotherapeutic approaches could be enhanced by incorporating tissue-specific phase information from Tempo analysis [13].
Implementation Framework:
- Use Tempo to establish baseline phase relationships between transcriptional rhythms and hormone fluctuations
- Design timed intervention protocols aligned with endogenous peaks/troughs
- Validate phase-dependent efficacy through longitudinal sampling
- Adjust timing based on individual phase variations detected at cellular level
Table 3: Circadian Characteristics of Key Hormones Relevant to Phase Inference
| Hormone | Circadian Pattern | Peak Time | Relevance to Tempo Applications |
|---|---|---|---|
| Melatonin | Nocturnal secretion suppressed by light | 02:00-04:00 | Gold standard for human phase assessment (DLMO); coordinates peripheral clocks [39] [42] |
| Cortisol | Dawn-associated rise, daytime decline | Early morning (~06:00) | Entrains peripheral clocks; correlates with osteocalcin rhythms [15] [13] |
| Parathyroid Hormone (PTH) | Distinct circadian rhythm with nocturnal rise | 04:00-06:00 | Critical for bone metabolism; teriparatide efficacy depends on timing [13] |
| Core Clock Components | 24h transcriptional-translational feedback | Varies by tissue | Direct targets for Tempo phase inference from scRNA-seq data [37] [41] |
FAQs: Addressing Common Experimental Challenges
1. How does the time of day affect the measurement of Thyroid-Stimulating Hormone (TSH) in research samples?
TSH exhibits a significant circadian rhythm, which makes sampling time a critical experimental variable. Peak TSH concentrations typically occur between midnight and 8 am, with a nadir between 10 am and 3 pm [43] [44]. One study found that TSH values drawn at 10 am were significantly lower than those drawn at 8 am, regardless of the fasting state of the subject [44]. The mean difference can be around 0.5–0.6 mIU/L, with a maximum observed difference of 2.78 mIU/L in one study [44]. This variation is sufficient to impact the diagnosis or research classification of conditions like subclinical hypothyroidism. For consistency, it is essential to standardize and report the time of sample collection for TSH measurements.
2. What is the evidence for using glucocorticoid therapy in severe hypothyroidism with systemic complications?
Case studies report that glucocorticoid therapy can be a critical intervention in complex cases of hypothyroidism. In one case, a patient with hypothyroidism presented with type II respiratory failure, heart failure, and massive pericardial effusion. The patient failed multiple attempts to wean from invasive ventilation after standard treatment with levothyroxine [45]. However, after initiating high-dose intravenous methylprednisolone (80 mg daily) in combination with levothyroxine, the patient was successfully weaned from ventilation on the fifth day of this combination therapy and eventually made a full recovery [45]. This suggests that glucocorticoids may help manage severe systemic inflammation or autoimmune components in such critical presentations.
3. Can glucocorticoids directly affect thyroid antibody levels in autoimmune thyroid disease?
Yes, evidence suggests glucocorticoids can modulate thyroid antibody levels, though the effect may be temporary. In a study on children with Graves' disease, intravenous methylprednisolone pulse therapy followed by oral prednisolone was associated with a significant but transient reduction in Thyrotropin Receptor Antibody (TRAb) levels [46]. The TRAb level was significantly lower in the glucocorticoid-treated group compared to the control group on day 30 of treatment, but this difference was not sustained by day 60 [46]. This indicates that while glucocorticoid therapy can rapidly suppress the autoimmune response in Graves' disease, it may not be beneficial for the sustained recovery of thyroid function without additional interventions.
Troubleshooting Guides
Issue: Inconsistent Hormone Measurements in a Longitudinal Study
Potential Cause: Unstandardized sampling times for blood collection, leading to interference from circadian hormone fluctuations.
Solution:
- Implement Fixed Sampling Times: Collect samples within a narrow, consistent time window for all subjects across all study visits. Morning sampling is often recommended for TSH to track its peak levels [44].
- Document Timing Meticulously: Record the exact phlebotomy time relative to the subject's wake-up time and medication schedule.
- Control for Food Intake: If possible, collect samples in a fasting state, as food intake can further suppress TSH levels [44].
Issue: Evaluating the Efficacy of Glucocorticoid Therapy in Autoendocrine Conditions
Potential Cause: Failure to measure the correct biomarkers at optimal time points to capture the pharmacodynamic effects of the glucocorticoid.
Solution:
- Align Biomarker Sampling with Drug PK/PD: The optimal time to measure biomarker suppression is dependent on the glucocorticoid's pharmacokinetics. For example, after a prednisone dose, trough concentrations of adrenal androgens are observed 4-5 hours post-dose [47].
- Target Peak Hormone Levels: To assess "escape" from hormonal control, measure biomarkers at their peak concentration. For patients on morning prednisone, this corresponds to approximately 10 hours post-dose (late afternoon) [47].
- Use a Panel of Biomarkers: Do not rely on a single hormone. For conditions like CAH, measure both 17-OHP and androstenedione (A4) to get a comprehensive view of adrenal suppression [47].
Summarized Data from Key Studies
Table 1: Impact of Sampling Time and Food on TSH Levels
| Condition | Mean TSH (mIU/L) | Comparison | Significance (p-value) |
|---|---|---|---|
| Fasting (8 am) | 2.93 ± 1.62 | Baseline | - |
| Extended Fasting (10 am) | 2.26 ± 1.19 | vs. Fasting (8 am) | < 0.001 |
| 2-hours Postprandial (10 am) | 1.89 ± 1.01 | vs. Fasting (8 am) | < 0.001 |
Data adapted from [44].
Table 2: Glucocorticoid Pulse Therapy in Pediatric Graves' Disease
| Parameter | Pulse Group (GC + ATDs) | Control Group (ATDs alone) | Significance at Day 30 |
|---|---|---|---|
| TRAb Level | Significant reduction from baseline | Higher than pulse group | p = 0.023 |
| Sustained TRAb Suppression (Day 60) | No (Levels rose again) | N/A | Not Significant |
| Thyroid Function Recovery | Not beneficial for sustained recovery | - | - |
ATDs: Antithyroid Drugs; GC: Glucocorticoid. Data adapted from [46].
Experimental Protocols
Protocol 1: Standardizing TSH Sampling in Human Studies
Objective: To obtain consistent TSH measurements by controlling for circadian and postprandial variation.
Methodology:
- Subject Preparation: Instruct participants to fast overnight (8-12 hours) and avoid strenuous activity before the blood draw.
- Fixed Timing: Schedule all blood collections for the early morning, for example, between 7:00 am and 9:00 am.
- Sample Collection: Draw blood serum samples and process according to standard laboratory procedures.
- Assay Consistency: Use the same assay technique (e.g., CLIA, CMIA) for all samples in the study to avoid inter-assay variability [44].
- Data Annotation: Record the exact time of sample collection and the subject's fasting duration.
Protocol 2: Assessing Glucocorticoid Impact on Thyroid Antibodies
Objective: To evaluate the transient effect of intravenous glucocorticoid pulse therapy on TRAb levels.
Methodology:
- Study Groups: Include an intervention group receiving intravenous methylprednisolone pulse therapy followed by oral prednisolone alongside antithyroid drugs, and a control group receiving antithyroid drugs alone [46].
- Blood Sampling: Collect serum samples at baseline and at fixed intervals post-treatment initiation (e.g., day 10, day 30, day 60).
- Biomarker Analysis: Measure serum concentrations of TRAb, along with FT3, FT4, TSH, TPOAb, and TGAb, using standardized immunoassays.
- Data Analysis: Compare the trajectory of TRAb levels between the two groups over time using longitudinal statistical models.
Signaling Pathways and Experimental Workflows
Title: Glucocorticoid Immune Modulation in Thyroid Autoimmunity
Title: Workflow for Standardized vs. Variable Hormone Sampling
The Scientist's Toolkit: Essential Research Reagents & Materials
Table 3: Key Reagents for Hormone and Autoantibody Research
| Item | Function/Application | Example Use Case |
|---|---|---|
| Chemiluminescent Immunoassay (CLIA) Kits | Quantitative measurement of TSH, FT4, FT3 in serum. Offers high sensitivity and wide dynamic range. | Standardized measurement of thyroid function in longitudinal studies [44]. |
| TRAB & TPOAB Immunoassays | Detects and quantifies autoantibodies against thyroid targets. | Evaluating autoimmune activity in Graves' disease or Hashimoto's thyroiditis in response to therapy [46]. |
| 17-Hydroxyprogesterone (17-OHP) Assay | Key biomarker for monitoring glucocorticoid therapy efficacy in congenital adrenal hyperplasia. | Used to titrate glucocorticoid dose to avoid over- or under-treatment [47]. |
| Androstenedione (A4) Assay | Adrenal androgen precursor used alongside 17-OHP to assess adrenal steroid control. | Provides a more comprehensive picture of adrenal suppression than 17-OHP alone [47]. |
| Recombinant Human TSH | Used in stimulation tests to assess thyroid reserve and function in research models. | Not directly cited, but foundational for advanced thyroid physiology studies. |
Navigating Challenges: Troubleshooting and Optimizing Sampling Protocols
Troubleshooting Guide: Frequently Asked Questions
FAQ 1: How does chronotype fundamentally impact circadian hormone sampling protocols?
Chronotype represents an individual's inherent preference for sleep and activity timing, reflecting underlying differences in their endogenous circadian rhythm phase [48] [49]. Morning chronotypes typically experience earlier peaks in core body temperature and melatonin secretion compared to evening types, whose rhythms are phase-delayed by 2-3 hours [48]. This biological variation directly impacts optimal sampling times for circadian hormones.
- Root Cause: Individual variability in the phase of entrainment, driven by genetic polymorphisms in clock genes, neuroendocrine regulation, and environmental factors [48] [49] [3].
- Solution: Implement chronotype assessment for all research participants using standardized questionnaires like the Morningness-Eveningness Questionnaire (MEQ) or Munich Chronotype Questionnaire (MCTQ) before designing sampling schedules [48] [49]. For precise phase mapping, combine these with objective measures like dim light melatonin onset (DLMO) [49].
FAQ 2: What are the critical age-related considerations when sampling hormonal rhythms?
The circadian system undergoes significant changes throughout the lifespan, profoundly affecting hormonal profiles [49] [50]. Key age-related shifts must be accounted for in experimental design to avoid confounding results.
- Root Cause: Age-related alterations in the suprachiasmatic nucleus (SCN) function, reduced rhythm amplitude, and changing sleep-wake homeostasis [50].
- Solution:
- Adolescents: Expect a pronounced phase delay in circadian timing. Sampling protocols should be adapted to later hours [49].
- Older Adults: Account for advanced phase (earlier timing), reduced amplitude of hormonal rhythms (e.g., melatonin, cortisol), and increased rhythm fragmentation [50]. Focus sampling windows on earlier times of day and anticipate blunted peak amplitudes.
FAQ 3: How do common comorbidities confound circadian hormone measurements?
Psychiatric, metabolic, and sleep disorders are frequently linked with circadian disruption, which can manifest as either a cause or consequence of the disease [48] [51]. Failing to screen for these can introduce significant variability.
- Root Cause: Comorbidities like Major Depressive Disorder, Bipolar Disorder, and obesity can alter the fundamental regulation of the SCN and peripheral clocks, leading to phase shifts or amplitude dampening of hormonal rhythms [48] [51].
- Solution:
- Screening: Utilize standardized clinical screening tools to identify and document comorbidities.
- Stratification: Statistically stratify participants based on comorbid conditions during analysis.
- Control: Tightly match case and control groups for specific comorbidities known to affect the hormone of interest.
FAQ 4: Which methodological errors most commonly lead to unreliable circadian data?
Inconsistency in sampling conditions and improper participant instruction are frequent sources of technical noise that can obscure true biological signals.
- Root Cause: Lack of control over environmental zeitgebers (time cues) like light exposure, food intake, and activity levels during the sampling period [48] [3].
- Solution: Implement a strict constant routine protocol or at a minimum, standardize and document the following for all participants:
- Light Exposure: Control intensity and spectral composition, especially before and during evening/blood draws.
- Posture and Activity: Standardize physical activity before sample collection.
- Nutritional State: Define and control fasting vs. fed state, and meal composition.
- Sample Collection Time: Record exact clock time for every sample.
Hormonal Fluctuations: Reference Data and Methodologies
Table 1: Core Circadian Hormones and Sampling Considerations
| Hormone | Peak Circadian Phase (Approx.) | Key Influencing Factors | Recommended Sampling Frequency for Rhythm Analysis |
|---|---|---|---|
| Melatonin | Biological night (peaks ~2-4 AM) [51] | Light exposure (suppressive), chronotype, age [48] [50] | Every 1-2 hours in dim light (<10 lux) for 24h; critical for DLMO calculation [49] |
| Cortisol | Biological morning (peaks ~6-8 AM) [51] | Stress, awakening response (CAR), sleep quality, comorbidities (e.g., depression) [51] [50] | Dense sampling every 15-30 min around wake-up, then every 1-2 hours [50] |
| Growth Hormone | Early sleep period, linked to slow-wave sleep [51] | Sleep stage, age, fitness level [51] [50] | During sleep, every 20-30 min via indwelling catheter; or nightly peaks |
| Thyroid-Stimulating Hormone (TSH) | Middle of biological night (peaks ~2-4 AM) [51] | Sleep-wake homeostasis, light-dark cycle [51] | Every 2 hours for 24h, noting sleep periods |
| Leptin & Ghrelin | Leptin: Biological night; Ghrelin: Pre-meal rises [51] | Meal timing, sleep duration, obesity [51] | Every 2-4 hours, strictly standardized to meal times |
Table 2: Impact of Chronotype and Age on Hormonal Timing
| Variable | Effect on Hormonal Phase | Magnitude of Shift (Approx.) | Experimental Adjustment Needed |
|---|---|---|---|
| Evening Chronotype | Phase delay across multiple hormones (melatonin, cortisol) [48] | 2-3 hours later than morning types [48] | Schedule all sampling 2-3 hours later relative to morning types. |
| Morning Chronotype | Phase advance across multiple hormones [48] | 2-3 hours earlier than evening types [48] | Schedule all sampling 2-3 hours earlier relative to evening types. |
| Aging (>60 years) | Phase advance (earlier timing) [49] [50] | 1-2 hours earlier than young adults [50] | Schedule sampling earlier in the day; expect reduced peak amplitude. |
| Adolescence | Phase delay (later timing) [49] | 2-4 hours later than adults or children [49] | Schedule sampling later in the day and evening. |
The Scientist's Toolkit: Research Reagent Solutions
| Tool Category | Specific Tool / Assay | Function in Circadian Research |
|---|---|---|
| Chronotype Assessment | Morningness-Eveningness Questionnaire (MEQ) [48] | Subjective measure of diurnal preference for activity and sleep. |
| Munich Chronotype Questionnaire (MCTQ) [48] [49] | Estimates chronotype based on actual sleep behavior on work and free days. | |
| Phase Marker Assays | Dim Light Melatonin Onset (DLMO) Kit [49] | Gold standard for objective assessment of circadian phase in humans. |
| Cortisol ELISA/Salivary Immunoassay | Assesses rhythm of the HPA axis; used to measure cortisol awakening response (CAR) and diurnal slope. | |
| Activity Monitoring | Actigraphy Watch [48] [49] | Objectively measures rest-activity cycles, used to estimate sleep parameters and rhythm stability. |
| Data Analysis Software | Cosinor Analysis (e.g., Acro, Circadian.org) [52] | Fits cosine curves to time-series data to estimate rhythm parameters: MESOR, amplitude, and acrophase. |
| Non-linear Circadian Analysis (e.g., CircaCompare) [53] | Statistically compares rhythm parameters (phase, amplitude) between two or more experimental conditions. |
Experimental Protocol: Standardized Chronotype Assessment and Phase Mapping
Objective: To accurately determine an individual's circadian chronotype and calculate the phase of their central circadian clock for optimizing hormone sampling schedules.
Methodology:
Pre-Screening and Consent:
- Recruit participants and obtain informed consent.
- Exclude for factors causing acute circadian disruption (e.g., transmeridian travel in past 2 weeks, shift work, substance abuse).
Chronotype Profiling (At-Home):
- Administer the Morningness-Eveningness Questionnaire (MEQ) or the Munich Chronotype Questionnaire (MCTQ) [48] [49].
- Participants wear an actigraphy watch for a minimum of 7 days (including work and free days) to monitor rest-activity cycles [49].
- Participants maintain a sleep diary to corroborate actigraphy data.
Laboratory-Based Phase Assessment (Dim Light Melatonin Onset - DLMO):
- Schedule: Participants arrive at the lab 5 hours before their habitual sleep time.
- Protocol:
- Maintain in dim light (<10-15 lux) [49].
- Place an indwelling intravenous catheter for repeated sampling.
- Collect blood or saliva samples every 30-60 minutes for 5-6 hours.
- Ensure participants remain in a semi-recumbent position and are offered low-calorie snacks to maintain a post-absorptive state.
- Analysis: Assay samples for melatonin concentration. DLMO is calculated as the time when melatonin levels continuously exceed a threshold (e.g., 3 pg/mL in saliva or 10 pg/mL in plasma) [49].
Data Integration:
- Correlate DLMO phase with MEQ/MCTQ scores and actigraphy-derived mid-sleep times.
- Use this integrated phase map to create a personalized hormone sampling schedule for each participant.
Circadian Hormone Sampling Workflow
Molecular Pathways: Circadian Clock Regulation of Hormones
Circadian-Hormone Regulatory Pathway
Foundational Concepts FAQ
Q1: How do long-acting injectables (LAIs) directly address the challenge of patient compliance? Long-acting injectables (LAIs) are specifically engineered to enhance patient compliance by fundamentally altering the dosing regimen. They are designed to release a drug over an extended period—from weeks to months—following a single administration. This directly addresses both intentional and unintentional nonadherence to therapy, which is a common problem with conventional daily oral medications. Evidence shows that improved adherence, patient compliance, and reduced relapse have been observed with long-acting formulations, which has increased their demand in clinical practice [54] [55]. By reducing dosing frequency, LAIs help ensure consistent drug exposure, which is crucial for therapeutic success, especially in chronic conditions.
Q2: What is the scientific rationale for aligning drug administration with circadian rhythms? The scientific rationale for circadian-aligned drug administration, or chronotherapy, stems from the fact that most physiological processes, including hormone secretion, are governed by endogenous 24-hour cycles known as circadian rhythms. The central "master clock" located in the suprachiasmatic nucleus (SCN) of the hypothalamus synchronizes these rhythms throughout the body [17] [41].
- Key Mechanism: The endocrine and nervous systems are closely tied. The SCN regulates the rhythmic activity of endocrine functions, driving circadian fluctuations in hormone levels such as cortisol, melatonin, and parathyroid hormone (PTH) [17] [13].
- Impact on Pharmacokinetics and Pharmacodynamics: These hormonal fluctuations influence drug pharmacokinetics (absorption, distribution, metabolism, excretion) and pharmacodynamics (drug activity and duration). Administering a drug when its target pathway is most active can significantly enhance efficacy and reduce adverse effects [17]. For example, a bedtime dose of modified-release hydrocortisone can suppress the early-morning adrenocorticotropic hormone surge, which is a therapeutic goal in congenital adrenal hyperplasia [17].
Technical Troubleshooting Guide
Issue: Inconsistent In Vitro-In Vivo Correlation (IVIVC) for PLGA Microspheres
Problem: Data from laboratory dissolution tests does not reliably predict the drug release profile observed in animal or human studies, hindering formulation development.
Solution:
- Investigate Manufacturing Sensitivity: Be aware that PLGA microspheres with similar compositions can be highly sensitive to differences in manufacturing processes (e.g., emulsion method, solvent evaporation rate). These variations can significantly impact the critical physicochemical properties of the final product and its release kinetics [56] [57].
- Implement Discriminatory In Vitro Release Testing: Utilize advanced dissolution methods, such as USP Apparatus 4 (flow-through cell), which has demonstrated excellent discriminatory ability in detecting manufacturing differences and predicting in vivo performance for formulations like risperidone microspheres [56] [57].
- Apply Mechanistic Release Models: Develop a hypothesis-driven understanding of the release mechanism. For leuprolide acetate-loaded PLGA microspheres, the release process can be broken down into phases: initial hydration and surface release, continuous polymer degradation and diffusion, and final bulk erosion. Using tools like a cage implant system in animal models allows for the retrieval of microspheres post-administration to analyze polymer degradation and drug release behavior directly, facilitating more accurate IVIVC development [56].
Issue: High Variability in Circadian Response Metrics
Problem: Measurable endpoints, such as bone turnover markers (BTMs) or hormone levels, show high inter-individual variability when sampling for circadian studies, complicating data interpretation.
Solution:
- Standardize and Control Participant Routines: A major source of variability is inconsistent sleep-wake cycles and feeding times among study participants. Provide detailed training to participants on maintaining stable daily routines before and during the study period [13].
- Implement Rigorous Adherence Monitoring: For outpatient studies, use a multi-faceted approach to verify compliance with intervention timing. This can include:
- Diary Cards: Have participants record the exact time of each intervention (e.g., injection).
- Video Verification: Require participants to record videos of the administration process, including a clock timestamp, to confirm protocol adherence [13].
- Fix Sampling Times: Conduct blood draws for biomarker analysis at strictly standardized times (e.g., 08:00 ± 30 minutes) to minimize confounding from diurnal variation [13].
Experimental Protocols for Circadian Optimization
Protocol: Systematic Evaluation of Dosing Time on Bone Turnover Markers
This protocol is adapted from a randomized controlled trial investigating teriparatide dosing timing [13].
1. Objective: To compare the effects of morning (08:00) versus evening (20:00) subcutaneous administration of a therapeutic agent on circadian-sensitive biomarkers.
2. Materials:
- Drug: Teriparatide (20 µg/day) or other circadian-sensitive hormone therapy.
- Participants: Postmenopausal women with osteoporosis (or a relevant patient population).
- Key Reagents:
- ELISA kits for serum biomarkers: Parathyroid Hormone (PTH), C-terminal telopeptide of type I collagen (CTX), N-terminal propeptide of type I procollagen (P1NP).
3. Methodology:
- Study Design: Randomized, open-label, exploratory trial with two parallel groups (Morning Dosing vs. Evening Dosing).
- Intervention:
- Participants are randomized 1:1 to receive the drug at either 08:00 or 20:00 for 12 weeks.
- All participants receive standardized calcium and vitamin D supplementation.
- Data Collection:
- Blood Sampling: Collect serum samples at baseline, 4 weeks, and 12 weeks.
- Timing: Perform blood draws at a fixed time (e.g., 08:00) before the scheduled dose to measure trough levels of biomarkers.
- Adherence Monitoring: Participants use diary cards and daily video recordings of the injection process to verify timing compliance.
- Primary Outcomes: Between-group differences in the profiles of PTH, CTX, and P1NP.
The workflow for this experiment is outlined below:
Experimental Workflow: Dosing Time
Data Presentation: Long-Acting Formulation Technologies
The following table summarizes the primary technologies used to develop long-acting injectables, particularly for challenging hydrophilic drugs and peptides, along with their key characteristics and challenges [54] [55].
Table 1: Key Technologies for Developing Long-Acting Injectable Formulations
| Technology Platform | Mechanism of Sustained Release | Typical Duration | Key Challenges |
|---|---|---|---|
| Polymeric Microspheres (e.g., PLGA) | Controlled drug release through polymer degradation and diffusion. | Weeks to months | Complex manufacturing and scale-up; potential for peptide-polymer interactions; burst release effect [54] [55] [56]. |
| Oil-Based Suspensions (Prodrug Approach) | Lipophilic prodrug (e.g., ester) partitions into and slowly releases from an oil depot. | Weeks | Limited to potent drugs due to low drug loading; stability issues with some vegetable oils; viscosity can affect injectability [55]. |
| In-Situ Forming Implants/Depots | Polymer solution precipitates or gels upon contact with body fluids, forming a solid depot. | Weeks to months | Risk of dose dumping; injection site reactions; controlling the initial burst release [54] [55]. |
| Implants (Non-biodegradable) | Drug reservoir provides controlled release via a membrane or matrix system. | Months to years | Requires surgical insertion and removal; risk of tissue reaction or infection at the implant site [58]. |
Signaling Pathways in Chronotherapy
The efficacy of timing a drug administration is rooted in the molecular interplay between the circadian clock system and endocrine pathways. The diagram below illustrates the core circadian pathway and its interaction with an exogenous hormone therapy, such as teriparatide.
Circadian-Drug Pathway Interaction
The Scientist's Toolkit: Essential Reagents & Materials
Table 2: Key Research Reagent Solutions for Circadian Hormone Studies
| Item | Specific Function in Research |
|---|---|
| PLGA Polymers | Biodegradable polymer matrix used to fabricate microspheres and in-situ forming depots for sustained drug release. Key properties (lactide:glycolide ratio, end cap, molecular weight) dictate release kinetics [55] [56]. |
| Circadian Hormone ELISA Kits | Validated immunoassays for quantitatively tracking diurnal fluctuations in key hormones (e.g., cortisol, melatonin) and related biomarkers (e.g., PTH, CTX) in serum/plasma [13]. |
| USP Apparatus 4 (Flow-Through Cell) | A discriminatory in vitro dissolution apparatus used to develop predictive release profiles for complex formulations like PLGA microspheres, helping to establish IVIVC [56] [57]. |
| Validated Animal Cage Implant System | A specialized subcutaneous cage model that allows for the retrieval of administered microspheres in vivo, enabling direct analysis of polymer degradation and drug release mechanisms over time [56]. |
| Stable Isotope-Labeled Analytes | Internal standards used in Liquid Chromatography-Mass Spectrometry (LC-MS) for the highly precise and accurate quantification of drug concentrations and endogenous biomarkers in complex biological samples. |
Designing effective sampling protocols is a central challenge in circadian hormone research. The core difficulty lies in optimizing sampling timing when the rhythm's key parameters—especially its period—are not known in advance. This guide provides targeted troubleshooting and FAQs to help researchers navigate the uncertainties inherent in studying discrete and continuous period ranges, ensuring robust and reliable rhythm detection.
Troubleshooting Guides & FAQs
Common Problem: Failed Rhythm Detection
Your experiment did not find a statistically significant rhythm, even though one was expected.
Troubleshooting Steps:
- Repeat the Experiment: Unless cost or time-prohibitive, first repeat the experiment to rule out simple human error [59].
- Verify Experimental Controls: Ensure you have included appropriate positive and negative controls. A positive control can confirm that your assay can detect a known rhythm [59].
- Audit Reagents and Equipment: Check that all reagents have been stored correctly and have not expired. Verify that equipment like assay readers are functioning properly [59].
- Systematically Change Variables: Isolate and test one variable at a time [59] [60]. Common variables in rhythm detection include:
- Sampling Density: Are too few timepoints being collected?
- Sampling Design: Is an equispaced design being used for a rhythm of unknown period?
- Assay Sensitivity: Is the detection method for your hormone sufficiently sensitive?
FAQ: How should I sample if I don't know the period of my rhythm?
The optimal design depends on your prior knowledge of the period.
- For Known Periods: If the period is known (e.g., a strict 24-hour cycle), equispaced sampling is statistically optimal. You should space your measurements evenly across the entire cycle [34].
- For Discrete Period Uncertainty: If you are investigating a predetermined list of candidate periods (e.g., circadian and circatidal), you can use optimized non-equispaced designs to maximize statistical power across all periods simultaneously [34].
- For Continuous Period Uncertainty: If you are exploring a wide, continuous range of periods (e.g., from ultradian to circadian), specialized algorithms can generate sampling schedules that avoid "blind spots" and provide good power across the entire range [34].
FAQ: What are the consequences of using an equispaced design for a rhythm with an unknown period?
Using a design equispaced for a 24-hour period to study a non-24-hour rhythm can introduce systematic biases and significantly reduce your statistical power, potentially causing you to miss a real biological signal [34]. For discovery-oriented research, optimized irregular sampling can be more effective.
FAQ: My hormone data is very "noisy" with many short-term spikes. How can I distinguish a true circadian rhythm?
This is a common issue when studying episodic hormone fluctuations. The solution involves:
- High-Frequency Sampling: Capture the high-frequency pulses to accurately characterize the underlying circadian waveform [61].
- Mathematical Decomposition: Use quantitative methods like the cosinor analysis or periodogram to separate the low-frequency (circadian) variation from the high-frequency (episodic) fluctuations [61].
Experimental Protocols & Data Presentation
Core Protocol: Designing a Sampling Schedule for Period Uncertainty
Objective: To create a sampling protocol that maximizes the chance of detecting a circadian hormone rhythm when the exact period is uncertain.
Methodology:
- Define Period Range: Specify the continuous range (e.g., 20-28 hours) or discrete list of periods (e.g., 24h, 12h) you wish to investigate.
- Determine Sample Size: Establish the total number of samples (N) your budget and resources allow.
- Select Design Strategy:
- For a known period, use an N-point equispaced design.
- For discrete or continuous uncertainty, use computational tools (e.g., the PowerCHORD library) to generate an optimized sampling schedule [34].
- Execute Sampling: Collect samples according to the generated schedule across at least two full cycles of the longest candidate period.
- Rhythm Analysis: Analyze data using harmonic regression (e.g., cosinor model) for fixed periods or a free-period model with permutation testing for continuous ranges [34].
The following table summarizes key performance characteristics of different sampling designs for rhythm detection.
Table 1: Comparison of Sampling Design Strategies for Circadian Research
| Design Strategy | Known Period | Discrete Period Uncertainty | Continuous Period Uncertainty | Key Advantage |
|---|---|---|---|---|
| Equispaced | Optimal power [34] | Suboptimal power | Systematic biases near Nyquist rate [34] | Simple to implement for known cycles |
| Optimized Irregular | Not needed | Maximizes worst-case power [34] | Resolves blind spots [34] | Robustness for rhythm discovery |
Visualization of Workflows
Diagram: Strategy Selection for Sampling Design
The Scientist's Toolkit
Table 2: Essential Research Reagent Solutions for Circadian Hormone Studies
| Item | Function in Experiment |
|---|---|
| Sensitive Immunoassay Kits | Precise quantification of hormone concentrations from plasma or tissue samples. Critical for generating reliable time-series data. |
| PowerCHORD Library | Computational tool for optimizing the timing of measurements in experiments targeting biological rhythms of unknown period [34]. |
| Cosinor Analysis Software | Statistical package for applying harmonic regression to model rhythmic data and test for significance at fixed periods. |
| Positive Control Substances | Substances known to induce a predictable circadian hormone response. Used to validate experimental protocols and assay performance [59]. |
Frequently Asked Questions (FAQs)
Q1: What is a Digital Twin in the context of biological research, and how is it personalized? A Digital Twin (DT) is a virtual, real-time representation of a physical entity. In biomedical research, it is a sophisticated virtual model of a patient or a biological system that mirrors health status and predicts treatment responses [62] [63]. Personalization is achieved by creating this model using advanced computational techniques and diverse data sources from the individual, such as genetic information, treatment history, and demographic characteristics [63]. For circadian rhythm research, this involves using multi-omics data (genomics, transcriptomics) and continuous physiological monitoring to create a virtual model that simulates an individual's unique hormonal fluctuations [62] [29].
Q2: Why is Particle Swarm Optimization (PSO) particularly suited for personalizing these models? PSO is a metaheuristic optimization algorithm inspired by social behavior, capable of efficiently searching complex parameter spaces without requiring prior knowledge of the system's exact mathematical model [64] [65]. It is ideal for personalization because it can estimate non-instrumented or unknown parameters of a digital twin model in real-time by minimizing the difference between the model's output and real-world sensor data [64] [66]. This allows the twin to adapt and better represent the unique and dynamic characteristics of an individual's biological system, such as their specific circadian phase [64].
Q3: Our goal is to optimize the timing of sample collection for measuring circadian hormones. How can a Digital Twin help? Circadian rhythms regulate the 24-hour oscillation of many hormones [29] [67]. A personalized digital twin, once calibrated to an individual using their specific data (e.g., from wearable devices, limited blood samples), can simulate their internal circadian clock in silico [62] [29]. You can run simulations on the twin to identify the predicted times of peak and trough for specific hormones, thereby guiding the most informative time windows for physical sample collection. This reduces the need for extremely frequent, invasive sampling and helps account for individual variability in circadian phase [29].
Q4: What are the common sources of error that cause a Digital Twin's predictions to diverge from physical measurements? Common error sources can be divided into three categories [64] [68]:
- Data Quality: Noisy, inaccurate, or missing sensor data; insufficient data for the model's complexity; and lack of steady-state data for dynamic systems [68].
- Model Fidelity: Oversimplified model structures that fail to capture key biological processes; and incorrect or non-updated model parameters that have drifted from the physical system's true state [64].
- External Perturbations: Unaccounted changes in the individual's routine (e.g., sleep, meals, stress) that act as external disturbances on the system being modeled [29] [64].
Q5: How do we know if our personalized model is accurate enough? What quantitative metrics should we use? Model accuracy is typically evaluated by comparing the twin's predictions against a held-out validation dataset not used for training. Common quantitative metrics include [69] [68]:
- Root Mean Square Error (RMSE): Measures the standard deviation of the prediction errors.
- Mean Absolute Error (MAE): Measures the average magnitude of errors.
- Mean Absolute Percentage Error (MAPE): Expresses the error as a percentage, useful for understanding relative accuracy.
- Coefficient of Determination (R²): Indicates how well the predictions explain the variance in the observed data.
The following table summarizes key applications and validation metrics for digital twins across different fields, illustrating the shared principles of model evaluation:
Table 1: Digital Twin Applications and Performance Metrics
| Field/Application | Key Performance Metric | Reported Performance | Reference |
|---|---|---|---|
| Thermal Food Processing | Mean Average Percentage Error (MAPE) | 0.2% (on temperature prediction) | [69] |
| Parallel Robot Positioning | Root Mean Square Error (RMSE) | 1.1-1.5 mm (positioning accuracy) | [66] |
| Direct Air-Cooling Power Unit | Model Accuracy & Computational Time | ≥10% less error, 45% computing time saved vs. conventional methods | [70] [68] |
Troubleshooting Guides
Issue 1: Poor Convergence of PSO Algorithm During Model Calibration
Problem: The PSO algorithm fails to find a good parameter set, resulting in a high-cost function (error) after many iterations. The model does not fit the training data well.
Investigation & Resolution:
- Check 1: Swarm Initialization and Size
- Action: Verify the initial positions and velocities of the particles. If they are initialized poorly, the swarm may get stuck in a local optimum.
- Solution: Increase the swarm size for a more comprehensive search of the parameter space. Consider using chaotic mapping for initializing particle positions to improve diversity, as demonstrated in improved PSO variants [66].
- Check 2: Algorithm Hyperparameters
- Action: Review the PSO's hyperparameters: inertia weight (ω), and acceleration constants (c1, c2).
- Solution: Implement a dynamic inertia weight that decreases over iterations to shift from global exploration to local exploitation. Tune c1 (cognitive component) and c2 (social component); a common starting point is c1 = c2 = 2 [65].
- Check 3: Parameter Bounds and Cost Function
- Action: Ensure the parameter search space (bounds) is defined correctly and is not excluding the true optimal values.
- Solution: Re-evaluate the biological plausibility of the parameter bounds. Simplify the cost function if it is overly complex and noisy.
Preventive Best Practices:
- Hybridize PSO with a local search algorithm to refine solutions [66].
- Use a hybrid terminating strategy that stops based on both a maximum iteration count and a minimal error threshold to save computational resources [70].
Issue 2: Digital Twin and Physical System Data Are Not Synchronizing Correctly
Problem: There is a persistent lag or systematic offset between the data streams from the physical entity (e.g., sensor readings) and the digital twin, breaking the real-time mirroring.
Investigation & Resolution:
- Check 1: Data Preprocessing Pipeline
- Action: Inspect the procedures for outlier detection and steady-state detection.
- Solution: Implement robust data preprocessing to filter out noise and non-representative data points. Ensure that the data from the physical system is collected under steady-state conditions for valid model comparisons, as is standard in industrial applications [68].
- Check 2: Communication and Data Transmission Latency
- Action: Measure the time delays in the data acquisition and transmission system.
- Solution: Optimize the data transmission protocols. Use a structured connection layer that efficiently handles real-time data via WLAN or serial ports, ensuring data is time-stamped and processed in sequence [66].
- Check 3: Clock Synchronization
- Action: Verify that the clocks on all data source devices and the twin's simulation engine are synchronized.
- Solution: Implement a network time protocol (NTP) or similar method to synchronize all system clocks to a single source.
Preventive Best Practices:
- Design a framework with a dedicated "connection layer" responsible for standardized data collection and transmission, as outlined in digital twin architectures for robotics [66].
Issue 3: Model Predictions Are Accurate Initially but Deteriorate Over Time
Problem: The digital twin performs well after initial calibration but its predictive power decays as time passes, indicating a loss of fidelity.
Investigation & Resolution:
- Check 1: System Parameter Drift
- Action: Determine if the underlying physical system's parameters have changed (e.g., due to disease progression, aging, or changes in lifestyle).
- Solution: Implement continuous or online parameter estimation. Use the PSO algorithm in a recurring manner to re-calibrate the model parameters periodically using recent data, adapting the twin to the evolving state of the physical entity [64].
- Check 2: Unmodeled Dynamics or External Factors
- Action: Investigate if new external factors (e.g., new medication, significant sleep deprivation) are influencing the system in a way not captured by the model.
- Solution: Expand the model structure to include key external "zeitgebers" (time cues) like light exposure, meal times, and exercise, which are known to influence circadian rhythms [29]. The model should account for these inputs.
Preventive Best Practices:
- Design the digital twin with a self-aware architecture, enabling it to perceive abnormalities in its own predictions and trigger a re-optimization process automatically [64].
Experimental Protocol: Calibrating a Circadian Hormone Model
This protocol details the methodology for using PSO to personalize a digital twin of circadian cortisol fluctuations.
Objective: To calibrate the parameters of a computational model of cortisol secretion so that its output closely matches experimental data from an individual.
Materials and Reagents: Table 2: Research Reagent Solutions and Essential Materials
| Item | Function/Brief Explanation |
|---|---|
| Biospecimens (Serum/Saliva) | Source for direct measurement of hormone concentrations (e.g., cortisol) over time. |
| ELISA or LC-MS Kits | To quantitatively determine hormone levels from biospecimens. |
| Wearable Activity Tracker | To monitor rest-activity cycles, a strong behavioral correlate of circadian phase [29]. |
| TimeTeller or Similar Tool | A non-invasive computational tool for characterizing an individual's circadian rhythm from molecular data [29]. |
| Vive-tracker or High-Precision Sensor | Example of a high-precision measuring device for validating spatial models; analogous to gold-standard hormone assays for temporal validation [66]. |
Step-by-Step Procedure:
- Data Acquisition:
- Collect time-series data of the individual's cortisol levels. In a research setting, this involves collecting saliva or blood samples at fixed intervals (e.g., every 2 hours) over a 24-48 hour period under controlled conditions.
- Simultaneously, collect data from wearable devices on light exposure, activity, and sleep.
Model Selection and Initialization:
- Select a mathematical model of the hypothalamic-pituitary-adrenal (HPA) axis that can generate cortisol secretion profiles.
- Define the model's parameters to be calibrated by PSO (e.g., amplitude, phase, baseline secretion rate).
- Set biologically plausible lower and upper bounds for each parameter.
Cost Function Definition:
- Define a cost function, typically the Root Mean Square Error (RMSE), which quantifies the difference between the model's predicted cortisol levels and the experimentally measured levels.
PSO Execution:
- Initialize the PSO swarm with particles at random positions within the parameter bounds.
- For each particle, run the model with its parameter set and calculate the cost function.
- Update each particle's personal best (
pbest) and the swarm's global best (gbest). - Update particle velocities and positions using standard PSO equations [64] or improved variants [66].
- Iterate until the termination criterion is met (e.g.,
gbestis below an error threshold or a maximum number of iterations is reached).
Validation:
- Validate the personalized model by testing its predictions on a new dataset from the same individual that was not used for calibration.
The workflow for this calibration process, from data collection to model validation, is illustrated below.
Core Signaling Pathways & System Architecture
The molecular circadian clock is regulated by a core transcriptional-translational feedback loop (TTFL). Understanding this pathway is fundamental to modeling circadian biology.
Diagram: Core Mammalian Circadian Clock Pathway
A successful digital twin implementation relies on a well-defined architecture that ensures continuous data flow and interaction between the physical and virtual entities. The following diagram outlines a standard framework adapted for a biomedical context.
Diagram: Digital Twin System Architecture
Troubleshooting Guides & FAQs
Q1: In our shift work simulation, why don't all participants' circadian phases shift as expected despite controlled light exposure?
- A: Individual chronotype significantly influences circadian phase resetting. Participants with a strong evening chronotype may exhibit smaller phase advances compared to morning types under the same protocol [17]. Furthermore, ensure that non-photic cues are controlled. Unregulated feeding or snack times during the experiment can act as conflicting zeitgebers, providing opposing signals that disrupt the intended phase shift from the light schedule [71].
Q2: We observe inconsistent hormonal readouts (e.g., melatonin, cortisol) between participants. Could our sampling protocol be the issue?
- A: Yes, inconsistent sampling timing relative to individual sleep-wake cycles is a common source of variability. Hormone secretion is tightly coupled to an individual's circadian phase [17] [72]. For instance, melatonin should be sampled relative to the Dim Light Melatonin Onset (DLMO). Implement a standard pre-sampling protocol, including dim light conditions (<10 lux) for at least 30 minutes before melatonin sampling to avoid light-induced suppression [73] [72].
Q3: How can we differentiate between an endogenous circadian rhythm and a pattern caused by daily hospital routines in patient data?
- A: This is a key challenge when using real-world clinical data [74]. Endogenous circadian rhythms will persist in the absence of external cues, while operationally driven patterns will not. To distinguish them, analyze data from nights with minimal clinical interventions. Additionally, use statistical models that can decompose time series data into circadian and operational components. Tracking a robust marker of the central pacemaker, like DLMO, in a subset of patients can provide a ground truth for the endogenous rhythm [72] [74].
Q4: What is the most effective single intervention for rapidly delaying the circadian phase to simulate a night shift schedule?
- A: Research indicates that an 8-hour session of continuous blue-enriched white light exposure is highly effective for inducing significant phase delays. One study showed this protocol resulted in a phase shift of -6.59 hours, which was significantly larger than a control condition [73]. For maximal effect, this light exposure should be timed to occur during the biological night, prior to the core body temperature minimum.
Q5: Why did the addition of a scheduled exercise regimen to our light therapy protocol not produce a statistically significant additional phase shift?
- A: This finding is consistent with some research. One study found that adding moderate-intensity exercise to an 8-hour continuous blue-enriched light exposure did not result in significantly larger phase delays compared to light exposure alone [73]. This suggests that when a sufficiently strong zeitgeber like robust light therapy is present, the additive effect of a weaker non-photic zeitgeber like exercise may be minimal. The phase-resetting power of exercise might be more pronounced when used alone or with weaker light stimuli.
The following table summarizes key experimental outcomes from research on phase-shifting human circadian rhythms using different zeitgeber combinations.
Table 1: Efficacy of Different Zeitgeber Protocols for Circadian Phase Shifting
| Target Shift | Protocol Description | Key Zeitgebers | Measured Phase Shift (Mean ± SD) | Key Findings |
|---|---|---|---|---|
| 8-hour Advance [73] | Gradual (1.6 h/day over 5 days) with Dynamic Lighting Schedule (DLS) | Light (Blue-enriched & depleted) | 2.88 ± 0.31 hours | No significant difference was found between gradual and "slam" shift protocols when both were supported by a DLS. |
| 8-hour Advance [73] | Abrupt ("Slam", 8h at once) with Dynamic Lighting Schedule (DLS) | Light (Blue-enriched & depleted) | 3.28 ± 0.37 hours | No significant difference was found between gradual and "slam" shift protocols when both were supported by a DLS. |
| 8-hour Delay [73] | Abrupt, 8-h continuous room light (Control) | Light (Room light) | -4.74 ± 0.62 hours | Served as a baseline for delay protocols. |
| 8-hour Delay [73] | Abrupt, 8-h continuous blue-enriched light | Light (Blue-enriched, continuous) | -6.59 ± 0.43 hours | Induced significantly larger phase delays than the room light control. |
| 8-hour Delay [73] | Abrupt, 8-h intermittent blue-enriched light (7x 15-min pulses) | Light (Blue-enriched, intermittent) | -3.90 ± 0.62 hours | Induced ~60% of the shift achieved by continuous exposure with only 25% of the light duration. |
| 8-hour Delay [73] | Abrupt, 8-h continuous blue-enriched light + exercise | Light + Exercise | -6.41 ± 0.69 hours | The addition of exercise did not lead to a statistically significant increase in phase delay compared to continuous light alone. |
Experimental Protocols
Protocol 1: Simulating Shift Work with Dynamic Lighting
This protocol is designed to facilitate circadian adaptation to an 8-hour shifted schedule, as used in [73].
1. Objective: To assess the efficacy of a Dynamic Lighting Schedule (DLS) in advancing or delaying the central circadian pacemaker in a shift work simulation.
2. Key Materials: See "Research Reagent Solutions" below.
3. Procedure:
- Participant Screening: Recruit healthy adults. Exclude for color blindness, recent shift work, or transmeridian travel. Confirm regular sleep schedules via actigraphy and self-reports for at least one week prior [73].
- Baseline Phase Assessment: Admit participants to an inpatient laboratory. Determine the time of Dim Light Melatonin Onset (DLMO) under controlled conditions to establish baseline circadian phase [73] [72].
- Intervention:
- For Advance Protocols: Shift the sleep/wake schedule either gradually (1.6 h/day) or abruptly (8 h at once). During waking hours on the shifted schedule, implement the DLS: expose participants to blue-enriched white light (~704 melanopic EDI lux) for 6.5 hours. In the 2 hours immediately before sleep, provide blue-depleted dim light (~26 melanopic EDI lux) [73].
- For Delay Protocols: Abruptly shift the sleep/wake schedule by 8 hours. During the 8-hour night shift, assign participants to one of several lighting conditions: continuous room light (control), continuous blue-enriched light, intermittent blue-enriched light, or continuous blue-enriched light with a session of moderate-intensity exercise [73].
- Post-Intervention Phase Assessment: After 5 days on the shifted schedule, re-assess the DLMO under constant routine or similar controlled conditions to determine the final circadian phase [73] [72].
- Data Analysis: Calculate the phase shift as the difference between the baseline and final DLMO times. Compare shifts between experimental groups using appropriate statistical tests (e.g., t-tests, ANOVA) [73].
Protocol 2: Assessing Peripheral Clock Disruption in Animal Models
This protocol uses a Zeitgeber Desynchrony (ZD) paradigm in mice to dissect the relative impact of conflicting light and feeding cues [71].
1. Objective: To quantify the differential contributions of light-dark cycles and feeding-fasting cycles to the resetting of peripheral tissue clocks.
2. Key Materials: Nocturnal rodents (e.g., C57BL/6 mice), housing with controlled light cabinets, running wheels for activity monitoring, equipment for tissue collection (e.g., liver, adrenal gland), RNA extraction kits, and qPCR systems.
3. Procedure:
- Habituation: House mice under standard 12-hour light:12-hour dark (LD12:12) conditions with ad-libitum access to food and water.
- Zeitgeber Desynchrony: Switch the light-dark cycle to a 28-hour period (LD14:14) while imposing a 24-hour restricted feeding schedule (12-hour food access:12-hour no food). This creates a paradigm where the two main zeitgebers are in constant conflict, cycling in and out of phase [71].
- Sampling: On days when food access coincides with the dark phase ("in-phase" days) and when it coincides with the light phase ("anti-phase" days), sacrifice cohorts of mice at regular intervals over the 24-hour cycle. Collect tissue samples (e.g., liver, white adipose tissue, adrenal gland) and blood serum [71].
- Analysis:
- Molecular Rhythms: Extract RNA from tissues and analyze the expression profiles of core clock genes (e.g., Bmal1, Per2, Dbp) using qPCR [71].
- Hormonal Rhythms: Measure circulating levels of hormones like corticosterone and leptin from serum samples using ELISA or RIA [71].
- Behavioral Rhythms: Continuously monitor running-wheel activity to assess locomotor activity rhythms [71].
- Data Interpretation: Compare the phase and amplitude of gene expression and hormonal rhythms between "in-phase" and "anti-phase" days. Tissues strongly entrained by the SCN (master clock) will maintain a stable relationship to the light cycle, while those entrained by feeding will shift their phase to align with food availability [71].
Signaling Pathway and Workflow Diagrams
Zeitgeber Impact on Body Clocks
Circadian Research Workflow
Research Reagent Solutions
Table 2: Essential Research Reagents and Materials for Circadian Studies
| Item | Function / Application | Example / Notes |
|---|---|---|
| Actigraphy Device | Objective monitoring of sleep-wake cycles and general locomotor activity over long periods in free-living conditions. | Worn like a watch on the wrist; provides data on activity onset, offset, and fragmentation [73]. |
| Melatonin Assay Kit | Gold-standard method for assessing the phase of the central circadian clock by measuring Dim Light Melatonin Onset (DLMO). | Typically uses saliva or plasma samples. Requires strict dim light conditions during collection [73] [72]. |
| Blue-Enriched Light Source | A potent zeitgeber for phase-resetting the circadian system. Used in experiments to induce phase advances or delays. | Should be characterized by its melanopic Equivalent Daylight Illuminance (mel-EDI); e.g., 704 melEDI lux was used in [73]. |
| qPCR System & Reagents | Quantifying rhythmic gene expression of core clock genes (e.g., Bmal1, Per2, Dbp) in tissue samples from animal models. | Essential for studying peripheral clock entrainment and disruption [71]. |
| Hormone Assay Kits | Measuring circadian fluctuations in endocrine markers such as cortisol/corticosterone, leptin, and others from serum/plasma. | ELISA or RIA kits are commonly used to create 24-hour hormone profiles [71]. |
| Controlled Environment Chambers | Precisely regulating light, temperature, and sometimes humidity for human inpatient studies or rodent housing. | Critical for constant routine and forced desynchrony protocols to remove masking effects [73] [72]. |
Ensuring Accuracy: Validation, Comparative Analysis, and Future Tools
Troubleshooting Guide: Common Issues in Circadian Data Analysis
FAQ: How do I choose the right rhythm detection method for my gene expression data?
The optimal method depends on your data's waveform characteristics and experimental design.
- Problem: Many circadian gene expression datasets contain non-sinusoidal waveforms (e.g., sawtooth patterns) that standard sine-based detectors miss.
- Solution: For data with potential asymmetric patterns, use methods specifically designed for non-sinusoidal waveforms. RAIN (Rhythmicity Analysis Incorporating Nonparametric methods) and empirical JTKCYCLE with asymmetry search significantly outperform other methods for detecting these rhythms [75] [76] [77]. If your data is expected to be primarily sinusoidal, JTKCYCLE and ANOVA remain robust choices, especially for noisy, limited data [76] [77].
Table 1: Comparison of Rhythm Detection Methods for Genomic Data
| Method | Best For | Waveform Assumption | Key Strength | Consideration |
|---|---|---|---|---|
| RAIN [75] | Non-sinusoidal, asymmetric rhythms | Any (nonparametric) | Detects rhythms with steep rises and slow decays (or vice versa) | More sensitive to asymmetric waveforms than JTK_CYCLE |
| empirical JTK_CYCLE [76] [77] | Asymmetric waveforms & controlled false discovery | User-defined (e.g., asymmetric) | Accurate p-values for arbitrary waveforms; high sensitivity | Improved version of JTK_CYCLE |
| JTK_CYCLE [76] [78] | Noisy, limited data | Symmetric (default: cosine) | Robust nonparametric approach; performs well on sparse data | May miss strongly asymmetric rhythms |
| ANOVA [76] [77] | Detecting any significant variation across time points | None | Tests for any significant differences between time point means | Requires replicates to estimate variance |
| F24 [76] [77] | Sine-like rhythms | Sinusoidal | Projects data onto 24-hour Fourier basis | Performance drops for non-sinusoidal data |
FAQ: Why do my phase estimates seem unreliable or inconsistent across methods?
Phase is a relative measure, and its estimation is highly dependent on the underlying assumptions of the algorithm and the nature of the signal itself [79].
- Problem: Phase estimation from noisy neural data or hormonal time series is inherently ambiguous, especially when rhythms are broadband, non-sinusoidal, or amplitude-modulated.
- Solution:
- Use Multiple Phase Estimators: Compare results from at least two different phase estimation methods. Consistency across methods increases confidence in the estimate [79].
- Incorporate Uncertainty Metrics: Employ methods that provide a measure of confidence or credible intervals for the phase estimate, such as State Space Phase Estimation (SSPE) [80].
- Validate with Strong Signals: Be cautious when interpreting phase estimates from weak rhythmic signals. Methods are generally reliable only for rhythms with a strong signal [78].
Table 2: Phase Estimation Methods and Their Applications
| Method | Principle | Best For | Advantages | Limitations |
|---|---|---|---|---|
| FIR-Hilbert [79] [80] | Bandpass filtering + Hilbert transform | Offline analysis of narrowband rhythms | Simplicity; widely used | Sensitive to noise and filter choice; distorted by non-sinusoidal waveforms |
| State Space Phase Estimator (SSPE) [80] | Tracks analytic signal as a latent state | Real-time tracking; broadband rhythms | Models signal/noise separately; provides confidence intervals; handles non-sinusoidal data | More complex implementation |
| Poincaré Section [79] | Marks a phase when trajectory crosses a plane | General rhythmic activity | Conceptually simple | Highly sensitive to noise and user-defined parameters |
FAQ: What is the most important factor in experimental design for powerful rhythm detection?
For a fixed number of total samples, prioritizing biological replicates over higher sampling density provides better sensitivity and specificity for detecting rhythms [76] [77].
- Problem: Sparsely sampled time-series data without replicates have low signal-to-noise ratios, preventing reliable rhythm identification.
- Solution: When designing experiments, allocate resources to include multiple biological replicates at each time point. This allows for a more robust estimation of biological variance and improves statistical power more than simply increasing the number of time points alone [76].
FAQ: Are all statistically significant rhythmic genes biologically relevant?
Not necessarily. Statistical significance does not always equate to biological relevance.
- Problem: Using standard p-value thresholds (e.g., p < 0.01) can identify a large set of "rhythmic" genes, but many of these may have weak, biologically irrelevant rhythms [78].
- Solution:
- Use Conservative Thresholds: Apply stringent significance thresholds (e.g., FDR < 0.01) and focus on genes with strong amplitude rhythms.
- Seek External Validation: Where possible, validate findings using evolutionary conservation of rhythmic expression or independent experimental data [78].
Experimental Protocols
Protocol: Implementing State Space Modeling for Real-Time Phase Estimation
This protocol is based on the method described in [80] for tracking phase in neural data, adaptable for other rhythmic signals.
- Model Definition: Define a state-space model where the latent state represents the complex-valued analytic signal (amplitude and phase) of the rhythm.
- Parameter Fitting: Acausally fit the model parameters (e.g., oscillator frequencies, noise covariances) to a representative segment of your data. This assumes spectral stationarity.
- Real-Time Tracking: Apply a Kalman filter to track the latent state (the analytic signal) as new data points are acquired.
- Phase Extraction: At each time step, compute the phase from the arctangent of the imaginary part divided by the real part of the estimated analytic signal.
- Uncertainty Quantification: Use the covariance matrix from the Kalman filter to define credible intervals for the phase estimate.
Protocol: Detecting Asymmetric Circadian Transcripts with RAIN
This protocol is for identifying genes with non-sinusoidal expression patterns from genome-wide time-series data [75].
- Data Preparation: Format your gene expression time series as a matrix, with genes as rows and time points as columns.
- Software Setup: Install the RAIN package in R/Bioconductor or access the web interface.
- Parameter Setting: Specify the period to test for (e.g., 24 hours) and the sampling interval. The default settings for umbrella peak locations (steepness of rises and falls) are typically sufficient.
- Execution: Run the RAIN algorithm on your expression matrix.
- Result Interpretation: Identify significantly rhythmic genes based on the adjusted p-values. The algorithm tests for alternating rising and falling patterns independently, allowing it to capture asymmetric waveforms.
Essential Visualizations
Diagram 1: Rhythm Detection Method Selection
Diagram 2: Circadian Clock Gene Feedback Loop
The Scientist's Toolkit: Research Reagent Solutions
Table 3: Essential Computational Tools for Rhythm Analysis
| Tool / Resource | Function | Application Note |
|---|---|---|
| RAIN R/Bioconductor Package [75] | Detects rhythmicity with non-sinusoidal waveforms | Critical for uncovering asymmetric expression patterns in transcriptomic data. |
| State Space Phase Estimator (SSPE) [80] | Real-time, robust phase tracking | Provides confidence intervals; superior for broadband neural rhythms and phase-reset events. |
| empirical JTK_CYCLE [76] [77] | Rhythm detection with improved p-value calculation | An enhanced JTK_CYCLE variant that controls false discovery rates for diverse waveforms. |
| MetaCycle R Package [78] | Integrates multiple rhythm detection algorithms | Allows users to run ARSER, JTK_CYCLE, and Lomb-Scargle within a single framework. |
| Evolutionarily Conserved Rhythmic Genes [78] | A biological validation set | Use as a benchmark to test the biological relevance of your rhythm detection results. |
This technical support center provides troubleshooting guidance for researchers employing computational phase inference methods in circadian biology. Focusing on the analysis of circadian hormone fluctuations, this resource compares the novel Bayesian algorithm Tempo with Traditional Phase Inference methods, helping you optimize sampling timing, select the right tools, and interpret your results accurately [38] [81].
FAQs & Troubleshooting Guides
Q1: What are the fundamental technical differences between Tempo and traditional methods like Cyclum or Cyclops?
A: The core difference lies in Tempo's use of a Bayesian framework with variational inference to directly address the high noise and sparsity of single-cell RNA-sequencing (scRNA-seq) data, particularly from droplet-based platforms [38].
The table below summarizes the key technical distinctions:
| Feature | Tempo | Traditional Methods (e.g., Cyclum, Cyclops) |
|---|---|---|
| Core Algorithm | Bayesian Variational Inference [38] [81] | Autoencoder Neural Networks [38] |
| Statistical Model | Negative Binomial count model [38] [81] | Varies; often not tailored for scRNA-seq sparsity |
| Uncertainty Quantification | Yes, provides well-calibrated posterior distributions for phase [38] | No, provides only point estimates without confidence [38] |
| Handling of Clock Genes | Incorporates domain knowledge via priors and identifies de novo cycling genes [38] | Typically relies on input gene sets without dynamic identification |
| Computational Scalability | Fast, designed for large droplet-based datasets [38] | Run times scale poorly with the number of cells [38] |
Troubleshooting Tip: If your analysis of droplet-based scRNA-seq data (e.g., from 10X Genomics) is yielding highly variable or unreliable phase estimates, your chosen traditional method might be a poor fit for the data's noise structure. Switching to Tempo, with its dedicated Negative Binomial model, should improve robustness.
Q2: Why are my phase estimates inaccurate, and how can I improve them?
A: Inaccurate phase estimates can stem from multiple sources. The solution depends on correctly diagnosing the problem.
| Symptom | Possible Cause | Solution |
|---|---|---|
| High error in point estimates across the cell population. | Using a method not robust to sparse data. | Switch to Tempo, which is explicitly designed for sparse droplet-based data [38]. |
| Inconsistent results when repeating analysis. | Method does not quantify uncertainty, making results hard to interpret. | Use Tempo to obtain posterior phase distributions and check if the confidence intervals are too wide for your data quality [38]. |
| Poor identification of rhythmic genes beyond the core clock. | Method lacks a dynamic gene selection mechanism. | Ensure you are running Tempo for multiple iterations to allow its de novo cycler identification step to function [38]. |
| Phase estimates conflict with known experimental time. | Imperfect prior knowledge of core clock gene acrophase. | In Tempo, you can adjust the prior scale for acrophase. A prior with a 95% interval width of 4 hours has been shown to be effective even with imperfect information [38]. |
Q3: How do I design an experiment for circadian phase inference that optimizes sampling for hormone research?
A: Effective experimental design is critical for successful phase inference, especially when correlating with hormonal rhythms.
- Sampling Strategy: For unsynchronized cells (e.g., in a dish), a single sample is sufficient for phase inference with Tempo. For time-course designs (e.g., every 4-6 hours over 24-48 hours), ensure you collect enough time points to capture the waveform [38] [82].
- Non-Invasive Sampling for Validation: Saliva is an excellent non-invasive material for validating peripheral clock timing. It allows for repeated sampling to measure circadian markers like cortisol and core clock gene expression (e.g., ARNTL1, PER2) [82]. Studies show a significant correlation between the acrophase of salivary ARNTL1 expression and cortisol, linking the molecular clock to hormonal output [82].
- Data Integration: Questionnaires like the Morningness-Eveningness Questionnaire (MEQ) can provide an estimate of chronotype. However, for precise phase assessment in hormone studies, combine them with molecular data from saliva or other tissues [82].
Troubleshooting Tip: If your inferred cellular phases do not align with expected hormonal peaks (e.g., cortisol upon waking), use saliva as a bridging biospecimen to measure both your molecular clock (gene expression) and hormonal (cortisol) rhythms directly in the same individual to recalibrate your understanding of the phase relationship [82].
The Scientist's Toolkit: Essential Research Reagents & Materials
The following table lists key resources for conducting circadian phase inference experiments, particularly in the context of hormone research.
| Item | Function / Application |
|---|---|
| Droplet-based scRNA-seq Kit (e.g., 10X Genomics) | High-throughput single-cell transcriptome profiling for phase inference input data [38]. |
| Saliva Collection Kit (e.g., Salivette) | Non-invasive collection of saliva for hormone (cortisol/melatonin) and RNA analysis [82]. |
| RNA Stabilization Reagent (e.g., RNAprotect) | Preserves RNA integrity in saliva samples during storage and transport [82]. |
| Core Clock Gene Panel | Primer/probe sets for genes like ARNTL1 (BMAL1), PER2, NR1D1 for qPCR validation [82]. |
| Tempo Software Package | The Bayesian computational tool for circadian phase inference from scRNA-seq data [38] [81]. |
| Chronotype Questionnaire (e.g., MEQ-SA) | A tool for estimating an individual's inherent sleep-wake phase (chronotype) [82]. |
Experimental Protocols & Workflows
Protocol 1: In Silico Phase Inference with Tempo
This protocol details the steps to run the Tempo algorithm on your scRNA-seq count matrix [38] [81].
- Input Preparation: Prepare your cell-by-gene count matrix. Tempo requires this data, a list of known core clock genes (e.g., ~20 genes), and prior knowledge on cell and gene parameters.
- Algorithm Initialization: Tempo initializes its list of cycling genes using the provided core clock genes.
- Iterative Optimization (Steps 1 & 2): The algorithm runs a two-step process until convergence:
- Step 1 (Parameter Optimization): Tempo optimizes an approximate joint posterior distribution of cell phases and gene parameters by minimizing its Kullback-Leibler (KL) divergence from the true posterior, using only the current set of cycling genes.
- Step 2 (De Novo Cycler Identification): Using the phase posteriors from Step 1, Tempo fits models to genes not currently classified as cyclers. Those best described by a circadian waveform are added to the cycling gene set.
- Output Analysis: The final output is the optimized posterior distribution, which provides:
- Point estimates (e.g., mean) and credible intervals for each cell's circadian phase.
- The final set of identified cycling genes, including both core clock and de novo candidates.
Protocol 2: Validating Computational Phase with Salivary Hormonal Rhythms
This protocol describes how to biologically validate computationally inferred phases using paired saliva samples [82].
- Sample Collection: Collect saliva samples from the same donors used for scRNA-seq at 3-4 time points per day for at least two consecutive days. Collect simultaneously for RNA and hormone analysis.
- Molecular Analysis:
- Gene Expression: Extract RNA from saliva and quantify expression of core clock genes (e.g., ARNTL1, PER2) using qPCR or specialized kits like TimeTeller.
- Hormone Assaying: Use immunoassays (e.g., ELISA) to measure cortisol and/or melatonin levels from the same saliva samples.
- Data Integration & Correlation: Calculate the acrophase (time of peak) for both the gene expression rhythms (e.g., from Tempo or directly from saliva time series) and the hormone rhythms. A significant correlation, particularly between the acrophase of ARNTL1 and cortisol, validates that your computational phase aligns with a key circadian hormonal output [82].
Methodological Diagrams
Diagram 1: Core Circadian Clock Mechanism
This diagram illustrates the transcriptional-translational feedback loop of the molecular circadian clock, which regulates the rhythmic expression of genes analyzed by phase inference methods [3].
Diagram 2: Tempo's Variational Inference Workflow
This flowchart outlines the core iterative process of the Tempo algorithm for inferring circadian phase from scRNA-seq data [38] [81].
Frequently Asked Questions (FAQs)
FAQ 1: What is the advantage of combining metabolites with traditional Bone Turnover Markers (BTMs)?
Combining metabolites with BTMs creates a more sensitive and powerful diagnostic model. A 2019 study found that while a model using BTMs alone had a good ability to distinguish osteoporosis, adding selected metabolites significantly improved the model's accuracy in both men and postmenopausal women [83].
FAQ 2: How does the time of day affect the measurement of bone turnover markers?
Bone turnover markers are influenced by circadian rhythms and exhibit both daily and short-term, episodic fluctuations [61]. Studies show that markers like β-CTx have a clear circadian pattern. Therefore, consistency in the timing of sample collection is critical for obtaining reliable and comparable data, especially in longitudinal studies [84].
FAQ 3: When should I use an ELISA versus a Western Blot for analyzing bone markers?
The choice depends on your experimental goal [85]:
- Use ELISA when you need to quantify the concentration of a specific marker (like P1NP or β-CTx) in many samples quickly and with high sensitivity.
- Use Western Blot when you need to confirm the identity of a protein, check its molecular weight, or analyze its presence in a complex mixture. It is often used to validate results from other methods.
FAQ 4: Can exercise influence bone marker measurements, and should this be controlled for?
Yes, acute exercise has a measurable and transient effect on bone resorption markers. A 2020 study demonstrated that a 45-minute exercise session led to a significant decrease in β-CTx levels [84]. To minimize this variability, it is recommended to standardize physical activity for participants for a period (e.g., 24 hours) prior to sample collection.
FAQ 5: What does "circadian amplitude" mean, and why is it important for biomarker research?
Circadian amplitude refers to the strength or intensity of your body's 24-hour rhythmic oscillations [25]. A high amplitude indicates a robust, well-synchronized internal clock, which leads to tighter regulation of physiological processes, including metabolism and hormone secretion. A low amplitude, often caused by circadian disruptions (like shift work or irregular sleep), is linked to dysregulated metabolism and poorer health outcomes, which can directly affect biomarker levels and their interpretation [25].
Troubleshooting Guides
Problem: High Variability in Biomarker Readings
| Potential Cause | Solution |
|---|---|
| Inconsistent Sampling Time | Implement and strictly adhere to a standardized phlebotomy protocol that records the exact time of sample collection for all participants [61]. |
| Recent Physical Activity | Instruct participants to avoid strenuous exercise for 24 hours prior to sampling and record any physical activity performed [84]. |
| Uncontrolled Diet/Fasting State | Standardize the fasting duration before sample collection, as nutrient availability is a key factor influencing circadian metabolic processes [25]. |
| Suboptimal Analytical Technique | If quantification is the goal, use ELISA. If target identity is in question, confirm with Western Blot [85]. Always validate antibody specificity. |
Problem: Suspected Circadian Disruption in Study Cohort
| Potential Cause | Solution |
|---|---|
| Shift Work or Social Jet Lag | Screen participants for their work schedules and sleep habits using questionnaires to identify those with significant circadian misalignment [25]. |
| Evening Light Exposure | Advise participants to minimize exposure to blue light from electronic devices in the evening to help maintain a robust circadian amplitude [25]. |
| Irregular Meal Timing | Collect data on participants' typical eating windows, as mistimed food intake can desynchronize peripheral circadian clocks in metabolic organs like the liver [25]. |
Data Presentation: Quantitative Evidence
Table 1: Diagnostic Performance of Models Combining Metabolites and Bone Turnover Markers (BTMs) [83]
This table summarizes the improved ability to distinguish osteoporosis when metabolites are added to standard BTMs. AUC (Area Under the Curve) is a measure of diagnostic performance where 1.0 is perfect and 0.5 is no better than chance.
| Study Group | Model Description | Area Under the Curve (AUC) | 95% Confidence Interval | p-value |
|---|---|---|---|---|
| Males | BTMs Only | 0.729 | 0.647 - 0.802 | < 0.0001 |
| BTMs + 5 Selected Metabolites | 0.828 | 0.754 - 0.888 | < 0.0001 | |
| Postmenopausal Females | BTMs Only | 0.638 | 0.562 - 0.708 | 0.0025 |
| BTMs + 9 Selected Metabolites | 0.741 | 0.669 - 0.803 | < 0.0001 |
Table 2: Acute Effects of Moderate Exercise on Bone Turnover Markers [84]
This table shows the percent change in bone resorption and formation markers immediately following a 45-minute exercise session.
| Biomarker | Function | Response to Exercise (immediately post) | Between-Group Difference |
|---|---|---|---|
| β-CTx | Bone Resorption | ↓ Decreased significantly (p<0.001) | The suppression was attenuated in T1D patients (p=0.02) |
| P1NP | Bone Formation | No significant change (p=0.20) | No significant difference |
Experimental Protocols
Protocol 1: Validating a Combined Metabolite-BTM Model for Osteoporosis Classification
This protocol is based on a study that discovered potential biomarkers for osteoporosis using LC-MS/MS [83].
- Participant Recruitment: Recruit a defined cohort (e.g., 320 participants including males and postmenopausal females).
- BMD Measurement: Determine Bone Mineral Density (BMD) at key sites (lumbar spine, femoral neck) using DXA.
- Blood Collection & Analysis:
- BTMs: Test serum for standard bone turnover markers (e.g., osteocalcin, PINP, β-CTx).
- Metabolomics: Profile the serum metabolome using mass spectrometry to quantify a wide range of metabolites (e.g., acylcarnitines, amino acids, glycerophospholipids).
- Data Analysis & Model Building:
- Use machine learning algorithms (e.g., Random Forest) to filter metabolites and select those with the highest importance for osteoporosis classification.
- Construct diagnostic models (e.g., using ROC curves) to compare the performance of BTMs alone versus BTMs combined with the selected metabolites.
Protocol 2: Assessing Acute Bone Turnover Response to an Intervention
This protocol is adapted from a case-control study investigating the effects of exercise in people with and without type 1 diabetes [84].
- Participant Preparation: Match case and control groups for age, sex, and fitness. Participants should fast overnight.
- Baseline Sampling: Insert a cannula and collect the first blood sample at baseline.
- Controlled Exercise Intervention: Have participants complete a standardized exercise session (e.g., 45 minutes of incline walking at 60% of their peak oxygen uptake).
- Serial Blood Sampling: Collect additional blood samples immediately post-exercise, and at 30 and 60 minutes post-exercise.
- Sample Analysis: Measure markers of bone resorption (β-CTx), formation (P1NP), and related metabolites (PTH, phosphate, calcium) in all samples.
- Statistical Analysis: Analyze data using a mixed-model ANOVA to assess changes over time and differences between groups.
The Scientist's Toolkit: Research Reagent Solutions
Table 3: Essential Materials for Bone Biomarker and Metabolite Research
| Item | Function/Benefit |
|---|---|
| LC-MS/MS System | High-sensitivity platform for profiling hundreds of metabolites from serum samples [83]. |
| DXA (Dual-Energy X-ray Absorptiometry) | Gold-standard method for measuring Bone Mineral Density (BMD) to define osteoporotic groups [83]. |
| CRISPR/Cas9 Knock-in Cell Lines | Allows for the study of endogenously tagged, low-abundance circadian clock proteins (e.g., PER2, CRY1) in live cells, providing high-resolution data on protein dynamics [86]. |
| Sandwich ELISA Kits | Ideal for the specific and quantitative measurement of target proteins like P1NP and β-CTx in a high-throughput manner [85]. |
| Validated Antibodies for Western Blot | Crucial for confirming the identity and molecular weight of target proteins in complex samples, and for validating other assays [85]. |
Signaling Pathways and Experimental Workflows
Circadian Clock Regulation of Metabolism
This diagram illustrates the hierarchical organization of the mammalian circadian system, showing how the central clock synchronizes peripheral metabolic tissues.
Biomarker Validation Workflow
This diagram outlines the key steps in validating a combined biomarker model, from initial sampling to final diagnostic application.
Technical Support Center
Troubleshooting Guides
Guide 1: Addressing Low-Amplitude Rhythms in Field-Collected Data
Problem: Hormonal rhythms appear dampened or inconsistent in real-world settings compared to laboratory findings.
Diagnosis & Solutions:
| Potential Cause | Diagnostic Steps | Corrective Actions |
|---|---|---|
| Circadian Misalignment | Assess participant sleep/wake times via actigraphy or diaries; check for social jetlag. | Standardize participant schedules for 3+ days pre-sampling; control light exposure [15]. |
| Insufficient Sampling Density | Analyze if sampling interval captures peak/trough transitions. | For circadian rhythms, sample at least every 2 hours; avoid 4-6 hour intervals [87]. |
| High Inter-individual Variability | Check for consistency in rhythm parameters across participants. | Increase sample size; use hybrid sampling designs; analyze individual trajectories [14] [82]. |
| Inconsistent Sample Handling | Audit sample collection time documentation and processing delays. | Implement strict SOPs; use time-stamped containers; train participants thoroughly [13]. |
Guide 2: Resolving Phase Estimation Inconsistencies
Problem: Calculated hormone acrophase (peak time) varies significantly between study replicates.
Diagnosis & Solutions:
| Potential Cause | Diagnostic Steps | Corrective Actions |
|---|---|---|
| Free-Running Rhythms | Check if participants were in constant conditions before sampling. | For endogenous clock studies, sample under constant routine conditions; for driven rhythms, note zeitgeber times [87]. |
| Aliasing from Sparse Sampling | Plot raw data to visualize if sampling misses true peaks. | Increase sampling frequency; for costly assays, use asymmetric sampling (denser at expected peak) [88] [14]. |
| Methodological Variability | Compare phase estimates from different algorithms (e.g., JTK_CYCLE vs. RAIN). | Use multiple analysis methods; validate with synthetic data; use TimeTrial for benchmarking [88]. |
Frequently Asked Questions (FAQs)
Q1: What is the minimum number of sampling days required to reliably detect a circadian hormone rhythm?
A: Collect data across at least two full circadian cycles (48 hours). Sampling over a single 24-hour period is highly sensitive to outliers and dramatically increases false-negative rates [87]. In studies where longer sampling is impossible, increasing biological replicates can partially offset this limitation.
Q2: How can I control for the effects of variable sleep patterns in field studies?
A: Implement a hybrid sampling design: combine longitudinal sampling (tracking individuals over multiple time points) with cross-sectional sampling (multiple participants). This controls for inter-individual differences while capturing population-level rhythms. Expressing data as a percentage of each individual's series mean can eliminate inter-individual baseline differences [14].
Q3: Our lab will use salivary biomarkers. How do we ensure RNA quality for gene expression studies of clock genes?
A: For optimal RNA yield and quality from saliva:
- Use a 1:1 ratio of saliva to RNAprotect preservative
- Collect 1.5 mL of saliva per sample
- Process samples immediately or freeze at -80°C This protocol yields sufficient quality RNA for quantifying core clock genes (ARNTL1, NR1D1, PER2) [82].
Q4: What wearable devices are best for monitoring circadian rhythms in ambulatory patients?
A: The table below compares two research-grade devices validated for circadian monitoring:
| Device | Key Circadian Features | Validated Outcomes | Limitations |
|---|---|---|---|
| Fibion Krono | Light exposure, skin temperature, posture, movement | DLMO estimation, TAP method, sleep patterns [89] | Newer device with fewer historical validation studies |
| ActiGraph LEAP | Heart rate, HRV, SpO2, movement | General activity and sleep monitoring [89] | No light sensor; requires subscription fees for advanced metrics |
Q5: Can I duplicate 24 hours of data to simulate a longer time series for analysis?
A: No. Never duplicate and concatenate data prior to statistical testing. This violates the independence of data points and dramatically increases false-positive rates. Statistical tests assume each data point is independent; duplication compromises this requirement [87].
Experimental Design Optimization
Sampling Scheme Recommendations
| Sampling Goal | Optimal Design | Minimal Design | Statistical Considerations |
|---|---|---|---|
| Rhythm Detection | 48+ hours, 2-hour intervals, 2 cycles [87] | 24 hours, 2-hour intervals, increased replicates [87] | Use multiple algorithms (JTK_CYCLE, RAIN); benchmark with TimeTrial [88] |
| Phase Estimation | 72 hours, 2-hour intervals, under constant conditions [87] | 48 hours, 2-hour intervals [87] | Sample consecutive days after releasing into constant conditions [87] |
| Amplitude Assessment | 48+ hours, 1-2 hour intervals, multiple replicates [87] | 48 hours, 2-hour intervals [87] | Increased temporal resolution more valuable than replicates for amplitude [87] |
Methodological Protocols
Protocol 1: Salivary Circadian Biomarker Collection
Application: Non-invasive assessment of circadian phase in human participants [82].
Workflow:
Protocol 2: Teriparatide Chronotherapy Trial Design
Application: Investigating timing effects on osteoporosis treatment efficacy [13].
Workflow:
The Scientist's Toolkit
Research Reagent Solutions
| Reagent/Kit | Application | Key Features | Implementation Notes |
|---|---|---|---|
| TimeTeller Kits [82] | Saliva-based clock gene expression | Analyzes ARNTL1, NR1D1, PER2; requires 3-4 samples/day over 2 days | Correlates with cortisol acrophase; optimal for outpatient studies |
| RNAprotect Saliva Reagent [82] | RNA preservation in saliva | 1:1 ratio with saliva; maintains RNA integrity | Enables room temperature storage during collection period |
| Fibion Krono Device [89] | Ambulatory circadian monitoring | Measures light, skin temperature, posture, movement | Validated for DLMO estimation; no subscription fees |
| TimeTrial Software [88] | Experimental design benchmarking | Tests JTK_CYCLE, ARSER, RAIN, BooteJTK algorithms | Simulates custom sampling schemes with synthetic data |
This technical support center provides troubleshooting guides and FAQs for researchers using consumer wearables and mobile health applications in studies focused on circadian rhythm and hormone fluctuation.
Troubleshooting Guides
Guide 1: Resolving Device Connectivity and Pairing Issues
Problem: Wearable device frequently disconnects from the research smartphone or fails to pair with the data collection app.
| Troubleshooting Step | Specific Instructions | Underlying Rationale for Research Context |
|---|---|---|
| Confirm Location Permissions | On the phone, grant the companion app (e.g., Huawei Health, Samsung Health) "Always" location access. On Android, also enable Wi-Fi and Bluetooth scanning in location settings [90] [91]. | Bluetooth pairing on many platforms requires location services to be active. This ensures continuous data syncing. |
| Protect App in Background | Add the companion app to the phone's "protected" or "don't optimize" battery list. On iOS, avoid manually closing the app [90]. | Prevents the OS from suspending the app, which disrupts continuous data collection and causes gaps in circadian time-series data. |
| Remove Old Pairings | In the phone's system Bluetooth settings, delete any previous pairings of the wearable. Also, ensure the wearable is not paired with any other phone [91]. | Prevents conflicts and connection instability that can arise from multiple pairing records. |
| Reset Network Settings | As a last resort, perform a "Reset Network Settings" on the research phone (will erase all Bluetooth and Wi-Fi connections) [91]. | Clears system-level network corruption that can prevent a stable connection, without deleting user data. |
Guide 2: Addressing Inconsistent or Inaccurate Physiological Data
Problem: Recorded data for metrics like sleep, heart rate, or activity shows unexpected drops, noise, or seems physiologically implausible.
| Troubleshooting Step | Specific Instructions | Underlying Rationale for Research Context |
|---|---|---|
| Verify Device Placement & Fit | Ensure the wearable is worn snugly and consistently on the wrist according to the manufacturer's instructions [92]. | A loose fit can cause motion artifacts and unreliable photoplethysmography (PPG) readings for heart rate [93]. |
| Confirm Sensor Hygiene | Clean the sensors on the back of the device regularly with a soft, dry cloth [92]. | Dirt, sweat, or debris can obstruct optical sensors, leading to inaccurate readings. |
| Check for Known Software Issues | Ensure the wearable's firmware and companion app are updated to the latest versions [94] [95]. | Manufacturers frequently release updates to improve sensor algorithm accuracy and fix bugs. |
| Cross-Validate with Research-Grade Tools | Periodically collect a subset of data using a research-grade actigraph or conduct a PSG validation session [93] [96]. | Essential for establishing the validity and limits of agreement of consumer-grade devices in your specific study population. |
Frequently Asked Questions (FAQs)
Q1: Our study participants are experiencing rapid battery drain on their devices. What steps can we take?
Battery life is critical for multi-day circadian studies. Implement the following protocol for participants:
- Disable Non-Essential Features: Turn off the "Always-On" display, reduce screen timeout, and disable LTE on cellular models if not needed [94].
- Optimize Sensing Frequency: In the device's health settings, reduce the frequency of continuous heart rate monitoring if your research protocol allows (e.g., from 'continuous' to 'every 10 minutes') [94].
- Manage Notifications: Limit app notifications to only the most essential ones to minimize screen activations [94].
- Use Stock Watch Faces: Recommend participants use first-party, simple watch faces, as complex third-party ones can be poorly optimized and drain the battery [94].
Q2: We are getting error messages that a health monitoring app is "not available in your current location." What does this mean?
This is typically a regional licensing and regulatory restriction, not a true GPS error. The app's functionality (e.g., sleep apnea detection) may only be approved for use in specific countries [97] [94].
- Solution: Verify that the research smartphones and wearables were purchased in the same region where the study is being conducted. If devices were sourced internationally, certain advanced features will be unavailable [97].
Q3: How reliable is sleep-stage data (Light, Deep, REM) from consumer wearables for circadian phase estimation?
Consumer wearables show promise but have important limitations compared to polysomnography (PSG).
- High Sensitivity, Low Specificity: These devices are generally good at detecting sleep (high sensitivity, ~95%) but are less accurate at distinguishing wakefulness and specific sleep stages (low specificity, ~60%) [93]. They often overestimate total sleep time.
- Use for Rhythm Analysis, Not Absolute Values: The sleep/wake patterns they generate over multiple days are robust for analyzing circadian rhythm stability, fragmentation, and timing (phase) [96] [98]. However, the absolute values for specific sleep stages should be interpreted with caution.
Q4: What are the best practices for ensuring consistent data collection across a large cohort in a longitudinal study?
Standardization is key to data quality.
- Provide Clear Participant Protocols: Give participants written instructions on device charging, wearing, and basic troubleshooting.
- Use a Unified Data Platform: Utilize open-source or commercial platforms that normalize data from different wearable brands (e.g., Apple, Garmin, Fitbit) into a single, consistent schema [99]. This simplifies data analysis.
- Implement Automated Data Checks: Set up systems to flag participants with missing data, unusually low activity, or irregular wear-time, allowing for proactive follow-up.
Experimental Protocols & Methodologies
Table 1: Wearable Data Metrics for Circadian Rhythm Analysis
The following table summarizes key data streams from wearables that can serve as proxies for circadian rhythms, as used in recent research [93] [96] [98].
| Metric | Data Source | Description | Use in Circadian Analysis |
|---|---|---|---|
| Rest-Activity Patterns | Accelerometer | Time-stamped activity counts and periods of rest. | Primary input for non-parametric circadian analysis (e.g., IV, IS). Strong marker of the central pacemaker's output [96]. |
| Skin Temperature | Thermistor | 24-hour fluctuation of wrist skin temperature. | Rhythm is nearly in antiphase with core body temperature. A decline in the evening is necessary for sleep onset [96]. |
| Heart Rate (HR) & Heart Rate Variability (HRV) | Photoplethysmography (PPG) | Pulse rate and the variation in time between heartbeats. | Circadian variation in HR and parasympathetic activity (via HRV) can indicate phase and rhythm amplitude [93]. |
| Light Exposure | Ambient Light Sensor | Timing, intensity, and spectral composition of ambient light. | The primary zeitgeber. Critical for assessing phase alignment with the environment and understanding phase shifts [96]. |
Protocol: 7-Day Accelerometry for Circadian Biomarker Calculation
This protocol is adapted from large-scale studies that derived the "CosinorAge" digital biomarker of aging from wearable data [98].
Objective: To collect sufficient data for reliable calculation of circadian parameters like acrophase (peak time), amplitude, and MESOR (Midline Estimating Statistic of Rhythm) using a cosinor model.
Procedure:
- Device Deployment: Provide participants with a consumer wearable (e.g., Actigraph, Apple Watch, Garmin) configured for research purposes.
- Wear-Time Instruction: Instruct participants to wear the device continuously for a minimum of 7 consecutive days and nights, removing it only for charging. Charging should be done at a consistent time of day when the participant is sedentary.
- Data Export: After the 7-day period, extract minute-level or higher-resolution data for acceleration (all axes) and timestamps.
- Preprocessing: Perform data quality checks for wear-time validation using standard algorithms (e.g., Troiano or Choi algorithms).
- Analysis: Fit a 24-hour cosine curve to the activity data using cosinor analysis to derive the circadian parameters. This can be extended to analyze the stability of these parameters over multiple cycles [96] [98].
The Scientist's Toolkit
Table 2: Key Reagents & Solutions for Circadian Wearable Research
| Item | Function in Research |
|---|---|
| Research-Grade Actigraph | A scientifically validated device that provides direct access to raw accelerometer data and uses transparent, published algorithms for sleep/wake classification. Serves as a validation benchmark [93] [96]. |
| Polysomnography (PSG) System | The gold-standard method for sleep staging. Used for validating sleep-related metrics derived from consumer wearables in a subset of the study population [93]. |
| Salivary Melatonin Collection Kit | Used to measure Dim Light Melatonin Onset (DLMO), the gold-standard marker for circadian phase. Wearable data (e.g., activity, skin temperature) can be correlated with DLMO to validate phase estimates [93]. |
| Unified Wearable Data API | A software platform that integrates data from various consumer wearables (Apple HealthKit, Garmin, Fitbit) and normalizes it into a single, consistent data schema, simplifying analysis for large cohorts [99]. |
| Cosinor Analysis Software | Specialized software (e.g., R package cosinor) used to fit periodic functions to time-series data, enabling the quantification of circadian phase, amplitude, and MESOR [96] [98]. |
Workflow and Relationship Diagrams
Circadian Research Workflow
Wearable Data Validation
Conclusion
Optimizing sampling timing for circadian hormone fluctuations is a critical, multi-faceted endeavor that bridges fundamental biology and clinical application. A successful strategy requires a deep understanding of the molecular clock, the application of sophisticated statistical and computational tools for experimental design, and a personalized approach that accounts for significant inter-individual variability. Future directions point towards the integration of continuous physiological monitoring via wearables, the refinement of mechanism-based mathematical models for real-time prediction, and the development of dynamic, personalized intervention systems. Embracing these chronobiological principles will undoubtedly lead to more accurate diagnostics, more effective and safer hormone therapies, and a new paradigm of circadian-informed medicine.
References
- 1. - Wikipedia Suprachiasmatic nucleus [https://en.wikipedia.org/wiki/Suprachiasmatic_nucleus]
- 2. Neuroanatomy, Nucleus Suprachiasmatic - StatPearls - NCBI Bookshelf [https://www.ncbi.nlm.nih.gov/books/NBK546664/]
- 3. Circadian Rhythms and Hormonal Homeostasis: Pathophysiological Implications - PMC [https://pmc.ncbi.nlm.nih.gov/articles/PMC5372003/]
- 4. : the brain's circadian clock Suprachiasmatic nucleus [https://pubmed.ncbi.nlm.nih.gov/10548871/]
- 5. Healthspan Research Review | Circadian Rhythm Synchronization as a Strategy for Enhancing Healthspan and Preventing Metabolic Disorders [https://gethealthspan.com/science/article/circadian-rhythm-healthspan-metabolic-optimization]
- 6. Frontiers | Synchronization of Biological Clock Neurons by Light and... [https://www.frontiersin.org/journals/neurology/articles/10.3389/fneur.2015.00128/full]
- 7. VIP Neurons Are Essential for Normal Light-Mediated Resetting of... SCN [https://pubmed.ncbi.nlm.nih.gov/30082421/]
- 8. Transcriptional architecture of the mammalian circadian - PMC clock [https://pmc.ncbi.nlm.nih.gov/articles/PMC5501165/]
- 9. Circadian Clock Genes and the Transcriptional Architecture of the Clock Mechanism - PMC [https://pmc.ncbi.nlm.nih.gov/articles/PMC6872945/]
- 10. Feedback Loops of the Mammalian Circadian Clock Constitute Repressilator - PMC [https://www.ncbi.nlm.nih.gov/pmc/articles/PMC5189953/]
- 11. Taking into account circadian rhythm when conducting experiments on animals - PMC [https://pmc.ncbi.nlm.nih.gov/articles/PMC4971888/]
- 12. Human circadian rhythm studies: Practical guidelines for inclusion/exclusion criteria and protocol - PMC [https://pmc.ncbi.nlm.nih.gov/articles/PMC9382328/]
- 13. of teriparatide dosing for postmenopausal... Timing optimization [https://josr-online.biomedcentral.com/articles/10.1186/s13018-025-06083-6]
- 14. Procedures for numerical analysis of circadian rhythms - PMC [https://pmc.ncbi.nlm.nih.gov/articles/PMC3663600/]
- 15. Matters: The Interplay between Early Mealtime, Timing ... Circadian [https://pmc.ncbi.nlm.nih.gov/articles/PMC10528427/]
- 16. Frontiers | Exercise, circadian rhythms, and muscle regeneration... [https://www.frontiersin.org/journals/neuroscience/articles/10.3389/fnins.2025.1633835/full]
- 17. Therapy With Optimizing Rhythms Hormone Circadian [https://www.medscape.com/viewarticle/optimizing-hormone-therapy-circadian-rhythms-2025a1000nnn]
- 18. Integrating Assessment of Circadian Rhythmicity to Improve Treatment Outcomes for Circadian Rhythm Sleep-Wake Disorders: Updates on New Treatments - PMC [https://pmc.ncbi.nlm.nih.gov/articles/PMC11832606/]
- 19. [PDF] Endogenous circadian regulation of female... | Semantic Scholar [https://www.semanticscholar.org/paper/Endogenous-circadian-regulation-of-female-hormones.-Rahman-Grant/b9e9cad42d2bd576032ffb323aa2a36a4f84b3e4]
- 20. Endocrine regulation of circadian rhythms | npj Biological Timing and... [https://www.nature.com/articles/s44323-025-00024-6?error=cookies_not_supported&code=c3dc03f0-b9ee-4cd0-bb06-76811c9556c7]
- 21. Interconnection between circadian clocks and thyroid function - PMC [https://pmc.ncbi.nlm.nih.gov/articles/PMC7288350/]
- 22. Mass spectrometry-based absolute quantification reveals rhythmic variation of mouse circadian clock proteins - PubMed [https://pubmed.ncbi.nlm.nih.gov/27247408/]
- 23. Time to Target the Circadian Clock for Drug Discovery - PMC [https://pmc.ncbi.nlm.nih.gov/articles/PMC9378619/]
- 24. Circadian rhythms in the three-dimensional genome: implications of chromatin interactions for cyclic transcription | Clinical Epigenetics | Full Text [https://clinicalepigeneticsjournal.biomedcentral.com/articles/10.1186/s13148-019-0677-2]
- 25. Synchronization as a Strategy for Enhancing... Circadian Rhythm [https://www.gethealthspan.com/research/article/circadian-rhythm-healthspan-metabolic-optimization]
- 26. Time Difference: When Your Circadian Rhythm Doesn’t Sync Up [https://my.clevelandclinic.org/health/diseases/12115-circadian-rhythm-disorders]
- 27. Circadian Rhythm Disruption | SKYbrary Aviation Safety [https://skybrary.aero/articles/circadian-rhythm-disruption]
- 28. Sleep and Optimizing Health in the NeuroICU - PMC Circadian [https://pmc.ncbi.nlm.nih.gov/articles/PMC9283559/]
- 29. Frontiers | TimeTeller for timing health: The potential of circadian medicine to improve performance, prevent disease and optimize treatment [https://www.frontiersin.org/journals/digital-health/articles/10.3389/fdgth.2023.1157654/full]
- 30. Circadian clocks and drug delivery systems: impact and opportunities in chronotherapeutics - PubMed [https://pubmed.ncbi.nlm.nih.gov/22097903/]
- 31. The clinical impact of chronopharmacology on current medicine [https://pubmed.ncbi.nlm.nih.gov/39792169/]
- 32. A Clinical Approach to Circadian Rhythm Sleep Disorders - PMC [https://pmc.ncbi.nlm.nih.gov/articles/PMC2679862/]
- 33. A Clinician’s Brief Guide to Chronotherapy for Affective Disorders | Psychiatric Times [https://www.psychiatrictimes.com/view/clinicians-brief-guide-chronotherapy-affective-disorders]
- 34. Optimization of experimental designs for biological rhythm discovery [https://journals.plos.org/ploscompbiol/article?id=10.1371/journal.pcbi.1013662]
- 35. On Weighted Trigonometric Regression for Suboptimal Designs in... [https://arxiv.org/html/2403.14452v1]
- 36. How to Fix Your Circadian Rhythm: 6 Easy Steps | Sleep Foundation [https://www.sleepfoundation.org/circadian-rhythm/can-you-change-your-circadian-rhythm]
- 37. : an Tempo for circadian unsupervised ... Bayesian algorithm phase [https://www.nature.com/articles/s41467-022-34185-w?error=cookies_not_supported&code=c7e0b111-2bc6-47a7-ab32-8c2493fec5ed]
- 38. Tempo: an unsupervised Bayesian algorithm for circadian phase inference in single-cell transcriptomics - PMC [https://pmc.ncbi.nlm.nih.gov/articles/PMC9630322/]
- 39. A classification approach to estimating human circadian phase under circadian alignment from actigraphy and photometry data - PMC [https://pmc.ncbi.nlm.nih.gov/articles/PMC8474125/]
- 40. Estimation methods for human circadian phase by use of peripheral tissues | Hypertension Research [https://www.nature.com/articles/hr201668]
- 41. Frontiers | Circadian clocks and their role in kidney and eye diseases... [https://www.frontiersin.org/journals/physiology/articles/10.3389/fphys.2025.1583502/full]
- 42. Phase advancing human circadian rhythms with morning bright light, afternoon melatonin, and gradually shifted sleep: can we reduce morning bright light duration? - PMC [https://pmc.ncbi.nlm.nih.gov/articles/PMC4344919/]
- 43. Effect of sampling time on estimates of thyroid-stimulating hormone, free thyroxine, and free triiodothyronine levels - PubMed [https://pubmed.ncbi.nlm.nih.gov/31526200/]
- 44. Does Time of Sampling or Food Intake Alter Thyroid Function Test? - PMC [https://www.ncbi.nlm.nih.gov/pmc/articles/PMC5434716/]
- 45. Frontiers | The therapeutic effect of glucocorticoids on type II... [https://www.frontiersin.org/journals/pharmacology/articles/10.3389/fphar.2022.900701/full]
- 46. Effects of glucocorticoid pulse therapy on thyroid function and... [https://pubmed.ncbi.nlm.nih.gov/33653401/]
- 47. Monitoring Glucocorticoid in CAH: Therapy , Timing , Timing Timing [https://www.patientcareonline.com/view/monitoring-glucocorticoid-therapy-in-cah-timing-timing-timing]
- 48. , Chronotype rhythm, and psychiatric disorders: Recent... circadian [https://pmc.ncbi.nlm.nih.gov/articles/PMC9399511/]
- 49. Assessing Chronotype : A Complex and Multifaceted Approach [https://www.chronobiologyinmedicine.org/journal/view.php?doi=10.33069/cim.2025.0003]
- 50. Hormonal Rhythms - an overview | ScienceDirect Topics [https://www.sciencedirect.com/topics/neuroscience/hormonal-rhythms]
- 51. The Impact of Sleep and Circadian Disturbance on Hormones and Metabolism - PMC [https://pmc.ncbi.nlm.nih.gov/articles/PMC4377487/]
- 52. Software [https://www.circadian.org/softwar.html]
- 53. Research tools | SRBR: Society for Research on Biological Rhythms [https://srbr.org/education-outreach/research-tools/]
- 54. - Long parenteral acting of hydrophilic drugs, proteins... formulations [https://pubmed.ncbi.nlm.nih.gov/39661312/]
- 55. Long-acting parenteral formulations of hydrophilic drugs, proteins, and peptide therapeutics: mechanisms, challenges, and therapeutic benefits with a focus on technologies - PMC [https://pmc.ncbi.nlm.nih.gov/articles/PMC11870889/]
- 56. FY2016 Regulatory Science Report: Long-Acting Injectable Formulations | FDA [https://www.fda.gov/industry/generic-drug-user-fee-amendments/fy2016-regulatory-science-report-long-acting-injectable-formulations]
- 57. FY2015 Regulatory Science Research Report: Long-Acting Injectable Formulations | FDA [https://www.fda.gov/industry/generic-drug-user-fee-amendments/fy2015-regulatory-science-research-report-long-acting-injectable-formulations]
- 58. Clinical translation of long - acting drug delivery formulations [https://www.nature.com/articles/s41578-021-00405-w?error=cookies_not_supported&code=442fe9f6-4a25-4b19-aac9-27d18e26ea87]
- 59. Troubleshooting Protocols - Biological Sciences: Summer Research Institute (SRI) - CMU LibGuides at Carnegie Mellon University [https://guides.library.cmu.edu/biologicalsciencesSRI/troubleshooting]
- 60. How to be a Better Troubleshooter in Your Laboratory | GoldBio [https://goldbio.com/articles/article/how-to-be-a-better-troubleshooter]
- 61. Quantitative Methods for the Analysis of Circadian and... | SpringerLink [https://link.springer.com/chapter/10.1007/978-94-009-8282-6_1]
- 62. Utilization of precision medicine digital for twins discovery in... drug [https://pmc.ncbi.nlm.nih.gov/articles/PMC12047495/]
- 63. and virtual trials: A new era in rare disease Digital ... twins drug [https://pharmaphorum.com/digital/digital-twins-and-virtual-trials-new-era-rare-disease-drug-development]
- 64. An Interpretable Digital Twin for Self-Aware Industrial Machines - PMC [https://pmc.ncbi.nlm.nih.gov/articles/PMC10780414/]
- 65. A Simple Quantum-inspired Particle and its... Swarm Optimization [https://scialert.net/fulltext/?doi=itj.2011.2315.2321]
- 66. Research on status monitoring and positioning compensation system for digital twin of parallel robots - PMC [https://pmc.ncbi.nlm.nih.gov/articles/PMC11876575/]
- 67. and cancers: the intrinsic links and therapeutic... Circadian rhythms [https://jhoonline.biomedcentral.com/articles/10.1186/s13045-022-01238-y]
- 68. Hybrid modeling-based digital twin for performance optimization with flexible operation in the direct air-cooling power unit - ScienceDirect [https://www.sciencedirect.com/science/article/abs/pii/S0360544222013950]
- 69. [2209.03062] Physics-based Digital Twins for Autonomous Thermal Food Processing: Efficient, Non-intrusive Reduced-order Modeling [https://arxiv.org/abs/2209.03062]
- 70. The Digital Twin Modelling of the Electrified Vehicle Based on A Hybrid Terminating Control of Particle Swarm Optimization - ScienceDirect [https://www.sciencedirect.com/science/article/pii/S2405896321016220]
- 71. Differentiating external zeitgeber impact on peripheral circadian clock resetting | Scientific Reports [https://www.nature.com/articles/s41598-019-56323-z]
- 72. Keeping an eye on circadian time in clinical research and medicine - PMC [https://pmc.ncbi.nlm.nih.gov/articles/PMC9790849/]
- 73. Dynamic lighting to facilitate circadian adaptation to shifted... schedules [https://pmc.ncbi.nlm.nih.gov/articles/PMC11316502/]
- 74. Using routinely collected clinical data for circadian medicine: A review of opportunities and challenges | PLOS Digital Health [https://journals.plos.org/digitalhealth/article?id=10.1371/journal.pdig.0000511]
- 75. Detecting Rhythms in Time Series with RAIN - PMC [https://www.ncbi.nlm.nih.gov/pmc/articles/PMC4266694/]
- 76. Improved Statistical Methods Enable Greater Sensitivity in Rhythm Detection for Genome-Wide Data - PMC [https://www.ncbi.nlm.nih.gov/pmc/articles/PMC4368642/]
- 77. Improved Statistical Methods Enable Greater Sensitivity in Rhythm ... [https://journals.plos.org/ploscompbiol/article?id=10.1371/journal.pcbi.1004094]
- 78. Methods detecting rhythmic gene expression are biologically relevant only for strong signal | PLOS Computational Biology [https://journals.plos.org/ploscompbiol/article?id=10.1371/journal.pcbi.1007666]
- 79. Different Methods to Estimate the Phase of Neural Rhythms Agree... [https://pmc.ncbi.nlm.nih.gov/articles/PMC10626504/]
- 80. A state space modeling approach to real-time phase | eLife estimation [https://elifesciences.org/articles/68803]
- 81. Tempo: an unsupervised Bayesian algorithm for circadian phase inference in single-cell transcriptomics | Nature Communications [https://www.nature.com/articles/s41467-022-34185-w]
- 82. Comprehensive integrative analysis of circadian rhythms in human saliva | npj Biological Timing and Sleep [https://www.nature.com/articles/s44323-025-00035-3]
- 83. Discovery of potential biomarkers for osteoporosis using LC-MS/MS... [https://pubmed.ncbi.nlm.nih.gov/30778642/]
- 84. Bone turnover and metabolite responses to exercise in people with and without long-duration type 1 diabetes: a case–control study - PMC [https://pmc.ncbi.nlm.nih.gov/articles/PMC7643495/]
- 85. ELISA vs Western Blot: When to Use Each Immunoassay Technique - Life in the Lab [https://www.thermofisher.com/blog/life-in-the-lab/western-blot-or-elisa/]
- 86. Live-cell imaging of circadian clock protein dynamics in CRISPR-generated knock-in cells | Nature Communications [https://www.nature.com/articles/s41467-021-24086-9]
- 87. Guidelines for Genome-Scale Analysis of Biological Rhythms - PMC [https://pmc.ncbi.nlm.nih.gov/articles/PMC5692188/]
- 88. TimeTrial: An Interactive Application for Optimizing the Design and Analysis of Transcriptomic Time-Series Data in Circadian Biology Research - PMC [https://pmc.ncbi.nlm.nih.gov/articles/PMC7534021/]
- 89. Best Circadian Rhythm Tracker 2025 : Fibion Krono vs. ActiGraph LEAP [https://web.fibion.com/articles/fibion-krono-vs-actigraph-leap-circadian-research/]
- 90. My HUAWEI wearable device and phone disconnect or cannot reconnect [https://consumer.huawei.com/ph/support/content/en-us00733911/]
- 91. My HUAWEI wearable device fails to link with the Huawei Health app... [https://consumer.huawei.com/en/support/content/en-us15868273/]
- 92. How to Troubleshoot Hardware Common with Issues ... Wearable [https://www.linkedin.com/advice/0/what-most-common-hardware-issues-wearable-technology-uaxgc]
- 93. Wearable Technology in Circadian Rhythm Research: From Monitoring to Clinical Insights [https://www.chronobiologyinmedicine.org/journal/view.php?number=196]
- 94. Samsung Galaxy Watch 7 and Ultra problems and how to fix them [https://www.androidauthority.com/galaxy-watch-7-problems-fixes-3464652/]
- 95. Samsung has admitted the error . If you are having problems Samsung... [https://samsungmagazine.eu/en/2025/03/04/pada-samsung-health/]
- 96. Wearables in Chronomedicine and Interpretation of Circadian Health - PMC [https://pmc.ncbi.nlm.nih.gov/articles/PMC11816745/]
- 97. Monitor not working (is not available in... - Samsung Members Health [https://r2.community.samsung.com/t5/Wearables/Health-Monitor-not-working-is-not-available-in-your-current/td-p/8588098/page/2]
- 98. Circadian rhythm analysis using wearable-based accelerometry as a digital biomarker of aging and healthspan | npj Digital Medicine [https://www.nature.com/articles/s41746-024-01111-x]
- 99. Integrating Wearable Technology Into Your Mobile App Health [https://www.themomentum.ai/blog/integrating-wearable-technology-into-your-mobile-health-app]