Beyond Counting Days: A Researcher's Guide to Valid Menstrual Cycle Phase Determination with Hormone Assays
Accurately determining menstrual cycle phase is critical for biomedical research, yet methodological inconsistencies and a reliance on estimation undermine data validity.
Beyond Counting Days: A Researcher's Guide to Valid Menstrual Cycle Phase Determination with Hormone Assays
Abstract
Accurately determining menstrual cycle phase is critical for biomedical research, yet methodological inconsistencies and a reliance on estimation undermine data validity. This article provides a comprehensive guide for researchers and drug development professionals on the application of hormone assays for precise phase determination. We cover the foundational endocrinology of the menstrual cycle, evaluate the validity and precision of salivary, urinary, and serum assays, and address common troubleshooting scenarios. Furthermore, we critically compare traditional methods against emerging technologies, including machine learning models using wearable data, and establish a framework for methodological validation. The goal is to equip scientists with the knowledge to implement rigorous, reproducible, and directly measured approaches to menstrual cycle research, thereby enhancing the quality of female-specific health research.
The Endocrinology of the Cycle: Establishing a Physiological Baseline for Phase Determination
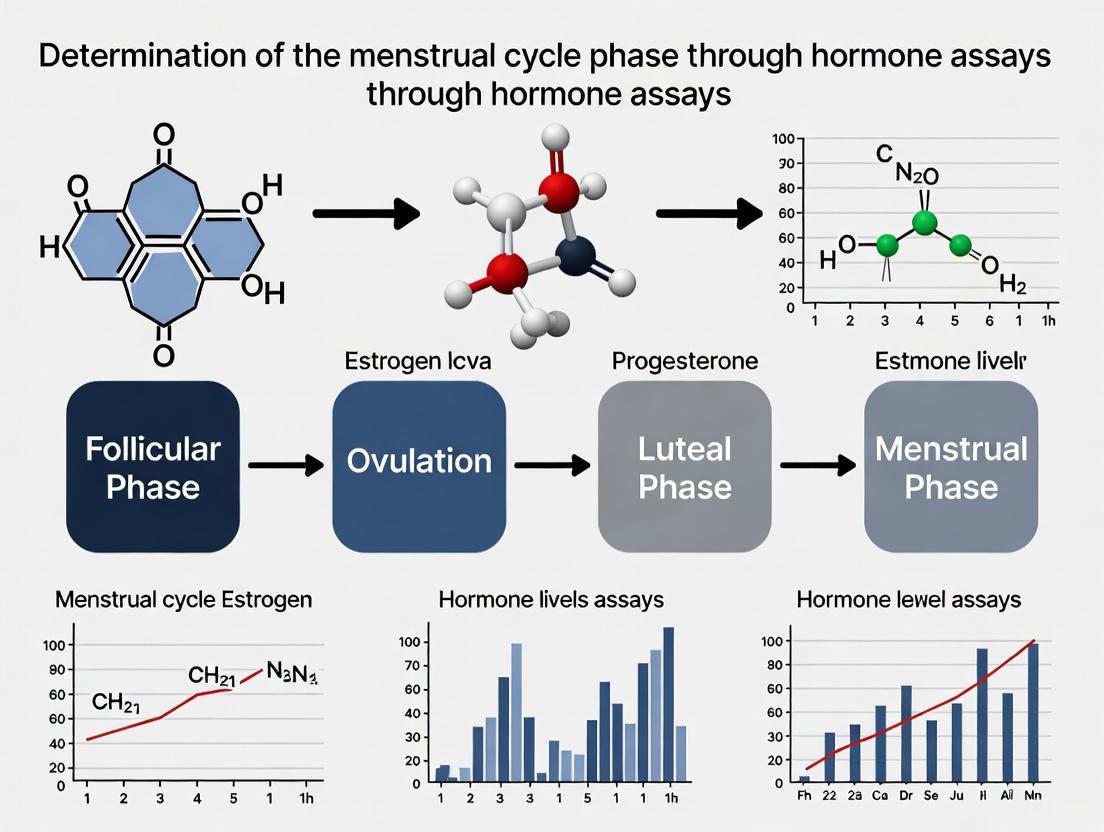
The menstrual cycle is a quintessential biological process characterized by predictable, coordinated fluctuations in key reproductive hormones that define its distinct follicular and luteal phases [1] [2]. This endocrinological sequence, driven by the hypothalamic-pituitary-ovarian (HPO) axis, prepares the body for potential pregnancy. The cycle begins with the first day of menstrual bleeding (cycle day 1) and ends the day before the next period begins [3] [4]. The average cycle length is 28 days, although healthy cycles can vary from 21 to 38 days [3]. The follicular phase encompasses the time from menses onset until ovulation, while the luteal phase spans from ovulation until the day before the subsequent menses [1]. The luteal phase demonstrates relatively consistent length across individuals (average 13.3 days, SD=2.1), whereas the follicular phase is more variable (average 15.7 days, SD=3.0), accounting for most variance in total cycle length [1]. Accurate delineation of these hormonally discrete phases is paramount for research on cycle-related phenomena, from physiological parameters to psychiatric symptoms in hormone-sensitive individuals [1].
Quantitative Hormonal Profiles Across Phases
Hormonal changes across the menstrual cycle are characterized by dynamic, non-linear fluctuations in estradiol (E2), progesterone (P4), luteinizing hormone (LH), and follicle-stimulating hormone (FSH). Table 1 summarizes the typical hormonal levels and key physiological events across the primary cycle phases.
Table 1: Hormonal and Physiological Characteristics of Menstrual Cycle Phases
| Cycle Phase | Approximate Cycle Days | Key Hormonal Profile | Dominant Physiological Events | Average Phase Length (Days) |
|---|---|---|---|---|
| Early-Mid Follicular | 1-10 | Low and stable E2, Low P4, Decreasing FSH | Endometrial shedding followed by proliferation; Recruitment of ovarian follicles | 10-16 days (variable) [2] |
| Late Follicular (Pre-Ovulatory) | 11-13 | Rapid E2 rise, LH surge initiation, Low P4 | Selection and dominance of a single follicle; Proliferation of endometrial lining | - |
| Ovulation | ~14 | Peak LH, E2 drop post-surge, Low P4 | Release of oocyte from dominant follicle | 1 day |
| Early-Mid Luteal | 15-26 | Rising then high P4, Secondary E2 peak | Corpus luteum formation; Secretory transformation of endometrium | 13.3 days (SD=2.1) [1] |
| Late Luteal (Perimenstrual) | 27-28 | Sharp decline in E2 and P4 | Corpus luteum regression; Initiation of endometrial breakdown | - |
The daily production rates of key sex steroids fluctuate significantly across the cycle, as detailed in Table 2.
Table 2: Daily Production Rates of Sex Steroids During Menstrual Cycle Phases
| Sex Steroid | Early Follicular | Preovulatory | Mid-Luteal |
|---|---|---|---|
| Progesterone (mg) | 1 | 4 | 25 |
| 17α-Hydroxyprogesterone (mg) | 0.5 | 4 | 4 |
| Androstenedione (mg) | 2.6 | 4.7 | 3.4 |
| Testosterone (µg) | 144 | 171 | 126 |
| Estrone (µg) | 50 | 350 | 250 |
| Estradiol (µg) | 36 | 380 | 250 |
Data adapted from Baird & Fraser (1974) via [2]
Recent research utilizing at-home quantitative hormone monitoring platforms has revealed significant individual variability in these hormonal patterns, challenging the traditional 28-day cycle model [5]. One study of 4,123 cycles found that follicular phase length declines with age while luteal phase length increases, demonstrating the importance of age-specific phase identification algorithms [5].
Experimental Protocols for Phase Determination
Gold-Standard Protocol for Ovulation Confirmation and Phase Delineation
Objective: To precisely identify ovulation and delineate follicular and luteal phases using a multi-modal approach combining hormonal assays, ultrasonography, and basal body temperature tracking.
Materials and Equipment:
- Quantitative urine hormone monitor (e.g., Mira monitor measuring LH, PdG) or serum assay capabilities [6]
- Endovaginal ultrasound machine with high-frequency transducer
- Basal body thermometer (digital preferred)
- Standardized daily symptom and bleeding tracker
- Serum collection tubes (red-top and EDTA) if performing serum assays
- Centrifuge for serum separation
- Freezer (-20°C or -80°C) for sample storage
Procedure:
- Participant Selection and Baseline Assessment:
- Recruit participants meeting inclusion criteria: regular menstrual cycles (24-38 days), age 18-45, not using hormonal contraception, and no known conditions affecting ovulation [6].
- Obtain informed consent and document medical history, including previous cycle characteristics.
- Collect baseline serum for Anti-Müllerian Hormone (AMH) to assess ovarian reserve [6].
Cycle Initiation and Daily Monitoring:
- Instruct participants to begin tracking on the first day of menstrual bleeding (Cycle Day 1).
- Collect daily first-morning urine samples for quantitative LH and pregnanediol-3-glucuronide (PdG) analysis [5].
- Measure and record basal body temperature immediately upon waking, before any physical activity.
- Track menstrual bleeding patterns and quality using a validated scale (e.g., Mansfield–Voda–Jorgensen Menstrual Bleeding Scale) [6].
Ultrasound Monitoring Schedule:
- Initiate follicular tracking via endovaginal ultrasound on Cycle Day 8-10.
- Measure and document dominant follicle growth every 1-2 days until follicle reaches approximately 16-18mm.
- Increase monitoring frequency to daily when dominant follicle reaches >16mm diameter.
- Document follicle collapse or disappearance, and appearance of free fluid in the pouch of Douglas, confirming ovulation [6].
Serum Hormone Correlation (Optional):
- Collect serum samples every 2-3 days throughout the cycle for E2, P4, LH, and FSH analysis.
- Time additional peri-ovulatory samples to capture the LH surge (every 12-24 hours around expected ovulation).
Data Integration and Phase Determination:
- Define ovulation day as the day prior to the consistent rise in basal body temperature, confirmed by follicle disappearance on ultrasound [6].
- Establish follicular phase as Cycle Day 1 through confirmed ovulation day.
- Establish luteal phase as the day after ovulation through the day before next menses.
- Correlate quantitative urine hormone values with serum levels and ultrasound findings to validate phase identification.
Protocol for Large-Scale Epidemiological Studies
Objective: To determine menstrual cycle phases using practical, scalable methods suitable for large cohort studies where frequent sampling or ultrasound confirmation is not feasible.
Materials and Equipment:
- Urine ovulation predictor kits (qualitative LH detection)
- Menstrual cycle tracking application or calendar
- Validated daily symptom questionnaire (e.g., Carolina Premenstrual Assessment Scoring System (C-PASS) for mood symptoms) [1]
Procedure:
- Cycle Tracking Initiation:
- Train participants to track menstrual bleeding start and end dates for at least two consecutive cycles.
- Instruct participants to use urine ovulation predictor kits daily from cycle day 10 until LH surge is detected.
- Document LH surge day as the first day of positive test result.
Phase Calculation:
- Define follicular phase as Cycle Day 1 through LH surge day.
- Estimate luteal phase as LH surge day +1 through day before next menses.
- For cycles without LH testing, use backward counting from menses onset assuming 14-day luteal phase (with acknowledgment of this limitation).
Statistical Adjustment:
- Incorporate age-based adjustments for phase length expectations (follicular phase shortens with age) [5].
- Use statistical models that account for within-person and between-person variability in phase length.
Visualization of Hormonal Dynamics and Experimental Workflow
Diagram 1: The hypothalamic-pituitary-ovarian axis and hormonal dynamics across menstrual cycle phases.
Diagram 2: Comprehensive experimental workflow for precise menstrual cycle phase determination.
Research Reagent Solutions for Hormone Monitoring
Table 3: Essential Research Reagents and Materials for Menstrual Cycle Phase Studies
| Reagent/Material | Function/Application | Key Characteristics | Example Use Cases |
|---|---|---|---|
| Quantitative Urine Hormone Monitor (e.g., Mira) | Simultaneously measures LH, PdG, E1G, FSH in urine | Quantitative results, smartphone connectivity, cloud data storage | At-home longitudinal monitoring, fertility window prediction [6] [5] |
| Urine LH Ovulation Kits (Qualitative) | Detects LH surge in urine | Qualitative (positive/negative), rapid result, cost-effective | Large epidemiological studies, initial cycle screening [4] |
| Enzyme Immunoassay Kits (Serum) | Quantitative measurement of E2, P4, LH, FSH in serum | High sensitivity and specificity, requires laboratory equipment | Gold-standard hormone correlation, validation studies [6] |
| Enzyme Immunoassay Kits (Urine) | Quantitative measurement of urinary hormone metabolites | Correlates with serum levels, non-invasive sampling | High-frequency sampling studies, pediatric/adolescent research [5] |
| Anti-Müllerian Hormone (AMH) Assay | Assess ovarian reserve, predict follicular phase length | Single measurement, cycle-independent | Participant stratification, reproductive aging studies [6] |
| Menstrual Cycle Tracking App with API | Digital symptom and bleeding pattern logging | Customizable tracking parameters, data export functionality | Real-world evidence generation, behavioral correlation studies [4] |
| Validated Daily Symptom Scales | Quantifies mood, physical symptoms (e.g., C-PASS) | Validated for cycle phase discrimination, DSM-5 aligned | PMDD/PME research, psychiatric symptom tracking [1] |
Data Analysis and Interpretation
Statistical Considerations for Phase-Based Analysis
When analyzing data across menstrual cycle phases, researchers must account for the inherent within-person correlation of repeated measures and the substantial between-person variability in hormonal patterns [1]. Multilevel modeling (random effects modeling) represents the gold-standard statistical approach, requiring at least three observations per person to estimate random effects of the cycle [1]. For reliable estimation of between-person differences in within-person changes across the cycle, three or more observations across two cycles provides greater confidence in reliability estimates [1].
Phase coding should be based on biologically confirmed ovulation rather than backward counting from mensus onset, as the latter approach misclassifies a substantial proportion of cycles [5]. When working with quantitative hormone data, researchers should establish participant-specific baselines rather than relying on population norms, as absolute hormone levels vary significantly between individuals [5].
Special Considerations for Clinical Populations
Research involving hormone-sensitive populations (e.g., Premenstrual Dysphoric Disorder) requires particular methodological rigor. The DSM-5 mandates prospective daily monitoring of symptoms for at least two consecutive menstrual cycles for PMDD diagnosis, as retrospective recall demonstrates poor convergence with actual symptom patterns [1]. Standardized scoring systems like the Carolina Premenstrual Assessment Scoring System (C-PASS) provide structured approaches for identifying cyclical mood disorders that might confound other research outcomes [1].
The accurate determination of menstrual cycle phase is a fundamental requirement in physiological, psychological, and pharmacological research involving premenopausal females. The dynamic interplay of ovarian hormones—particularly estradiol, progesterone, and luteinizing hormone (LH)—directly controls the cyclical preparation of the reproductive system and exerts significant effects on numerous other bodily systems, including the brain, cardiovascular system, and metabolism [7] [8]. Fluctuations in these hormones are not merely background variables; they are critical modulators of physiological and behavioral outcomes. Consequently, imprecise phase determination can introduce substantial error and obscure true biobehavioral relationships [8]. This document provides a detailed framework for researchers on the key hormonal milestones defining menstrual cycle phases and outlines robust assay protocols to enhance methodological rigor in studies involving cycling females.
The menstrual cycle is orchestrated by a complex feedback system, the Hypothalamic-Pituitary-Gonadal (HPG) axis, which precisely regulates hormone secretion to coordinate ovum development, ovulation, and endometrial preparation.
- Estradiol (E2): The most potent and primary form of estrogen during the reproductive years. Produced by the developing ovarian follicles, estradiol stimulates the proliferation and thickening of the endometrial lining, regulates the mid-cycle surge of LH, and supports a vast array of non-reproductive functions, including bone density maintenance and cognitive processes [7] [9].
- Progesterone: Primarily secreted by the corpus luteum after ovulation. Its main function is to transform the estrogen-primed endometrium into a receptive state for embryo implantation, characterized by increased vascularization and secretory activity. It also suppresses uterine contractions and prepares the breast tissue for lactation [10] [11] [12].
- Luteinizing Hormone (LH): A gonadotropin produced by the pituitary gland. LH stimulates estrogen production in the early cycle, but its most critical milestone is the LH surge, a sudden, massive increase in concentration that serves as the direct trigger for ovulation [13] [14] [2].
Table 1: Primary Functions and Sources of Key Menstrual Cycle Hormones
| Hormone | Primary Source in Reproductive Years | Core Reproductive Functions |
|---|---|---|
| Estradiol (E2) | Ovarian Follicles [7] | Endometrial proliferation, induction of LH surge, regulation of cervical mucus [7] [9] [2] |
| Progesterone (P4) | Corpus Luteum [10] [11] | Endometrial secretory transformation, suppression of myometrial contractions, inhibition of further ovulation [10] [12] |
| Luteinizing Hormone (LH) | Anterior Pituitary Gland [13] | Triggering of ovulation, stimulation of corpus luteum formation and progesterone production [13] [14] |
Quantitative Hormonal Profiles
Hormone levels fluctuate dramatically across the cycle. The following tables provide reference concentrations for key hormones in different sample matrices to aid in phase determination. Note that these values are guidelines and can vary between individuals and laboratories [9].
Table 2: Serum Hormone Reference Ranges Across Menstrual Cycle Phases
| Cycle Phase | Estradiol (E2) (pg/mL) | Progesterone (P4) (ng/mL) | LH (IU/L) |
|---|---|---|---|
| Early Follicular | 20 - 80 [9] | ~1 [2] | 1 - 12 [14] |
| Late Follicular (Pre-Ovulatory) | 200 - 500 [9] | ~4 [2] | 16 - 104 [14] |
| LH Surge (Ovulation) | Peak levels precede surge [2] | Rising | Sharp peak (>16 IU/L) [14] |
| Mid-Luteal | 60 - 200 [9] | >3 - 25 [2] [12] | 1 - 12 [14] |
Table 3: Salivary and Urinary Hormone Assessment
| Matrix | Analyte | Key Application & Notes |
|---|---|---|
| Saliva | Estradiol, Progesterone | Measures bioavailable (unbound) hormone fraction. Useful for frequent sampling but requires rigorous validation for phase detection [15]. |
| Urine | LH Metabolites | Used in ovulation predictor kits (OPKs). Detects the LH surge, indicating impending ovulation (within 24-48 hours) [14]. |
Experimental Protocols for Hormone Assay and Phase Determination
Accurate phase determination requires a methodologically sound approach. The following protocols outline best practices for serum-based hormone testing, which is considered the gold standard [15] [8].
Protocol: Serum-Based Hormone Assaying for Phase Determination
Objective: To determine menstrual cycle phase through the quantification of estradiol (E2), progesterone (P4), and luteinizing hormone (LH) in serum.
Materials:
- Sample Collection: Blood collection tubes (e.g., serum separator tubes), venipuncture kit, centrifuge.
- Reagent Kits: Validated, FDA-approved/CE-marked immunoassay kits for E2, P4, and LH.
- Equipment: Microplate reader or autoanalyzer, calibrated pipettes, -80°C freezer for sample storage.
Procedure:
- Participant Scheduling & Tracking: Schedule visits based on participant-reported menstrual cycle history. The backward calculation method (scheduling based on anticipated next menses) is generally more accurate than forward calculation from the last period [8]. Utilize cycle tracking software or diaries to record cycle length and regularity.
- Blood Collection & Processing: Collect blood via venipuncture. Allow blood to clot for 30 minutes, then centrifuge at 1000-2000 x g for 15 minutes. Aliquot the serum into cryovials and store at -80°C until analysis to prevent degradation.
- Hormone Immunoassay: a. Follow the manufacturer's protocol for the specific E2, P4, and LH kits precisely. b. Include all recommended standards, controls, and blanks in each assay run. c. Perform all measurements in duplicate to ensure reliability.
- Data Analysis: Calculate hormone concentrations against the standard curve. Report values in standard units (pg/mL for E2, ng/mL for P4, IU/L for LH).
- Phase Determination: Use the hormone concentrations in conjunction with the reference ranges in Table 2 to assign cycle phase, as detailed in Section 5.
Methodological Considerations and Validation
Relying solely on self-reported cycle day for phase projection is highly error-prone due to significant inter- and intra-individual variability in cycle length [8]. Serum hormone confirmation is strongly recommended.
- Limitations of Projection Methods: A 2023 study found that common projection methods resulted in phase misclassification, with Cohen’s kappa estimates indicating "disagreement to only moderate agreement" when compared to hormonally confirmed phases [8].
- Assay Validation: Ensure intra- and inter-assay coefficients of variation (CV) for your chosen method are within acceptable limits (typically <10-15% for intra-assay CV). Report these values in your methodology [15].
- Alternative Matrices: While salivary and urinary assays offer less invasiveness, their validity for precise phase detection is complex. Saliva reflects the bioavailable hormone fraction, and urine contains hormone metabolites, requiring distinct validation from serum standards [15].
Visualizing Hormonal Dynamics and Workflows
The following diagrams illustrate the temporal relationships between hormones and a logical workflow for phase determination.
Diagram 1: Hormonal Milestones During the Menstrual Cycle. The graph shows the fluctuating levels of Estradiol (E2), Progesterone (P4), and Luteinizing Hormone (LH) across the follicular, ovulatory, and luteal phases.
Diagram 2: Logic Flow for Menstrual Cycle Phase Determination. This workflow uses serum hormone levels to objectively assign the most probable menstrual cycle phase.
The Scientist's Toolkit: Research Reagent Solutions
Table 4: Essential Reagents and Materials for Hormonal Assays
| Item | Function/Application | Key Considerations |
|---|---|---|
| Serum Separator Tubes | Collection and preparation of serum for hormone analysis. | Ensure tube gel does not interfere with target analytes; validate recovery rates. |
| CLIA-Validated Immunoassay Kits | Quantification of E2, P4, and LH in serum. | Select kits with high sensitivity and specificity; verify dynamic range covers expected physiological levels. |
| Automated Immunoassay Analyzer | High-throughput, precise measurement of hormone concentrations. | Requires regular calibration and maintenance. Provides excellent reproducibility. |
| Salivary Hormone Collection Kit | Non-invasive collection of saliva for free hormone measurement. | Must include stimulant-free swabs and stabilizing buffer. Critical for frequent at-home sampling. |
| Urinary LH Dipstick (Ovulation Predictor Kit) | Semi-quantitative detection of the LH surge in urine. | Useful for timing ovulation in fertility studies; less precise for exact hormone quantification. |
The precise determination of menstrual cycle phase through the accurate assay of estradiol, progesterone, and LH is a critical component of rigorous research in female physiology. Moving beyond error-prone projection methods to hormonally-confirmed phase classification, as outlined in these application notes, will significantly enhance the validity and reproducibility of scientific findings. By adopting standardized protocols, understanding the quantitative hormonal milestones, and utilizing the appropriate research tools, scientists and drug development professionals can better elucidate the profound and cyclical influence of ovarian hormones on health and disease.
The menstrual cycle has traditionally been represented as a consistent 28-day model, with ovulation occurring precisely at mid-cycle. This paradigm persists in clinical guidelines, educational materials, and research methodologies. However, emerging evidence from large-scale data analyses challenges this oversimplification, revealing substantial variability in cycle characteristics both between individuals and within an individual's reproductive lifespan. Understanding this variability is crucial for researchers determining menstrual cycle phase in hormone assays research, as inaccurate phase determination can compromise study validity and lead to erroneous conclusions about hormone-behavior relationships [8].
This application note synthesizes current evidence on menstrual cycle variability and provides detailed protocols for incorporating these insights into rigorous research design. By moving beyond the 28-day paradigm, researchers can enhance the reliability and reproducibility of studies investigating biobehavioral correlates of ovarian hormone fluctuations [8].
Quantitative Evidence of Cycle Variability
Population-Level Variability
Table 1: Menstrual Cycle Characteristics from Large-Scale Studies
| Parameter | Study 1: Natural Cycles App [16] | Study 2: Clue App [17] | Traditional Paradigm |
|---|---|---|---|
| Number of Cycles | 612,613 | 4.9 million | N/A |
| Number of Participants | 124,648 | 378,000 | N/A |
| Mean Cycle Length (days) | 29.3 | 29.73 | 28 |
| Mean Follicular Phase Length (days) | 16.9 (95% CI: 10-30) | Not specified | 14 |
| Mean Luteal Phase Length (days) | 12.4 (95% CI: 7-17) | Not specified | 14 |
| Cycle Length Range (days) | 10-90 (with <1% >50 days) | Not specified | 25-30 |
Large-scale analyses of self-tracked menstrual cycle data reveal that the 28-day cycle represents only a minority of observed cycles. In a study of 612,613 ovulatory cycles, only 13% (81,605 cycles) were exactly 28 days long [16]. These 28-day cycles demonstrated considerable phase variability themselves, with mean follicular and luteal phase lengths of 15.4 and 12.6 days, respectively - neither conforming to the expected 14-day duration [16].
Age-Related and Individual Variability
Table 2: Factors Influencing Cycle Variability
| Factor | Effect on Cycle Characteristics | Magnitude of Effect | Data Source |
|---|---|---|---|
| Age (25-45 years) | Decrease in cycle length | -0.18 days per year (95% CI: 0.17-0.18) | [16] |
| Age (25-45 years) | Decrease in follicular phase length | -0.19 days per year (95% CI: 0.19-0.20) | [16] |
| Age (25-45 years) | Luteal phase length stability | No significant change | [16] |
| High BMI (>35) | Increased cycle length variability | +0.4 days or 14% higher variation | [16] |
| Inter-individual differences | Cycle length difference (CLD) | Median CLD of 9 days separates high and low variability groups | [17] |
Age significantly impacts cycle characteristics, with cycle length and follicular phase length decreasing progressively from ages 25 to 45, while luteal phase length remains stable [16]. The distinction between inter-individual (differences between people) and intra-individual (differences between cycles for the same person) variability is crucial. Research using the cycle length difference (CLD) metric - the absolute difference between subsequent cycle lengths - has identified that approximately 7.68% of users exhibit consistently high variability (median CLD ≥9 days) [17].
Methodological Limitations in Phase Determination
Accurate determination of menstrual cycle phase is methodologically challenging. Commonly used approaches have significant limitations that can introduce error into research findings [8]:
- Self-report projection methods ("count" methods) rely on predicting phase timing based on recalled cycle information and assume prototypical cycle characteristics.
- Ovarian hormone ranges utilize prescribed hormone value ranges from assay companies or small research samples of uncertain methodological quality.
- Limited hormone measurements infer phase from hormone changes between only two time points.
These error-prone methods result in phases being incorrectly determined for many participants, with Cohen's kappa estimates ranging from -0.13 to 0.53, indicating disagreement to only moderate agreement with more rigorous methods [8].
Experimental Protocols for Phase Determination
Protocol 1: Hormone-Assay Based Phase Determination
Objective: To accurately determine menstrual cycle phase through frequent hormone assays and statistical validation.
Materials:
- ELISA kits for estradiol and progesterone
- Blood collection equipment (venipuncture kits or lancets for capillary blood)
- Refrigerated centrifuge
- -80°C freezer for sample storage
- Statistical software (R, Python, or MATLAB)
Procedure:
- Participant Screening: Recruit participants with regular cycles (21-35 days) and no hormonal contraception, pregnancy, or endocrine disorders.
- Sample Collection: Collect blood samples every 2-3 days across a complete menstrual cycle, increasing frequency to daily around expected ovulation (days 10-16).
- Hormone Assay: Process samples using validated ELISA protocols for estradiol and progesterone. Include quality controls and duplicates.
- Data Analysis:
- Normalize hormone values to each participant's mean and standard deviation.
- Apply statistical algorithms to identify hormone surges and nadirs.
- Define phase boundaries based on hormone inflection points rather than calendar dates.
- Phase Assignment:
- Early Follicular: First day of menses until estradiol rise
- Late Follicular: Estradiol rise until luteinizing hormone (LH) peak
- Ovulation: LH peak ±1 day
- Luteal: Post-ovulation until next menses
Validation: Compare assay-determined phases with self-reported data and evaluate agreement using Cohen's kappa [8].
Protocol 2: Multi-Modal Phase Determination with Wearable Devices
Objective: To classify menstrual cycle phases using physiological signals from wearable devices.
Materials:
- Wrist-worn wearable devices (measuring skin temperature, heart rate, heart rate variability, electrodermal activity)
- Mobile app for data collection and user input
- Machine learning infrastructure (Python with scikit-learn or similar)
Procedure:
- Device Setup: Distribute wearable devices to participants and ensure proper fit and continuous wear, especially during sleep.
- Data Collection: Collect physiological signals continuously across multiple cycles. Supplement with user-reported menstruation start dates.
- Feature Extraction:
- Fixed Window Approach: Extract features from non-overlapping windows corresponding to reference phase definitions.
- Rolling Window Approach: Use sliding windows for daily phase classification.
- Model Training:
- Implement random forest classifiers with leave-last-cycle-out cross-validation.
- Train separate models for 3-phase (menstruation, ovulation, luteal) and 4-phase (add follicular) classification.
- Validation:
- Compare classification results with urinary luteinizing hormone tests for ovulation confirmation.
- Assess model performance using accuracy, precision, recall, and AUC-ROC metrics [18].
Expected Outcomes: Random forest models can achieve 87% accuracy for 3-phase classification and 71% accuracy for 4-phase classification using fixed window approaches [18].
Figure 1: Experimental Workflow for Menstrual Cycle Phase Determination
The Scientist's Toolkit: Research Reagent Solutions
Table 3: Essential Materials for Menstrual Cycle Phase Research
| Item | Function | Application Notes |
|---|---|---|
| ELISA Kits (Estradiol, Progesterone) | Quantify hormone concentrations in serum, plasma, or saliva | Validate for intended sample matrix; check cross-reactivity with similar hormones |
| Urinary LH Tests | Detect luteinizing hormone surge predicting ovulation | Use for algorithm validation; not suitable alone for phase determination |
| Wrist-worn Wearable Devices | Continuous monitoring of skin temperature, HR, HRV, EDA | Ensure research-grade sensors; consider form factor for extended wear |
| Basal Body Temperature (BBT) Sensors | Detect post-ovulatory temperature rise | More reliable with vaginal sensors (99% ovulation detection accuracy) |
| Mobile Health Applications | Collect self-reported symptoms and cycle tracking data | Leverage large existing datasets (e.g., 4.9M cycles) for validation |
| Machine Learning Algorithms | Classify phases from multi-modal data | Random forest effective (87% accuracy for 3-phase classification) |
Implications for Research Design
The documented variability in menstrual cycles has significant implications for research design in studies involving participants with menstrual cycles:
- Sample Size Considerations: Account for expected variability by increasing sample sizes or implementing repeated measures designs.
- Phase Verification: Replace projection methods with direct hormone measurement or validated multi-modal approaches.
- Individualized Analysis: Consider within-subject variability as a variable of interest rather than noise.
- Cycle Exclusion Criteria: Establish clear, evidence-based criteria for cycle exclusion based on hormone patterns rather than length alone.
Figure 2: Paradigm Shift in Menstrual Cycle Research
The 28-day menstrual cycle is a historical oversimplification that does not reflect biological reality for most individuals. Large-scale data analyses reveal substantial inter- and intra-individual variability in cycle length and phase characteristics. Research methodologies must evolve beyond error-prone projection methods and incorporate more rigorous, multi-modal approaches for phase determination. By adopting the protocols and considerations outlined in this application note, researchers can enhance the validity and reproducibility of studies investigating the complex relationships between ovarian hormones, behavior, and health outcomes.
Eumenorrhea, defined by predictable menstrual cycles typically occurring every 25 to 35 days, is often assumed to indicate regular ovulation [19]. However, growing evidence demonstrates that the presence of regular menstrual bleeding does not guarantee that ovulation has occurred. Sporadic anovulation can occur in apparently regular cycles, with studies reporting prevalence rates from 3.7% to 18.6% in eumenorrheic women depending on the detection method used [20]. This discrepancy between cycle regularity and actual ovulatory status has profound implications for research involving menstrual cycle phases, drug development studies, and clinical trial design where hormonal status is a critical variable.
Accurate determination of ovulatory status requires moving beyond calendar-based predictions to direct hormonal assessment. Research indicates that common methodological approaches for determining menstrual cycle phase—including self-report "count" methods, limited hormone measurements, and application of standardized hormone ranges—are error-prone and may result in phase misclassification [8]. This application note provides detailed protocols and analytical frameworks for confirming ovulation and establishing precise hormonal profiles in research populations with regular menses.
Prevalence of Anovulatory Cycles
Table 1: Anovulation Prevalence in Eumenorrheic Women by Detection Method
| Detection Method | Hormones Assessed | Anovulation Prevalence | Citation |
|---|---|---|---|
| Serum Progesterone (>15 nmol/L) | Single mid-luteal progesterone | 3.7% | [19] |
| Serum Progesterone-Based Algorithms | Progesterone, LH | 5.5% - 12.8% | [20] |
| Urinary LH/E3G Algorithms | Luteinizing hormone, estrone-3-glucuronide | 3.4% - 18.6% | [20] |
| Composite SMD Assessment | Progesterone, LH | 46.4% (includes LPD) | [21] |
Subclinical Menstrual Disorders in Athletic Populations
Table 2: Energy Availability and Menstrual Function in Female Athletes
| Parameter | Eumenorrheic Group | SMD Group | p-value |
|---|---|---|---|
| Energy Availability (kcal/kg FFM/day) | 34.7 ± 6.8 | 30.2 ± 2.2 | 0.003 |
| Exercise Energy Expenditure (kcal) | 911.9 ± 252.8 | 1196.8 ± 212.1 | <0.001 |
| Luteal Phase Defect Prevalence | - | 33.9% | - |
| Anovulation Prevalence | - | 12.5% | - |
| Total SMD Prevalence | - | 46.4% | - |
Data presented as mean ± standard deviation. SMD = Subclinical Menstrual Disorders; LPD = Luteal Phase Defect. Source: [21]
Experimental Protocols for Ovulation Confirmation
Serum-Based Hormonal Assessment Protocol
Objective: To confirm ovulation and assess luteal function through serum hormone measurements.
Materials Required:
- Serum collection tubes (SST)
- Centrifuge
- Automated chemiluminescence immunoassay system (e.g., DPC Immulite 2000)
- Commercial assay kits for progesterone, estradiol, LH
- -80°C freezer for sample storage
Visit Scheduling: Schedule up to 8 clinic visits per cycle timed to:
- Visit 1: Cycle day 2 (menstruation)
- Visit 2: Mid-follicular phase
- Visits 3-5: Periovulatory phase (adjust based on fertility monitor indication)
- Visits 6-8: Early, mid, and late luteal phase [20]
Sample Processing:
- Collect fasting morning blood samples (8 mL)
- Centrifuge at 1500 × g for 15 minutes
- Aliquot serum into cryovials
- Store at -80°C until batch analysis
- Analyze complete participant cycles together to minimize inter-assay variability [20]
Algorithm Application for Ovulation Detection:
Urinary Hormone Metabolite Assessment Protocol
Objective: To identify ovulation and assess cycle function through urinary hormone metabolites.
Materials Required:
- Fertility monitor (e.g., Clearblue Easy Fertility Monitor)
- Test sticks for LH and estrone-3-glucuronide (E3G)
- Data card reader for hormone level download
- Urine collection cups
- Automated particle chemiluminescence immune analyzer (for validation) [20]
Procedure:
- Participants synchronize fertility monitor with their cycle start day
- Begin daily first-morning urine testing between cycle days 6-9
- Submerge test stick in urine briefly, then insert into monitor
- Monitor assigns fertility status (low, high, peak) based on E3G and LH levels
- Record results and download stored hormone values from internal computer chip [20]
Luteal Phase Defect Identification:
- Following detected LH surge, calculate mid-luteal phase day
- Collect fasting blood sample on calculated mid-luteal day
- Analyze serum progesterone concentration
- Define luteal phase defect as progesterone <5.12 ng/mL [21]
Research Reagent Solutions
Table 3: Essential Research Reagents for Menstrual Cycle Hormone Assessment
| Reagent/Kit | Manufacturer | Application | Key Features |
|---|---|---|---|
| IMMUNLITE 2000 Solid Phase Chemiluminescent Enzymatic Immunoassay | Siemens Medical Solutions | Serum hormone analysis (E2, P4, LH, FSH) | High sensitivity, automated platform |
| Diagnostic Kit for Luteinizing Hormone Colloidal Gold | ACON Biotech | Urinary LH surge detection | Qualitative results, visual readout |
| Clearblue Easy Fertility Monitor Test Sticks | Inverness Medical | Urinary E3G and LH monitoring | Dual hormone detection, quantitative data storage |
| Automated Particle Chemiluminescence Immune Analyzer | Beckman Coulter | Serum progesterone validation | High precision, quantitative results |
Methodological Considerations for Research
Limitations of Current Methodologies
The search for optimal ovulation detection methods must acknowledge significant methodological challenges:
Phase Determination Errors: Common practices such as forward calculation from menses (assuming a 28-day cycle) or backward calculation from next menses yield high misclassification rates. Studies demonstrate Cohen's kappa values ranging from -0.13 to 0.53, indicating poor to moderate agreement with hormonally confirmed phases [8].
Hormone Assessment Challenges: Salivary and urinary hormone testing, while feasible for field studies, present validity concerns. Salivary assays measure bioavailable hormone fractions, while urinary tests detect hormone metabolites, creating interpretation complexities. A scoping review notes inconsistencies in definitions and reported hormone values, making cross-study comparisons difficult [15].
Emerging Methodologies
Machine Learning Approaches: Recent developments incorporate circadian rhythm-based heart rate monitoring (minHR) with machine learning (XGBoost) to classify menstrual cycle phases. This approach demonstrates particular utility for participants with high sleep timing variability, reducing ovulation detection errors by 2 days compared to basal body temperature methods [22].
Integrated Assessment Protocols: Optimal ovulation confirmation requires multi-modal assessment:
- Temporal framework: Cycle day tracking with confirmation of subsequent menses
- Hormonal confirmation: Serum progesterone ≥3-5 ng/mL or urinary pregnanediol glucuronide rise
- Surge detection: Serum or urinary LH peak identification
- Follicular development: Ultrasonic monitoring (gold standard) when feasible [20]
Accurate determination of ovulatory status in eumenorrheic women requires moving beyond menstrual cycle regularity as a proxy for ovulation. Researchers must implement direct hormonal assessment protocols with understanding of the strengths and limitations of various detection algorithms. The integration of emerging technologies including machine learning approaches with traditional hormone assays promises enhanced classification accuracy while potentially reducing participant burden in longitudinal studies.
From Sample to Data: A Practical Guide to Hormone Assay Methodologies
Accurate assessment of menstrual cycle phase is fundamental to both clinical management of fertility disorders and research in women's reproductive health. The cyclical patterns of estradiol (E2), luteinizing hormone (LH), and progesterone are tightly controlled by the hypothalamic-pituitary-gonadal axis, making their measurement crucial for characterizing the natural menstrual cycle [23]. Substantial inter-individual and inter-cycle variation exists in serum hormone profiles, particularly in the timing, amplitude, and duration of the LH surge associated with ovulation [23]. While expected values for these hormones have been determined in urine, these may not accurately reflect serum profiles, which provide a more reliable means of classifying menstrual cycle phase and sub-phase [23]. Furthermore, the choice of analytical technique significantly impacts result reliability, as automated immunoassays demonstrate variable degrees of bias compared with more advanced methods [23] [24]. This application note establishes detailed, method-specific expected values and protocols for serum E2, LH, and progesterone measurement throughout the natural menstrual cycle to support robust research and clinical decision-making.
Method-Specific Reference Intervals for the Natural Menstrual Cycle
Established Reference Values for Cycle Phases and Sub-Phases
We present method-specific reference intervals for the Elecsys LH assay and new generation Elecsys Estradiol III and Progesterone III assays (cobas e 801 analyzer) derived from a multicenter study of 85 apparently healthy women aged 18–37 years with confirmed normo-ovulatory cycles [23]. Cycle length and day of ovulation were standardized to account for variance (24–35 days), resulting in a standardized cycle length of 29 days with the LH peak occurring at day 15 [23]. The following tables summarize the expected values for each hormone across main phases and sub-phases.
Table 1: Median Hormone Concentrations by Main Menstrual Cycle Phase
| Menstrual Cycle Phase | Analyte | Median | 5th Percentile (90% CI) | 95th Percentile (90% CI) |
|---|---|---|---|---|
| Follicular | E2 (pmol/L) | 198 | 114 (19.1–135) | 332 (322–637) |
| LH (IU/L) | 7.14 | 4.78 (3.17–5.04) | 13.2 (12.4–17.8) | |
| Progesterone (nmol/L) | 0.212 | 0.159 (0.159–0.616) | 0.616 (0.159–0.616) | |
| Ovulation | E2 (pmol/L) | 757 | 222 (98.5–283) | 1959 (1598–3338) |
| LH (IU/L) | 22.6 | 8.11 (6.37–10.1) | 72.7 (67.4–100) | |
| Progesterone (nmol/L) | 1.81 | 0.175 (0.175–13.2) | 13.2 (0.175–13.2) | |
| Luteal | E2 (pmol/L) | 412 | 222 (159–280) | 854 (760–1334) |
| LH (IU/L) | 6.24 | 2.73 (2.06–3.19) | 13.1 (12.2–15.4) | |
| Progesterone (nmol/L) | 28.8 | 13.1 (13.1–46.3) | 46.3 (13.1–46.3) |
Table 2: Median Hormone Concentrations by Menstrual Cycle Sub-Phase
| Cycle Phase | Sub-Phase | Analyte | Median | 5th Percentile (90% CI) | 95th Percentile (90% CI) |
|---|---|---|---|---|---|
| Follicular | Early | E2 (pmol/L) | 125 | 75.5 (18.4–78.5) | 231 (192–283) |
| LH (IU/L) | 6.41 | 3.12 (2.16–4.03) | 9.79 (9.19–12.4) | ||
| Intermediate | E2 (pmol/L) | 172 | 95.6 (19.1–114) | 294 (262–695) | |
| LH (IU/L) | 7.36 | 4.36 (3.01–4.59) | 13.2 (12.5–15.6) | ||
| Late | E2 (pmol/L) | 464 | 182 (84–215) | 858 (711–1337) | |
| LH (IU/L) | 8.52 | 5.12 (3.89–5.58) | 16.3 (15.2–26.5) | ||
| Ovulation | --- | E2 (pmol/L) | 817 | 222 (98.5–283) | 2212 (1598–3338) |
| LH (IU/L) | 24.0 | 7.66 (5.10–9.40) | 71.1 (65.4–100) | ||
| Luteal | Early | E2 (pmol/L) | 390 | 188 (163–218) | 658 (608–1394) |
| LH (IU/L) | 9.66 | 4.90 (1.96–4.98) | 16.1 (15.1–30.2) | ||
| Intermediate | E2 (pmol/L) | 505 | 244 (157–334) | 1123 (942–1538) | |
| LH (IU/L) | 5.36 | 1.96 (1.96–3.52) | 11.6 (10.7–13.2) | ||
| Late | E2 (pmol/L) | 396 | 111 (74.4–163) | 815 (703–908) | |
| LH (IU/L) | 3.66 | 1.47 (1.18–1.73) | 8.36 (7.57–9.79) |
Hormone Fluctuation Patterns and Physiological Significance
The data reveals characteristic fluctuation patterns for each hormone. Estradiol concentrations rise through the follicular phase, peak during ovulation, and maintain elevated levels during the luteal phase, though the highest median concentrations and greatest variability (IQR) occur during ovulation [23]. LH values are relatively stable during the follicular phase, surge dramatically at ovulation (median: 22.6 IU/L), and then decline to their lowest levels in the late luteal phase [23]. Progesterone remains low throughout the follicular phase and early ovulation, then rises substantially during the luteal phase, reaching a median concentration of 28.8 nmol/L, which supports the uterine lining for potential implantation [23] [13]. These method-specific profiles assist in identifying the precise hormonal milieu of each cycle phase, supporting diagnosis, monitoring, and treatment of fertility disorders.
Analytical Methodologies: Immunoassay vs. Mass Spectrometry
Technical Comparison of Assay Platforms
The two primary methodologies for steroid hormone quantification are automated immunoassays (AIAs) and liquid chromatography-tandem mass spectrometry (LC-MS/MS). Each platform presents distinct advantages and limitations that researchers must consider when designing studies.
Table 3: Comparison of Hormone Assay Methodologies
| Characteristic | Automated Immunoassays (AIAs) | Liquid Chromatography-Tandem Mass Spectrometry (LC-MS/MS) |
|---|---|---|
| Principle | Antibody-based binding to analyte [24] | Physical separation and mass-based detection [24] |
| Throughput | High [25] | High, but often lower than AIA [25] |
| Turnaround Time | Rapid [25] | Longer than AIA [25] |
| Cost | Lower cost per sample [25] | High instrumentation cost (>$600,000) and reagents [25] |
| Specificity | Suffers from cross-reactivity, especially for steroids [24] | High specificity and selectivity [25] [24] |
| Multiplexing | Separate assays for each hormone [24] | Simultaneous analysis of multiple steroids [25] [24] |
| Sample Volume | Higher volume required for multiple hormones [24] | Smaller sample volumes [24] |
| Matrix Effects | Susceptible to interference (e.g., binding proteins) [24] | Less susceptible to matrix interference [24] |
Method-Specific Performance and Bias
Substantial bias can occur between different assay methods. A 2024 comparison of AIA and LC-MS/MS for E2 and progesterone in rhesus macaques showed excellent overall agreement but identified specific biases: AIA overestimated E2 at concentrations >140 pg/ml and underestimated progesterone at concentrations >4 ng/ml compared to LC-MS/MS [25]. For testosterone, the disagreement was more pronounced, with AIA consistently underestimating concentrations relative to LC-MS/MS [25]. These findings emphasize that well-characterized AIAs are excellent tools for daily monitoring or single data points requiring fast turnaround, but LC-MS/MS is preferable when high specificity is critical or when AIAs are known to provide inaccurate estimations [25]. Furthermore, immunoassays can be influenced by binding protein concentrations (e.g., SHBG, TBG), potentially leading to incorrect conclusions in study populations with abnormal binding protein levels, such as pregnant women, oral contraceptive users, or critically ill patients [24].
Experimental Protocols for Serum Hormone Analysis
Standardized Protocol for Serum Collection and AIA Measurement
Protocol 1: Serum Hormone Profiling Across the Natural Menstrual Cycle
This protocol outlines the procedure for establishing method-specific reference intervals, as described in the foundational study [23].
- Study Population: Apparently healthy, normo-ovulatory women (aged 18-37 years) with a natural menstrual cycle length of 24-35 days, confirmed by a physician. Exclude participants with no evidence of an LH peak and/or low progesterone levels at the mid-luteal phase, indicative of deficient corpus luteum function [23].
- Sample Collection:
- Collect blood samples (10 mL whole blood per venipuncture) approximately three times per week for the duration of one complete menstrual cycle (between two consecutive menstrual bleedings).
- This typically yields 7–15 samples per participant [23].
- Centrifuge samples to separate serum and store appropriately pending analysis.
- Hormone Measurement:
- Utilize the automated immunoassay platforms and specific assays for which reference intervals are being established (e.g., Elecsys Estradiol III, Elecsys LH, and Elecsys Progesterone III immunoassays on a cobas e 801 analyzer) [23].
- Perform all assays according to the manufacturer's instructions, including system calibration.
- Data Analysis:
- Standardize individual cycle lengths and the day of ovulation to account for inter-individual variance. For example, standardize all cycles to 29 days with the LH peak (ovulation) at day 15 [23].
- Define cycle phases based on the LH surge and/or progesterone/E2 levels: Follicular, Ovulation, and Luteal.
- Further divide follicular and luteal phases into early, intermediate, and late sub-phases for finer resolution [23].
- Calculate median, 5th, and 95th percentile concentrations for each hormone in every phase and sub-phase.
Protocol for Method Comparison Studies
Protocol 2: Cross-Platform Validation (AIA vs. LC-MS/MS)
This protocol is adapted from studies comparing AIA and LC-MS/MS performance [25].
- Sample Selection: Use serum samples collected across the menstrual cycle to encompass the full physiological range of hormone concentrations. Alternatively, use banked serum samples stored at -80°C, noting the number of freeze-thaw cycles [25].
- Parallel Analysis:
- Analyze all samples using the established AIA platform (e.g., Roche cobas e411 or e801 analyzers with Elecsys reagent kits) [25].
- Analyze the same sample set using a validated LC-MS/MS method. The LC-MS/MS method should involve sample preparation (e.g., protein precipitation, liquid-liquid extraction) followed by chromatographic separation and mass spectrometric detection in multiple reaction monitoring (MRM) mode [25].
- Statistical Comparison:
- Use Passing-Bablok regression to assess agreement between methods, which is robust to specific types of error and does not assume a normal distribution of differences [25].
- Employ Bland-Altman plots to visualize the bias between methods across the concentration range and identify any systematic over- or underestimation [25].
- Define acceptable limits of agreement based on clinical or biological requirements.
The Scientist's Toolkit: Essential Research Reagents and Materials
Table 4: Key Research Reagent Solutions for Serum Hormone Testing
| Item | Function/Application | Example Products/Assays |
|---|---|---|
| Automated Immunoassay System | High-throughput, quantitative measurement of hormones in serum/plasma. | cobas e 411, cobas e 801 analyzers (Roche Diagnostics) [23] [25] |
| Electrochemiluminescence Immunoassays (ECLIA) | Specific reagent kits for hormone measurement on compatible analyzers. | Elecsys Estradiol III, Elecsys Progesterone III, Elecsys LH Assay (Roche) [23] [25] |
| LC-MS/MS Instrumentation | High-specificity analysis of single or multiple steroids; considered reference method. | Shimadzu-Nexera-LCMS-8060 system [25] |
| Certified Reference Standards | For LC-MS/MS method development, calibration, and quality control. | Cerilliant certified reference materials (e.g., E2, P4, T in acetonitrile) [25] |
| Stable Isotope-Labeled Internal Standards | Essential for correcting for matrix effects and recovery in LC-MS/MS. | Estradiol-d5 (E2-d5), Testosterone-13C3 (T-13C3) [25] |
| Quality Control (QC) Materials | Independent QC pools (independent of kit manufacturer) to monitor assay performance over time. | In-house prepared serum pools; commercial human serum QC materials [24] |
Visual Workflow: Hormone Dynamics and Analysis
The following diagram illustrates the integrated hypothalamic-pituitary-ovarian axis signaling and the corresponding serum hormone fluctuations across a standardized 29-day menstrual cycle.
Hormone Axis and Cycle Dynamics
This diagram integrates the endocrine signaling pathways with the resulting hormonal patterns, providing researchers with a visual reference for interpreting serum hormone measurements in the context of cycle phase. The distinct phases (Follicular, Ovulation, Luteal) are color-coded, and the trajectories of E2, LH, and progesterone are mapped to their physiological roles in follicular development, ovulation, and endometrial preparation [23] [13].
Reliable determination of menstrual cycle phase is contingent upon using method-specific reference intervals for serum E2, LH, and progesterone. The data and protocols presented here, utilizing the Elecsys immunoassays on a cobas e 801 platform, provide a robust framework for researchers and clinicians. The choice between AIA and LC-MS/MS must be deliberate, weighing the need for throughput and speed against the necessity for high specificity and accuracy, particularly at critical decision-making concentrations. Adherence to standardized protocols for sample collection, processing, and analysis, along with rigorous quality control, is paramount for generating reliable data that can accurately inform both clinical decision-making for women with fertility disorders and fundamental research in reproductive biology.
Within research aimed at determining menstrual cycle phase, the need for feasible, serial hormone measurement is paramount. While serum testing is the established gold standard, salivary hormone assays present a compelling, non-invasive alternative for tracking cyclical hormonal changes. This document assesses the validity and precision of salivary hormone testing and provides detailed protocols for its application in research on menstrual cycle phase determination, supporting a broader thesis on female endocrinology.
Saliva contains the bioavailable, unbound fraction of steroid hormones, which can more accurately reflect physiologically active concentrations available to tissues compared to total hormone levels measured in serum [26] [27]. This, combined with the non-invasive nature of collection, allows for frequent, stress-free sampling that is ideal for characterizing the dynamic fluctuations of the menstrual cycle [26].
Comparative Analysis: Saliva vs. Serum Hormone Testing
The table below summarizes the core technical and methodological differences between salivary and serum hormone testing, critical for designing research on menstrual cycle phases.
- Table 1: Comparison of Salivary and Serum Hormone Testing Methods
| Feature | Saliva Testing | Serum (Blood) Testing |
|---|---|---|
| Hormone Fraction Measured | Free, unbound (bioavailable) hormones [26] [27] | Total hormones (free + protein-bound) [26] |
| Clinical/Research Relevance | Reflects hormonally active fraction; can correlate more closely with tissue availability and symptoms [26] [27] | Gold standard for clinical diagnosis; does not differentiate between bound and free fractions [26] |
| Ideal For | Steroid hormones (Cortisol, Progesterone, Estradiol, Testosterone, DHEA) [26] | Thyroid hormones, Prolactin, Vitamin D [26] |
| Collection Method | Non-invasive, stress-free, participant self-collection at home [26] [28] | Invasive (venipuncture), requires clinical setting and phlebotomist [26] |
| Key Advantage for Cycle Tracking | Enables feasible, high-resolution, daily serial sampling to map hormonal fluctuations [26] | Single-point measurement; serial sampling for cycle tracking is logistically challenging and burdensome [29] |
| Key Limitation | Not accurate for sublingual hormone therapies; requires strict adherence to collection protocols [26] | Inconvenient for frequent sampling; the stress of collection can acutely alter levels of certain hormones (e.g., cortisol) [26] |
Assessing Validity and Precision
Evidence from recent studies supports the validity of salivary assays for menstrual cycle research, though precision requires careful methodological control.
- Table 2: Key Validity and Precision Metrics from Recent Research
| Hormone | Key Validity Finding | Method & Context | Precision Notes |
|---|---|---|---|
| Progesterone (P) | Strong positive correlation between salivary and serum concentrations (rm = 0.996, p < 0.0001) [28]. High Spearman's correlation (rho = 0.858) between salivary free P and serum total P [29]. | Automated Electrochemiluminescence Immunoassay [28]; Commercial Enzyme Immunoassays [29]. | The salivary/serum progesterone ratio (UF) differs between follicular (median 8.1%) and luteal (median 2.3%) phases, which must be accounted for in phase-specific analysis [29]. |
| Estradiol (E2) | Positive association between salivary and serum concentrations (rm = 0.705, p = 0.0507) [28]. | Automated Electrochemiluminescence Immunoassay [28]. | Further validation and development of salivary reference ranges are needed [28]. |
| Cortisol | Weak, non-significant association between salivary and serum concentrations (rm = 0.245, p = 0.526) in one study [28]. Salivary cortisol was significantly associated with metabolic biomarkers where serum cortisol was not [27]. | Automated Electrochemiluminescence Immunoassay [28]; Luminescence Immunoassays [27]. | Highlights that saliva and serum measure different physiological pools; salivary cortisol is a validated biomarker of bioavailable, active hormone [27]. |
A scoping review highlights that inconsistencies in menstrual phase definitions and a scarcity of reported hormone values can make comparisons between studies challenging [15]. A strength across many studies is the reporting of intra-assay coefficients, a key precision metric [15].
Experimental Protocol: Salivary Hormone Analysis for Menstrual Cycle Phase Determination
This protocol outlines the standardized methodology for using salivary assays to identify menstrual cycle phases.
Workflow Overview
Participant Recruitment and Screening
- Participants: Recruit healthy, premenopausal, naturally cycling women (e.g., aged 18-35). Obtain informed consent.
- Exclusion Criteria: Include smoking, chronic illness, use of hormonal contraception or medications affecting bone metabolism, poor oral hygiene, and pregnancy [30].
- Cycle Tracking: Participants should track their menstrual cycles daily using a validated app or calendar for at least one cycle prior to and during the study to aid in backward calculation of cycle day [28].
Sample Collection Protocol
- Kit Preparation: Provide each participant with a kit containing sterile 50 mL Falcon tubes for passive drooling, gloves, and a dedicated logsheet or barcode system [30].
- Timing: Collect samples upon waking, before eating, drinking, or brushing teeth to minimize contamination [26]. For cycle tracking, daily collection is ideal [26].
- Method: Use the passive drooling method. Participants should allow saliva to pool in the mouth and then expel it directly into the tube without stimulation. Collect approximately 5 mL of saliva [30].
- Frequency: Daily collection throughout one complete menstrual cycle is recommended to capture the estradiol surge and progesterone rise adequately.
Sample Handling and Storage
- Transport: Samples should be transported on ice or frozen cold packs if not processed immediately.
- Processing: Centrifuge samples at 4°C at 13,600 rpm for 20 minutes to separate aqueous layers from mucins and debris [30].
- Storage: Aliquot the top aqueous layer into 1.5 mL tubes and immediately store at -80°C until batch analysis [30]. Avoid repeated freeze-thaw cycles.
Laboratory Analysis
- Technology: Use highly sensitive and specific assays.
- Enzyme-Linked Immunosorbent Assay (ELISA): A common colorimetric method using competitive or sandwich techniques. Use commercial kits validated for saliva (e.g., from Enzo Life Sciences, Proteintech) [30].
- Electrochemiluminescence Immunoassay (ECLIA): An automated, highly sensitive method that shows promise for salivary progesterone and estradiol [28].
- Quality Control: Run all samples and standards in duplicate. Include internal controls and report intra- and inter-assay coefficients of variation (CV) to demonstrate precision [15].
Data Analysis and Cycle Phase Determination
- Data Correction: Use a log transformation if hormone data are not normally distributed [29].
- Phase Definition: Correlate hormonal data with participant-reported cycle days. Define phases using established criteria, for example:
- Early Follicular: Cycle day 3 ±1 day [15].
- Peri-Ovulatory: Day of luteinizing hormone (LH) surge in urine or serum, or a 3-day running mean of 20% increase in progesterone over the previous average [15].
- Mid-Luteal: Midpoint between ovulation and the onset of subsequent menses, or a specific number of days post-ovulation (e.g., ovulation +7 days) [15].
Decision Logic for Phase Assignment
The Scientist's Toolkit: Essential Research Reagents and Materials
The following table details key materials required for implementing salivary hormone assays in a research setting.
- Table 3: Essential Research Reagents and Materials
| Item | Function & Specification |
|---|---|
| Saliva Collection Aid | Sterile 50 mL Falcon tubes for passive drooling. Tubes should be free of contaminants that could interfere with immunoassays [30]. |
| Competitive ELISA Kits | For measuring steroid hormones (Progesterone, Estradiol, Cortisol, Testosterone). Must be validated for use with saliva and provide high sensitivity for low-concentration analytes [30]. |
| Sandwich ELISA Kits | For measuring protein hormones (e.g., Growth Hormone, LH). Kits like the AuthentiKine Human GH ELISA Kit are designed for this purpose [30]. |
| Automated Immunoassay Analyzer | Systems capable of running Electrochemiluminescence (ECLIA) or other automated immunoassays can enhance throughput, reproducibility, and reduce human error [28] [27]. |
| Low-Temperature Storage | -80°C freezer for long-term sample preservation. Maintaining a stable cold chain is critical for sample integrity [30]. |
| Laboratory Centrifuge | Refrigerated centrifuge capable of reaching 13,000+ rpm to properly clarify saliva samples prior to analysis [30]. |
Integrating salivary hormone data with other non-invasive measures, such as urinary luteinizing hormone (LH) tests [15] or wearable devices that track basal body temperature (BBT) and heart rate [31], can provide a more robust and multi-dimensional assessment of menstrual cycle phase. This is especially valuable in field settings or studies where frequent clinical visits are impractical.
In conclusion, salivary hormone assays are a valid and precise tool for determining menstrual cycle phase in research when implemented with strict methodological rigor. Their ability to measure bioavailable hormones and facilitate high-resolution, serial sampling offers a significant advantage over serum-based methods for within-participant monitoring over time. By adhering to standardized protocols for collection, analysis, and phase definition, researchers can reliably utilize this non-invasive technology to advance the study of female endocrinology.
Within the broader scope of determining menstrual cycle phase using hormone assays, the detection of the luteinizing hormone (LH) surge in urine serves as a critical, non-invasive methodological cornerstone. The LH surge, an abrupt release from the pituitary gland, typically precedes ovulation by approximately 24 to 36 hours, providing a vital hormonal signature for pinpointing the transition from the follicular to the luteal phase [32] [33]. In research settings, from clinical trials to drug development studies, accurately identifying this surge is paramount for phase determination, yet the methodologies employed vary significantly in their precision and reliability [34] [33].
Urinary LH detection offers a feasible alternative to serial serum sampling or transvaginal ultrasonography (the gold standard), balancing participant burden with methodological rigor [15] [32]. However, the validity of cycle phase determination hinges on the specific protocols adopted for surge identification and an awareness of inherent physiological and technical pitfalls. This document outlines standardized protocols, details common methodological errors, and provides guidance to enhance the accuracy and reproducibility of urinary LH surge detection in scientific research.
Physiological Basis and Methodological Landscape
The LH surge is initiated when rising estradiol from the dominant follicle exerts a positive feedback effect on the hypothalamic-pituitary axis [32]. This surge triggers the final maturation and release of the oocyte. In urine, this is detected as a rapid increase in LH concentration from baseline levels.
A scoping review of methodologies highlights significant complexities and a lack of consistency in how the LH surge is defined and detected across studies [15]. Research has identified that LH surges are not uniform; they can be categorized by their onset (rapid within one day, 42.9%; or gradual over 2-6 days, 57.1%) and their configuration (spiking 41.9%; biphasic 44.2%; plateau 13.9%) [32]. This inherent variability complicates the creation of a one-size-fits-all detection protocol.
A comparative analysis of 16 different methods for identifying the urinary LH surge, applied to 254 ovulatory cycles, concluded that the most reliable method for retrospective analysis involves a retrospective estimation of the surge day to identify the most appropriate baseline period [33]. The key differentiator among methods is how baseline LH levels are determined, which can be based on fixed cycle days, the peak LH day, or a provisional estimate of the surge itself [33].
Quantitative Performance of Urinary LH Detection
The performance of urinary LH testing is well-documented, though its accuracy is contingent upon the reference standard used and the population studied.
Table 1: Performance Metrics of Urinary LH Detection
| Metric | Performance | Context / Reference Standard |
|---|---|---|
| Timing of Ovulation | 20 ± 3 hours (95% CI 14-26) after positive test | Following positive urinary LH test to follicular rupture on sonography [32] |
| Sensitivity | 1.00 | In infertile women, for detecting ovulation [32] |
| Specificity | 0.25 | In infertile women, for detecting ovulation [32] |
| Accuracy | 0.97 | In infertile women, for detecting ovulation [32] |
| Predictive Value | Predicts ovulation within 48 hours | U.S. National Academy of Clinical Biochemistry Laboratory Medicine recommendation (Strength B, level II) [32] |
It is critical to note that a detected LH surge does not invariably confirm that ovulation has occurred. Conditions such as luteinized unruptured follicle syndrome (LUFS), reported in 10.7% of cycles in normally fertile women, and anovulatory cycles can lead to false positive surge interpretations [32]. Furthermore, a study on infertile women found premature LH surges that did not trigger ovulation in 46.8% of cycles [32]. Therefore, urinary LH detection is best utilized as a predictive, not confirmatory, tool for ovulation within a phase determination framework.
Detailed Experimental Protocols
This section provides a step-by-step guide for researchers implementing urinary LH surge detection, incorporating best practices from the literature.
Specimen Collection and Handling
- Collection Frequency: During the anticipated fertile window (typically from cycle day 10-11 onward), participants should collect first-morning void urine samples [33]. For prospective detection, testing once or twice daily is recommended to capture short-lived surges [35] [36].
- Collection Timing: For daily testing, consistent timing is key. While first-morning urine is often used for its concentration, some studies and kit manufacturers recommend testing between 10 a.m. and 8 p.m., as the LH surge often begins in the early morning and is detectable in urine a few hours later [35] [36].
- Handling and Storage: Participants should refrigerate samples immediately after collection. Upon return to the lab, samples should be aliquoted and frozen at -80°C to preserve analyte integrity until batch analysis [33].
- Pre-Analysis Considerations: Instruct participants to limit fluid intake for 1-2 hours prior to sample collection to avoid excessive urine dilution, which can lower LH concentration below the assay's detection threshold [35] [36].
Laboratory Analysis and Surge Identification
- Assay Selection: Choose a quantitative immunoassay (e.g., ELISA or automated platforms like AutoDELFIA) validated for urinary LH measurement. Note that assays detecting intact LH versus beta-core LH (LH-βc) can yield different peak days, with LH-βc assays peaking at least one day later [33].
- Batch Analysis: Analyze all samples from a single menstrual cycle on the same assay plate to minimize inter-assay variability [33].
- Determining Baseline LH: The optimal method for retrospective analysis involves calculating the mean and standard deviation (SD) of LH levels from a 4-5 day baseline period. This period should be identified retrospectively, typically using 2 days before the estimated surge day plus the previous 4-5 days [33].
- Defining the LH Surge Onset: The LH surge day is assigned as the first day of a sustained rise in LH concentration. A "sustained rise" is typically defined as an LH level that exceeds the mean baseline value by at least 2.5 times the standard deviation of the baseline [33].
Diagram 1: Workflow for LH Surge Detection & Confirmation.
Common Pitfalls and Troubleshooting
Even with a robust protocol, several factors can compromise the accuracy of phase determination via urinary LH.
Table 2: Common Pitfalls and Mitigation Strategies in Urinary LH Research
| Pitfall Category | Specific Issue | Recommended Mitigation Strategy |
|---|---|---|
| Specimen & Timing | Testing only once per day | Test twice daily (e.g., late morning and early evening) during the fertile window to capture short surges [35] [36]. |
| Diluted urine specimen | Limit fluid intake for 1-2 hours before sample collection; advise participants to avoid over-hydration [35] [36]. | |
| Physiological Variability | Anovulatory cycles / LUFS | Do not rely on LH surge alone to confirm ovulation. Incorporate a confirmatory test for elevated urinary pregnanediol glucuronide (PdG) in the mid-luteal phase [32] [37]. |
| Atypical surge patterns (e.g., biphasic, plateau) | Use a quantitative assay and a retrospective, threshold-based algorithm rather than visual inspection alone to define surge onset [33]. | |
| Assay Interference | Chemically similar hormones (hCG, FSH, TSH) causing cross-reactivity | Select an immunoassay specific for the beta-subunit of LH to minimize cross-reactivity with FSH, hCG, and TSH [37]. |
| Underlying conditions (e.g., PCOS) | Be cautious when including participants with PCOS, as they may have chronically elevated baseline LH, leading to false-positive surge interpretations or difficulty defining a baseline [37]. Pre-screen and consider alternative phase-determination methods. | |
| Data Interpretation | Misinterpreting a faint test line as positive | In qualitative test strips, a positive result requires the test line to be as dark as or darker than the control line. A faint line is negative [35] [36]. |
| Incorrect baseline calculation | Avoid using fixed cycle days for baseline calculation. Use a retrospective method that identifies low, stable LH values specific to each cycle [33]. |
Confirming Ovulation and Phase Determination
A positive urinary LH test is a predictor, not a confirmer, of ovulation. To accurately determine that the luteal phase has been initiated, a second hormonal marker is essential.
The recommended approach is to measure urinary pregnanediol glucuronide (PdG), a major metabolite of progesterone. A study demonstrated that PdG levels ≥5 μg/ml for three consecutive days in the mid-luteal phase confirmed ovulation with a sensitivity of 92.2% and specificity of 100% [32]. In a research context, this provides robust, objective confirmation that ovulation has likely occurred following the detected LH surge, thereby validating the luteal phase assignment.
Diagram 2: Hormonal Signatures for Cycle Phase Determination.
The Scientist's Toolkit: Research Reagent Solutions
Table 3: Essential Materials for Urinary LH and PdG Assay Research
| Item / Reagent | Function / Application | Key Considerations |
|---|---|---|
| Quantitative LH Immunoassay | Precise measurement of LH concentration in urine. | Select an assay specific for the intact LH molecule or its beta-subunit to minimize cross-reactivity. Verify sensitivity (e.g., ≤0.1 mIU/mL) and dynamic range suitable for urinary levels [33]. |
| PdG (Pregnanediol Glucuronide) Immunoassay | Confirmatory test for ovulation by measuring a progesterone metabolite. | Essential for validating luteal phase onset. A threshold of ≥5 μg/mL for 3 consecutive days is a validated criterion for confirming ovulation [32]. |
| Automated Immunoassay Platform (e.g., AutoDELFIA) | High-throughput, quantitative analysis of urinary hormones. | Reduces inter-assay variability; ideal for processing large batch samples from longitudinal studies. Ensures precision with intra- and inter-assay CVs typically <5% for LH and <10% for PdG [33]. |
| Urine Collection Pots with Preservative (e.g., Sodium Azide) | Stable preservation of hormone analytes in urine post-collection. | Maintains sample integrity during participant storage (refrigeration) and transport prior to deep-freezing in the lab [33]. |
| Qualitative LH Test Strips | For initial, low-cost feasibility studies or participant self-testing protocols. | Useful for prospective surge detection but prone to user interpretation errors. For research-grade data, quantitative assays are strongly preferred [35]. |
Determining menstrual cycle phase is a fundamental requirement in research involving female physiology, psychology, and therapeutic development. However, methodological challenges persist in accurately pinpointing phases, as common approaches like self-report calendar tracking or limited hormone measurements often misclassify cycles, potentially compromising research validity and drug development outcomes [8]. This protocol details a multi-method confirmation framework that synergizes calendar tracking, urinary luteinizing hormone (LH) detection, and quantitative urinary hormone assays to achieve robust phase identification. This approach is designed to meet the rigorous evidence standards required for scientific and clinical research, providing a validated pathway for reliable biobehavioral correlation studies [8] [38].
Core Principles and Rationale for Multi-Method Approach
The menstrual cycle is characterized by dynamic, interlinked hormonal fluctuations. Relying on a single tracking method introduces significant error risk due to substantial inter- and intra-individual variability in cycle length and hormone profiles [8] [39].
- Calendar Tracking: Provides an initial, low-burden estimate of cycle stage and length but operates on often-inaccurate assumptions about phase timing, particularly ovulation [8].
- Urinary LH Monitoring: Identifies the impending LH surge, which is a definitive marker of ovulation and crucial for pinpointing the fertile window and the luteal phase transition [39] [38].
- Quantitative Hormonal Assays: Deliver objective, continuous data on reproductive hormones like estrone-3-glucuronide (E3G) and pregnanediol glucuronide (PdG). This allows for dynamic tracking of hormone trends and independent confirmation of ovulation and luteal phase integrity through the sustained rise in PdG [38].
Integrating these methods creates a synergistic system where the limitations of one technique are compensated by the strengths of another, thereby enhancing overall classification accuracy and reliability for research purposes.
Experimental Protocols and Workflows
Participant Screening and Eligibility
Objective: To recruit a cohort with confirmed ovulatory cycles for research. Inclusion Criteria:
- Participants aged 21-45 years.
- Self-reported cycle lengths ranging from 21 to 42 days.
- Cycle length variation no more than 3 days from the expected length in the preceding cycles.
- No previously diagnosed infertility conditions [38]. Exclusion Criteria:
- Current use of hormonal contraception or other medications known to interfere with reproductive hormone levels.
- Presence of endocrine disorders such as PCOS, thyroid dysfunction, or hyperprolactinemia.
- Breastfeeding or known pregnancy during the study period.
Sample Collection and Handling Protocol
Collection:
- Collect first-morning urine samples daily throughout the entire menstrual cycle.
- Use sterile, preservative-free collection cups.
- Record collection date and time, along with the first day of menstruation (Cycle Day 1). Storage and Processing:
- Aliquot samples immediately after collection.
- Freeze aliquots at -20°C or below until analysis.
- Avoid repeated freeze-thaw cycles (maximum of 2 cycles recommended).
Data Acquisition and Analysis Procedures
Calendar Tracking:
- Participants record the first day of menstruation (Cycle Day 1) and the onset of subsequent menses.
- The estimated day of ovulation is calculated as Cycle Day 1 minus 14 days for backward calculation, or forward calculation is used based on participant's historical average cycle length [8].
Urinary LH Surge Detection:
- Analyze daily urine samples using qualitative or semi-quantitative LH test kits.
- The day of the LH surge is defined as the first day when LH concentration exceeds a predefined threshold (typically 25-40 mIU/mL) or the test line intensity matches or exceeds the control line.
- The "ovulation phase" in the analysis window is often defined as the period spanning 2 days before to 3 days after the positive LH test [18].
Quantitative Hormone Assay (e.g., Inito Fertility Monitor or ELISA):
- Analyze urine samples for E3G and PdG concentrations.
- Follow manufacturer protocols for point-of-care devices. For laboratory ELISA:
- Use commercial E3G (e.g., Arbor Estrone-3-Glucuronide EIA kit, K036-H5) and PdG (e.g., Arbor Pregnanediol-3-Glucuronide EIA kit, K037-H5) kits [38].
- Run all samples and standards in duplicate or triplicate.
- Calculate hormone concentrations using a standard curve derived from known calibrators.
Phase Identification Criteria
The following integrated criteria should be used to define menstrual cycle phases for research analysis:
- Follicular Phase: From the onset of menstruation (Cycle Day 1) until the day before the detected LH surge. Characterized by low but rising E3G and low PdG levels.
- Ovulation Phase: The period encompassing the LH surge, typically defined as the window from 2 days before to 3 days after the positive LH test [18].
- Luteal Phase: From the day after the confirmed LH surge until the onset of next menses. Confirmed by a sustained elevation in PdG levels (e.g., > 5 μg/mL for 3 consecutive days) [38].
- Anovulatory Cycle Identification: A cycle is classified as anovulatory if no LH surge is detected AND no sustained PdG rise is observed in the latter half of the cycle [39] [38].
Data Presentation and Analysis
Validation of Quantitative Hormone Measurements
The accuracy of quantitative urinary hormone measurements is paramount for research reliability. Performance characteristics of a validated fertility monitor (IFM) compared to laboratory-based ELISA are summarized below:
Table 1: Analytical Validation of Urinary Hormone Measurements via Inito Fertility Monitor (IFM)
| Hormone | Average Correlation with ELISA | Average Coefficient of Variation (CV) | Recovery Percentage | Key Metric |
|---|---|---|---|---|
| PdG | High Correlation | 5.05% | Accurate | Confirms ovulation [38] |
| E3G | High Correlation | 4.95% | Accurate | Predicts fertile window [38] |
| LH | High Correlation | 5.57% | Accurate | Pinpoints LH surge [38] |
Performance of Multi-Method Phase Identification
Integrating multiple data streams significantly improves phase identification accuracy. Machine learning models applied to multi-parameter physiological data demonstrate the potential of combined metrics:
Table 2: Performance of Machine Learning Models in Menstrual Phase Identification
| Model / Condition | Number of Phases Classified | Overall Accuracy | AUC-ROC | Key Finding |
|---|---|---|---|---|
| Random Forest (Fixed Window) | 3 (P, O, L) | 87% | 0.96 | High accuracy for core phases [18] |
| Random Forest (Fixed Window) | 4 (P, F, O, L) | 71% | 0.89 | Good accuracy for detailed phases [18] |
| Random Forest (Sliding Window) | 4 (P, F, O, L) | 68% | 0.77 | Moderate accuracy for daily tracking [18] |
| Novel PdG Criterion | Ovulation Confirmation | 100% Specificity | 0.98 | Enables earlier, accurate ovulation confirmation [38] |
The Scientist's Toolkit: Research Reagent Solutions
Table 3: Essential Materials and Reagents for Menstrual Cycle Phase Research
| Item | Function / Application | Example Products / Kits |
|---|---|---|
| Urinary PdG ELISA Kit | Quantitatively measures PdG metabolite to confirm ovulation and luteal phase health. | Arbor Pregnanediol-3-Glucuronide EIA Kit (K037-H5) [38] |
| Urinary E3G ELISA Kit | Quantitatively measures estrogen metabolite to track follicular development and fertile window. | Arbor Estrone-3-Glucuronide EIA Kit (K036-H5) [38] |
| Urinary LH ELISA Kit | Precisely quantifies LH concentration for surge detection in a laboratory setting. | DRG LH (Urine) ELISA Kit (EIA-1290) [38] |
| Qualitative LH Test Strips | Rapid, at-home detection of the LH surge for predicting ovulation. | Various over-the-counter ovulation predictor kits (OPKs) |
| Integrated Fertility Monitor | A quantitative, connected system for simultaneous at-home measurement of E3G, PdG, and LH. | Inito Fertility Monitor (IFM) [38] |
| Wearable Physiological Sensor | Continuously tracks physiological parameters (e.g., skin temperature, HR) for phase prediction models. | Oura Ring, Empatica EmbracePlus [18] |
Advanced Applications and Emerging Methodologies
The field of menstrual cycle phase tracking is rapidly evolving with the integration of digital health technologies and advanced analytics.
- Machine Learning Integration: Combining wearable sensor data (e.g., wrist-based skin temperature, heart rate, heart rate variability) with hormone data can automate phase tracking. Random Forest models have shown promise, achieving up to 87% accuracy in classifying three primary menstrual phases [18].
- Novel Hormone Trends: Research using quantitative monitors has identified a previously uncharacterized hormone trend in 94.5% of ovulatory cycles, suggesting potential new biomarkers for ovulation confirmation [38].
- Luteal Phase Tracking: Quantitative PdG measurement is critical for identifying luteal phase defects, a common cause of infertility characterized by insufficient progesterone production, which can be missed by calendar or LH-only methods [39].
Navigating Methodological Pitfalls and Optimizing Assay Protocols
In the pursuit of integrating female-specific physiology into biomedical research, the accurate determination of menstrual cycle phase has emerged as a critical methodological challenge. The common practice of using assumed or estimated cycle phases—primarily through count-back methods based on self-reported menstrual bleeding—represents a significant compromise to scientific rigor that threatens the validity of research findings and their application in drug development. These indirect estimation techniques amount to guessing the occurrence and timing of complex ovarian hormone fluctuations, with potentially significant implications for understanding female athlete health, training adaptations, pharmaceutical efficacy, and side effect profiles [40].
The fundamental limitation of count-back methods lies in their inability to account for the substantial inter- and intra-individual variability in menstrual cycle characteristics. While the average menstrual cycle is often described as 28 days, healthy cycles naturally vary between 21 and 37 days, with approximately 69% of the variance in total cycle length attributable to variance in follicular phase length alone [1]. More critically, regular menstruation with cycle lengths between 21-35 days does not guarantee a eumenorrheic hormonal profile, as subtle menstrual disturbances such as anovulatory or luteal phase deficient cycles can remain entirely undetected by calendar-based methods [40]. With up to 66% of exercising females experiencing some form of menstrual disturbance, the potential for misclassification using count-back methods is substantial [40].
Quantitative Limitations of Calendar-Based Methods
The empirical evidence demonstrating the inaccuracy of count-back and other projection methods is compelling. One comprehensive study examined the accuracy of common menstrual cycle phase determination methods using 35-day within-person assessments of circulating ovarian hormones from 96 females [8]. The findings revealed that all three common indirect methods were error-prone, resulting in phases being incorrectly determined for many participants. The statistical analysis showed Cohen’s kappa estimates ranging from -0.13 to 0.53, indicating disagreement to only moderate agreement depending on the comparison method [8]. This level of inaccuracy is particularly concerning for drug development research, where misattribution of hormone-mediated side effects or efficacy could lead to incorrect conclusions about pharmaceutical safety profiles.
Table 1: Accuracy of Common Menstrual Cycle Phase Determination Methods
| Method Category | Specific Technique | Reported Accuracy/Reliability | Primary Limitations |
|---|---|---|---|
| Count-Back/Projection | Forward calculation from menses | Cohen's kappa: -0.13 to 0.53 [8] | Assumes prototypical 28-day cycle; ignores individual variability |
| Count-Back/Projection | Backward calculation from next menses | Cohen's kappa: -0.13 to 0.53 [8] | Depends on accurate prediction of next menses |
| Hormone Ranges | Single-point hormone assessment | 19% of phase-defining studies use this error-prone method [8] | Cannot capture hormone dynamics; ranges often from small samples |
| Urinary LH Testing | At-home ovulation prediction | Identifies LH surge preceding ovulation [41] [42] | Requires daily testing during fertile window; identifies one timepoint |
| Quantitative Hormone Monitoring | Multi-hormone urine tracking (e.g., Mira) | Correlates with serum hormones; predicts & confirms ovulation [42] | Requires specialized equipment; multiple measurements per cycle |
The persistence of these methodologically weak approaches is evident in the literature. A survey of studies published between January 2010 and January 2022 in three prominent empirical journals (Psychoneuroendocrinology, Hormones & Behavior, and Physiology & Behavior) found that approximately 76% of studies defining menstrual cycle phase utilized projection methods based solely on self-report [8]. This widespread use of methodologically problematic approaches has created a literature base with significant limitations for systematic review and meta-analysis, ultimately hindering the advancement of women's health research [1].
Advanced Methodologies for Precise Phase Determination
Direct Hormone Assessment Protocols
The gold standard for menstrual cycle phase determination involves direct measurement of key reproductive hormones through validated laboratory techniques. The minimal protocol for reliable phase determination should include assessment of luteinizing hormone (LH) to detect the preovulatory surge and progesterone measurement to confirm ovulation and adequate luteal phase function [40]. Serum sampling remains the most accurate method, though salivary and urinary assays offer less invasive alternatives with varying degrees of validity [15].
For urinary hormone monitoring, the following protocol is recommended based on established methodologies [42]:
- Collection: First-morning urine samples provide the most concentrated hormone measurements
- Analytes: Measure follicle-stimulating hormone (FSH), estrone-3-glucuronide (E13G), luteinizing hormone (LH), and pregnanediol glucuronide (PDG)
- Frequency: Daily collection from cycle day 6 until ovulation confirmation, then every 2-3 days during luteal phase
- Ovulation confirmation: PDG rise >5μg/mL sustained for至少 3 days indicates ovulation occurrence
Salivary hormone assessment, while less invasive, shows specific utility patterns. Research demonstrates that a singular salivary hormone assessment does not significantly improve prediction of menstrual cycle phases when adequate counting methods or urinary ovulation kits are available [43]. However, salivary hormone assessment does significantly improve prediction of cycle phases when more than one time-point is assessed, with values referenced against each other [43]. Adding a second assessment timepoint is more informative for estradiol than progesterone values, but most effective when both hormones are combined [43].
Table 2: Hormone Patterns Across the Menstrual Cycle Phases
| Cycle Phase | Estradiol Pattern | Progesterone Pattern | LH/FSH Pattern | Confirmatory Criteria |
|---|---|---|---|---|
| Early Follicular | Low (stable) | Low (stable) | Low FSH, rising | Bleeding days 1-5; all hormones at baseline |
| Late Follicular | Rapid rise | Low | LH surge precedes ovulation | Rising E2; LH surge detected in urine |
| Ovulation | Peak then slight drop | Beginning to rise | LH peak | LH surge day + 1-2 days; follicle rupture on ultrasound |
| Mid-Luteal | Secondary peak | Sustained high levels | Low | Elevated P4 >5μg/mL (urine) 5-9 days post-ovulation |
| Late Luteal | Decline | Sharp decline | Low | Dropping P4/E2 preceding menses |
Emerging Technological Approaches
Recent advances in wearable technology and machine learning offer promising alternatives to traditional hormone monitoring. One study applied machine learning to identify menstrual cycle phases using physiological signals recorded from a wrist-worn device, including skin temperature, electrodermal activity, interbeat interval, and heart rate [18]. Using a random forest model with a leave-last-cycle-out approach, the method achieved 87% accuracy and an AUC-ROC of 0.96 when classifying three phases (period, ovulation, and luteal) [18].
Another technological approach utilizes circadian rhythm-based heart rate monitoring to overcome limitations of basal body temperature tracking. A machine learning model developed using XGBoost incorporated heart rate at the circadian rhythm nadir (minHR) and demonstrated significant improvements in luteal phase classification and ovulation day detection performance compared to day-counting only methods [22]. In participants with high variability in sleep timing, the minHR-based model outperformed BBT-based models, reducing ovulation day detection absolute errors by 2 days [22].
The following diagram illustrates the signaling pathways and physiological relationships between hormonal events and measurable physiological parameters across the menstrual cycle:
Recommended Experimental Protocols for Research Settings
Protocol 1: Urinary Hormone Monitoring with Quantitative Assays
This protocol establishes a comprehensive framework for menstrual cycle monitoring using quantitative urinary hormone assays, validated against ultrasound and serum standards [42].
Objectives: Characterize quantitative hormone patterns in urine and validate against serum hormonal measurements and ultrasound-confirmed day of ovulation.
Materials:
- Quantitative urinary hormone monitor (e.g., Mira monitor)
- Test strips for FSH, E13G, LH, PDG
- Mobile application for data tracking
- Serial ultrasound access for ovulation confirmation
- Serum collection supplies for validation
Procedure:
- Participant Screening: Recruit naturally cycling women with regular cycles (24-38 days) or irregular cycles (PCOS, athletes)
- Baseline Assessment: Record menstrual history, measure serum AMH for ovarian reserve
- Daily Monitoring: Participants collect first-morning urine samples from day 6 of cycle
- Hormone Analysis: Use quantitative monitor to measure FSH, E13G, LH, PDG daily
- Ovulation Prediction: Monitor for LH surge (>30 mIU/mL indicates impending ovulation)
- Ultrasound Confirmation: Perform serial ultrasounds when LH surge detected to visualize follicle rupture
- Luteal Phase Confirmation: Monitor PDG rise (>5μg/mL sustained for 3 days confirms ovulation)
- Cycle Characterization: Document follicular and luteal phase lengths, hormone patterns
Validation: Compare urinary hormone patterns with serum measurements and ultrasound-observed ovulation day across 3 consecutive cycles.
Protocol 2: Multi-Parameter Wearable Sensor Monitoring
This protocol leverages wearable technology and machine learning for non-invasive cycle phase detection [18] [22].
Objectives: Classify menstrual cycle phases using physiological signals from wearable devices with machine learning algorithms.
Materials:
- Research-grade wearable device (e.g., E4 wristband, EmbracePlus)
- Capable of continuous monitoring of skin temperature, electrodermal activity, interbeat interval, heart rate
- Data processing infrastructure
- Urinary LH test kits for ground truth labeling
Procedure:
- Device Setup: Participants wear device continuously for 2-5 menstrual cycles
- Data Collection: Record physiological signals (HR, IBI, EDA, temperature, accelerometry)
- Ground Truth Labeling: Use urinary LH tests to identify ovulation day for cycle phase reference
- Feature Extraction: Calculate daily metrics from physiological signals
- Model Training: Implement random forest or XGBoost classifiers with leave-one-cycle-out cross-validation
- Phase Classification: Train model to identify 3-4 menstrual phases (menstruation, follicular, ovulation, luteal)
- Performance Validation: Assess accuracy, precision, recall, and AUC-ROC against LH-confirmed phases
Analysis: The random forest model achieving 87% accuracy for 3-phase classification and AUC-ROC of 0.96 demonstrates clinical utility [18].
The Scientist's Toolkit: Essential Research Reagents and Materials
Table 3: Research Reagent Solutions for Menstrual Cycle Phase Determination
| Reagent/Material | Function/Application | Research Utility | Considerations |
|---|---|---|---|
| Urinary LH Test Strips | Detects luteinizing hormone surge preceding ovulation | Provides inexpensive ovulation detection for phase determination | Qualitative results only; requires daily testing during fertile window |
| Quantitative Urinary Hormone Monitor (e.g., Mira) | Measures FSH, E13G, LH, PDG concentrations in urine | Enables tracking of full hormone dynamics across cycle | Higher cost; requires specific test strips for each analyte |
| Salivary Hormone Immunoassay Kits | Quantifies estradiol and progesterone in saliva | Non-invasive hormone monitoring; correlates with serum levels | Questionable validity for single timepoint phase determination [43] |
| Serum Hormone Testing Supplies | Gold standard for hormone concentration measurement | Most accurate hormone assessment for validation studies | Requires venipuncture; higher participant burden |
| Research Wearable Devices | Continuous physiological monitoring (T, HR, HRV, EDA) | Enables machine learning approaches for phase detection | Data processing complexity; validation against hormone measures needed |
| Basal Body Temperature Thermometers | Tracks biphasic temperature pattern post-ovulation | Historical method for ovulation confirmation | Affected by sleep timing, environment; limited predictive value |
The evidence against count-back and estimation methods for menstrual cycle phase determination is compelling and multifaceted. These approaches lack both validity and reliability, failing to account for significant biological variability and subtle menstrual disturbances that profoundly impact hormonal profiles [40]. The propagation of these methodologically weak practices has created a literature base with inherent limitations, hindering systematic reviews, meta-analyses, and the development of evidence-based recommendations for women's health and pharmaceutical development [1].
Moving forward, researchers must adopt more rigorous approaches that prioritize direct measurement over estimation. The recommended protocols outlined herein—incorporating urinary hormone monitoring, wearable technology, and machine learning—offer viable pathways to more accurate menstrual cycle phase determination. While these methods require greater resources and participant burden, their implementation is essential for generating valid, reproducible data that can truly advance our understanding of female physiology and pharmacology.
As the scientific community continues to recognize the importance of female-specific research, establishing and adhering to methodological standards in menstrual cycle phase determination must become a priority. Only through this commitment to rigor can we ensure that research findings accurately reflect biological reality and contribute meaningfully to women's health outcomes.
Within the broader context of research on determining menstrual cycle phase with hormone assays, the accurate identification of subtle menstrual disturbances represents a critical methodological challenge. Anovulation (cycles where no egg is released) and Luteal Phase Deficiency (LPD) (characterized by insufficient progesterone production or duration) are two such conditions that can significantly impact biobehavioral and clinical research outcomes [44] [45]. A paramount concern for researchers is that the presence of regular menstrual bleeding does not ensure ovulation has occurred; one recent study of athletes found that 26% of participants with regular cycles exhibited anovulatory cycles or cycles with deficient luteal phases, a prevalence that would go undetected by calendar tracking alone [44]. Reliance on self-report or "count" methods for phase determination is error-prone, as cycle length and phase duration demonstrate considerable inter- and intra-individual variability [8] [34]. Consequently, integrating robust hormonal assays into study designs is essential to account for these disturbances, which can otherwise confound investigations into the effects of the menstrual cycle on physiology, behavior, and drug response.
Background and Significance
Defining the Disturbances
Anovulation: Anovulation refers to the failure to release an oocyte during a menstrual cycle. Crucially, clinical bleeding may still occur, making it indistinguishable from ovulatory cycles based on menstruation alone [44]. Hormonally, anovulatory cycles are characterized by the absence of the characteristic mid-cycle luteinizing hormone (LH) surge and consistently low progesterone levels throughout the cycle, as the corpus luteum never forms [46].
Luteal Phase Deficiency (LPD): LPD is a clinical diagnosis associated with an abnormal luteal phase length of ≤10 days, though definitions vary to include ≤11 or ≤9 days [45]. The pathophysiology may involve inadequate progesterone duration, inadequate progesterone levels, or endometrial progesterone resistance [45]. The corpus luteum produces progesterone in pulses, leading to levels that can fluctuate up to eightfold within 90 minutes, which complicates the definition of a single diagnostic threshold [45].
Prevalence and Clinical Relevance
These disturbances are not uncommon in research populations. As noted, over a quarter of a sample of healthy, regularly cycling athletes exhibited either anovulation or LPD [44]. LPD has also been purportedly associated with infertility, subfertility, short menstrual cycles, and premenstrual spotting, though its role as an independent cause of infertility or pregnancy loss remains controversial and difficult to prove [45]. From a research perspective, these conditions create "misclassification" noise, as data collected from a participant during a disturbed cycle may not accurately represent the intended phase physiology, potentially leading to inconsistent findings across studies [8].
The tables below synthesize key quantitative benchmarks for identifying ovulatory, anovulatory, and LPD cycles, based on the reviewed literature.
Table 1: Hormonal and Clinical Parameters for Cycle Classification
| Parameter | Ovulatory Cycle | Anovulatory Cycle | Luteal Phase Deficient (LPD) Cycle |
|---|---|---|---|
| Progesterone (Mid-Luteal) | ≥ 16 nmol/L (≈5 ng/mL) [44] | Consistently low, no rise [46] | Sub-threshold rise (e.g., <16 nmol/L) [44] |
| Luteal Phase Length | 11-17 days [45] | Not applicable | ≤10 days [45] |
| LH Surge | Distinct pre-ovulatory surge [34] | Absent or consistently elevated [46] | May be present but "weak" [46] |
| Estradiol Pattern | Biphasic with follicular peak and luteal rise [34] | Consistently low, linear pattern [44] | Lower LH and estrogen peaks [46] |
Table 2: Comparison of Common Phase Determination Methods and Their Limitations
| Method | Common Use | Key Limitations for Detecting Disturbances |
|---|---|---|
| Self-Report / "Count" Methods | Projecting phase forward from menses or backward from next estimated menses. | High error rate; cannot detect anovulation or short luteal phase length [8]. |
| Single Serum Progesterone | "Confirming" ovulation or luteal phase with a single measurement. | Pulsatile secretion causes wide fluctuations; single point may be misleading [45]. |
| Hormone Range Thresholds | Using standardized hormone ranges to assign phase. | Ranges may not be validated; individual variability is high [8]. |
| Urine LH Testing | Pinpointing the LH surge and ovulation. | Identifies ovulation timing but not luteal phase quality or progesterone levels [34]. |
Experimental Protocols for Identification
Accurately identifying anovulation and LPD in a research context requires a multi-faceted approach that moves beyond self-report.
Protocol 1: Comprehensive Cycle Mapping for Disturbance Screening
This protocol is designed for studies where precise cycle phase characterization is critical, such as those investigating cycle-dependent biobehavioral outcomes.
Objective: To definitively classify menstrual cycles as ovulatory, anovulatory, or LPD through dense hormonal sampling. Materials: See "Research Reagent Solutions" below. Procedure:
- Recruitment & Tracking: Recruit participants with self-reported regular cycles. Instruct them to track their cycle start date for at least one preceding cycle.
- Baseline Sample (Early Follicular): Schedule the first sample collection on days 2-5 of the cycle. Collect serum for Estradiol (E2), Progesterone (P4), FSH, and LH.
- Peri-Ovulatory Monitoring: Beginning around day 10, initiate daily or every-other-day urine collection for LH surge detection. Continue until a clear LH surge is identified (or ruled out).
- Mid-Luteal Confirmation: Schedule a visit for 6-8 days after a detected LH surge (or an estimated 7 days before the next expected menses if no LH surge is tracked). Collect serum for E2 and P4.
- Cycle Length Documentation: Record the first day of subsequent menses to calculate actual luteal phase length (days from LH surge to day before next menses). Analysis & Classification:
- Ovulatory Cycle: Detection of an LH surge AND mid-luteal P4 ≥ 16 nmol/L (5 ng/mL) [44] AND luteal phase length ≥ 11 days [45].
- Anovulatory Cycle: No detected LH surge AND mid-luteal P4 remains low (< 5 ng/mL) [46].
- LPD Cycle: Detection of an LH surge AND luteal phase length ≤10 days [45] OR mid-luteal P4 < 16 nmol/L despite adequate luteal length [44].
Protocol 2: Multi-Point Dried Urine Hormone Profiling
This protocol offers a lower-burden, at-home alternative for longitudinal hormone mapping, suitable for longer observational studies.
Objective: To obtain a month-long profile of key reproductive hormones to identify anovulation and LPD patterns. Materials: Dried urine test kit (e.g., ZRT Laboratory Menstrual Cycle Mapping kit) [46]. Procedure:
- Kit Provision: Provide the participant with a dried urine collection kit at the start of their cycle.
- Sample Collection: Instruct the participant to collect a first-morning urine sample on a filter card every other day for 30 days.
- Sample Return: Participants return the stable, dried filter cards by mail to the designated lab for analysis.
- Hormone Analysis: The lab analyzes E1C (estrogen metabolite), PdG (progesterone metabolite), and LH. Analysis & Classification:
- Ovulatory Cycle: A clear LH peak is evident, followed by a sustained rise in PdG levels that declines shortly before the next menses [46].
- Anovulatory Cycle: LH levels are consistently elevated with no distinct peak; PdG levels remain consistently low throughout [46].
- LPD Cycle: An LH peak and PdG rise are present, but the PdG peak is lower than normal and begins to decline approximately 7 days prior to the start of the next period [46].
Visualizing Experimental Workflows and Hormonal Patterns
The following diagrams, generated using Graphviz, illustrate the logical workflows for identifying menstrual disturbances and their characteristic hormonal signatures.
Experimental Workflow for Cycle Classification
Hormonal Signature Patterns
The Scientist's Toolkit: Research Reagent Solutions
The following table details essential materials and assays required for implementing the experimental protocols described above.
Table 3: Essential Research Reagents and Materials for Hormonal Assays
| Item | Function/Application | Key Considerations |
|---|---|---|
| Serum Hormone Immunoassays | Quantitative measurement of Estradiol, Progesterone, LH, FSH in blood serum. | Gold standard for concentration; requires venipuncture and clinical facilities. Single points may not capture pulsatile secretion (especially progesterone) [45] [47]. |
| Urinary LH Surge Kits | At-home detection of the LH surge to pinpoint ovulation and schedule luteal-phase sampling. | Critical for defining "Day 0" for luteal phase; does not assess progesterone or luteal phase quality [34]. |
| Dried Urine Hormone Profiling Kits | Multi-point collection for metabolites of Estrogen (E1C) and Progesterone (PdG), and LH. | Enables convenient, longitudinal mapping at home. Ideal for observing hormone patterns over a full cycle [46]. |
| Basal Body Temperature (BBT) Kits | Tracking the slight rise in resting body temperature post-ovulation. | Low-cost method to retrospectively confirm ovulation; low precision for timing ovulation and does not diagnose LPD [45]. |
| Anti-Mullerian Hormone (AMH) ELISA | Assessment of ovarian reserve. Useful for characterizing cohort fertility potential. | Not cycle-phase dependent; high levels may indicate PCOS (a risk factor for anovulation) [47]. |
Integrating rigorous protocols for identifying anovulation and luteal phase deficiency is no longer optional for high-quality menstrual cycle research. The high prevalence of these subtle disturbances, which are invisible to self-report methods, means they represent a significant source of unaccounted-for variance and misclassification [44] [8]. By adopting the detailed application notes and protocols outlined here—including multi-point hormone assays, logical classification workflows, and appropriate reagent solutions—researchers can significantly enhance the methodological rigor, reproducibility, and interpretability of their findings. This approach ensures that the complex interplay between ovarian hormones, physiology, and behavior is accurately captured, ultimately advancing the scientific understanding of women's health.
Application Notes
Accurate capture of the late follicular (LF) phase is critical for research investigating the physiological impacts of menstrual cycle estradiol fluctuations. The LF phase, characterized by peak estradiol levels just prior to the luteinizing hormone (LH) surge and ovulation, presents a narrow window for experimental testing [48] [49]. This protocol evaluates two urinary hormone test methodologies for scheduling LF visits: the Standard Ovulation Test (SOT), which identifies the LH surge, and the Advanced Ovulation Test (AOT), which detects a rise in estrogen metabolites (E3G) prior to the LH surge [48] [50].
A recent comparative study demonstrated that the theoretical advantage of the AOT—scheduling testing between the estrogen rise and LH surge to capture higher estradiol levels closer to ovulation—did not yield a significant practical benefit. The interval between the LF visit and ovulation was not statistically different between the AOT (2.7 ± 2.2 days) and SOT (2.5 ± 1.7 days) groups [48] [49]. Furthermore, while estradiol increased significantly from the early follicular to the late follicular phase, the magnitude of change was not influenced by the type of ovulation test used [48]. These findings suggest that for the purpose of scheduling LF visits in research settings, the AOT's estrogen signal may not provide a superior advantage over the SOT in aligning testing closer to the estradiol peak or ovulation.
Table 1: Key Findings from Comparative Study of SOT vs. AOT
| Metric | Standard Ovulation Test (SOT) | Advanced Ovulation Test (AOT) | P-value |
|---|---|---|---|
| LF Visit to Ovulation Interval (days) | 2.5 ± 1.7 | 2.7 ± 2.2 | 0.859 |
| Estradiol Increase (EF to LF phase) | Significant (p<0.001) | Significant (p<0.001) | Not Significant |
| Primary Hormone Detected | Luteinizing Hormone (LH) | Estrogen Metabolite (E3G) & LH | - |
For maximum accuracy in phase determination, researchers should be aware that common methodologies, including self-report "count" methods and confirmation with limited hormone assays, are prone to error [8]. The most reliable confirmation of ovulation and the LF phase involves a multi-parameter approach, combining hormone tracking with ultrasonography [51].
Experimental Protocols
Participant Screening and Eligibility
Objective: To recruit a cohort of healthy, naturally menstruating premenopausal females.
- Inclusion Criteria: Females aged 18-35 years, with self-reported regular menstrual cycles (10+ per year) and no use of hormonal contraceptives [48].
- Exclusion Criteria: History of cardiovascular, metabolic, or reproductive disorders (e.g., PCOS); use of prescription medication with vasoactive effects; smoking; high levels of physical activity (>5 hours/week of moderate-to-vigorous activity); BMI >30 kg/m²; hypotension (<90/60 mmHg) or hypertension (>140/90 mmHg) [48].
Visit Scheduling and Phase Determination Workflow
The following protocol outlines the steps for scheduling early follicular (EF) and late follicular (LF) visits using ovulation tests, based on established methodologies [48].
Procedural Details:
Early Follicular (EF) Visit:
Late Follicular (LF) Visit Scheduling:
- Initial Estimate: For all participants, initially schedule the LF visit for 14-16 days prior to the expected end of the cycle, based on the length of the immediately previous cycle [48].
- Daily Hormone Testing: Provide participants with their assigned ovulation test kit and instruct them to follow the manufacturer's instructions for daily urine testing.
- Group-Specific Scheduling Logic:
- AOT Group (Clearblue Advanced Digital Ovulation Test): The LF visit should occur after the test indicates a rise in estrogen (e.g., a flashing smiley face) and before or on the day it indicates the LH surge (e.g., a solid smiley face). If the estrogen rise is not detected by the initially scheduled date, delay the visit until it is detected [48] [50].
- SOT Group (Standard Ovulation Test): The LF visit occurs before or on the day a urinary LH surge is detected [48].
LF Visit Procedures:
- Timing: Conduct the visit in the morning, matching the time of the EF visit (±2 hours). Participants should adhere to pre-visit restrictions (e.g., 12-hour fast, 24-hour abstinence from caffeine, alcohol, and exercise) [48].
- Procedures: Repeat all assessments performed at the EF visit, including salivary estradiol collection.
Hormone Assay and Ovulation Confirmation
Objective: To biochemically confirm menstrual cycle phase and the occurrence of ovulation.
- Salivary Estradiol (E2) Analysis: Collect saliva samples at both EF and LF visits. Analyze using a commercially available enzyme immunoassay kit (e.g., Salimetrics 17β-Estradiol EIA Kit). Salivary estradiol shows a moderate-to-strong correlation with serum levels and provides a non-invasive assessment method [48].
- Ovulation Confirmation: The gold standard for confirming ovulation in a research context is the visualization of follicle rupture via transvaginal ultrasound [51]. Alternatively, a significant rise in serum progesterone (>5 nmol/L) 7-10 days after the LH surge confirms successful ovulation [51] [52].
The Scientist's Toolkit
Table 2: Essential Research Reagents and Materials
| Item | Function/Description | Example Product/Catalog |
|---|---|---|
| Advanced Ovulation Test | Detects urinary estrogen rise (E3G) followed by LH surge to predict start of fertile window. | Clearblue Advanced Digital Ovulation Test [48] [50] |
| Standard Ovulation Test | Detects urinary LH surge to indicate impending ovulation (within 24-36 hours). | Clearblue Ovulation Test (Standard) [48] |
| Salivary Estradiol Kit | For quantitative, non-invasive measurement of 17β-Estradiol levels to confirm hormonal phase. | Salimetrics 17β-Estradiol Enzyme Immunoassay Kit [48] |
| Ultrasound System | Gold-standard method for visualizing follicle development and rupture to confirm ovulation day. | Not Specified [51] |
| Urine Progesterone Test | Confirms ovulation occurred by detecting rise in PdG (urine metabolite of progesterone). | Proov Confirm PdG Test [50] [52] |
Advanced Hormonal Algorithm for Ovulation Prediction
For research requiring the highest precision in ovulation prediction, a multi-parameter algorithm combining hormonal and ultrasonographic data is recommended. The following diagram outlines a logic flow based on a validated model that achieved >95% accuracy [51].
Algorithm Key Insights:
- Estrogen Decline is a Key Predictor: Any decrease in estradiol levels, while a dominant follicle is still present on ultrasound, is 100% specific for predicting ovulation the following day [51].
- LH and Progesterone Role: An LH level ≥ 35 IU/L has high sensitivity for predicting ovulation the next day. A progesterone rise > 2 nmol/L, which occurs prior to ovulation, provides additional predictive confidence with high sensitivity (91.5%), though lower specificity (62.7%) [51].
- Post-Ovulation Confirmation: A progesterone level > 5 nmol/L in the days following suspected ovulation has a high positive predictive value (94.3%) for confirming that ovulation has occurred [51].
In the field of hormone research, particularly in the precise determination of menstrual cycle phases, the reliability of assay data is paramount. The coefficient of variation (CV or %CV) serves as a critical, dimensionless statistical metric for assessing assay precision and reliability, independent of the absolute measurement values [53]. For researchers aiming to characterize the dynamic hormonal fluctuations of the menstrual cycle, understanding and controlling variability is essential. High-quality data is necessary to distinguish true biological signals from assay noise, a challenge compounded by the rapid hormonal changes that occur throughout the cycle [54]. This application note details the concepts of intra- and inter-assay CV and provides standardized protocols for their calculation and control, framed within the context of menstrual cycle hormone research.
The core formula for calculating the %CV for any set of measurements is:
%CV = (Standard Deviation (σ) / Mean (μ)) × 100 [53]
Core Concepts: Intra-Assay vs. Inter-Assay CV
In practice, assay precision is evaluated through two distinct types of CV, which quantify different sources of variability inherent to the experimental process.
- Intra-Assay CV: This metric measures the variability within a single assay run. It assesses the consistency of repeated measurements (e.g., duplicates or triplicates) of the same sample on the same plate [53]. A low intra-assay CV indicates high repeatability and precision under identical conditions, reflecting proper technique during a single experiment. For hormone assays, this is crucial for confidently measuring individual sample concentrations.
- Inter-Assay CV: This metric measures the variability across different assay runs. It assesses the consistency of results when the same control sample is tested across multiple plates, different days, or by different operators [55] [53]. A low inter-assay CV indicates high reproducibility and robust assay performance over time and across conditions. In longitudinal studies like menstrual cycle tracking, this ensures that measurements taken in different cycles are comparable.
The table below summarizes the key differences and accepted thresholds for these metrics in hormone immunoassays.
Table 1: Key Characteristics of Intra- and Inter-Assay CV
| Feature | Intra-Assay CV | Inter-Assay CV |
|---|---|---|
| Definition | Variance between sample replicates within the same run/plate [53] | Variance between runs of sample replicates on different plates [53] |
| Measures | Precision or repeatability | Plate-to-plate consistency and reproducibility [55] |
| Typical Acceptable Threshold | < 10% [55] [53] | < 15% [55] [53] |
| Primary Context | Single experiment | Longitudinal study, multiple experiments |
Diagram 1: Intra- and Inter-Assay CV Assessment Workflow.
Calculating Intra-Assay Coefficient of Variation
The intra-assay CV is calculated to ensure consistency within a single assay plate. This is particularly important for confirming the precision of individual sample measurements in a study.
Protocol for Intra-Assay CV Calculation
- Sample Measurement: Measure each sample in duplicate on the same assay plate. For hormone assays related to menstrual cycle phase, this includes all unknown samples and controls [55].
- Individual CV Calculation: For each duplicate pair, calculate the mean and standard deviation. Then, calculate the %CV for that specific sample using the formula: %CV = (Standard Deviation / Duplicate Mean) × 100 [55].
- Overall CV Determination: The reported intra-assay CV for the entire experiment is the average of the individual %CVs from all duplicate samples on the plate [55].
Workflow and Example Calculation
Table 2: Example Data for Intra-Assay CV Calculation (Cortisol Assay)
| Sample | Result 1 (µg/dL) | Result 2 (µg/dL) | Duplicate Mean (µg/dL) | Standard Deviation | % CV |
|---|---|---|---|---|---|
| 1 | 0.132 | 0.128 | 0.130 | 0.003 | 2.2 |
| 2 | 0.351 | 0.361 | 0.356 | 0.007 | 2.0 |
| 3 | 0.282 | 0.306 | 0.294 | 0.017 | 5.8 |
| ... | ... | ... | ... | ... | ... |
| 40 | 0.181 | 0.181 | 0.181 | 0.000 | 0.0 |
| Average Intra-Assay %CV | ~5.1% |
Adapted from Salimetrics calculation example [55].
Diagram 2: Detailed Intra-Assay CV Calculation Process.
Calculating Inter-Assay Coefficient of Variation
The inter-assay CV is critical for validating the consistency of an assay over time, which is fundamental for longitudinal studies like tracking hormone levels across multiple menstrual cycles.
Protocol for Inter-Assay CV Calculation
- Control Inclusion: On each assay plate, include known high and low value controls in replicate (e.g., quadruplicate) [55].
- Plate Mean Calculation: For each plate, calculate the mean concentration for the high control and the mean concentration for the low control.
- Overall Statistics: After running multiple plates (e.g., n=10), calculate the overall mean and standard deviation of the high control means from all plates. Repeat this for the low control means.
- CV Calculation and Averaging: Calculate the %CV for the high controls across plates (%CV = (SD of High Means / Mean of High Means) × 100). Repeat for the low controls. The final inter-assay CV is the average of the high and low control %CVs [55].
Workflow and Example Calculation
Table 3: Example Data for Inter-Assay CV Calculation (Cortisol Controls)
| Control | Plate 1 Mean (µg/dL) | Plate 2 Mean (µg/dL) | ... | Plate 10 Mean (µg/dL) | Mean of Means | Std Dev of Means | % CV of Means |
|---|---|---|---|---|---|---|---|
| High | 1.090 | 0.998 | ... | 0.941 | 1.005 | 0.051 | 5.1 |
| Low | 0.105 | 0.097 | ... | 0.103 | 0.104 | 0.0065 | 6.3 |
| Inter-assay CV (n=10) | 5.7% |
Adapted from Salimetrics calculation example [55]. The Inter-assay CV is the average of the high and low %CVs: (5.1 + 6.3) / 2 = 5.7%.
Diagram 3: Detailed Inter-Assay CV Calculation Process.
The Scientist's Toolkit: Essential Reagents and Materials
Successful hormone assay execution with low CV depends on using high-quality reagents and proper laboratory materials. The following table details key components.
Table 4: Essential Research Reagent Solutions for Hormone Assays
| Item | Function / Description | Application Note |
|---|---|---|
| Validated ELISA Kits | Pre-optimized kits for specific hormones (e.g., estradiol, progesterone). | Kits designed for multiple sample matrices (serum, saliva) from various species improve reliability [53]. |
| Calibrators & Standards | Solutions with known analyte concentrations for generating the standard curve. | Essential for converting optical density (OD) readings to concentration values on each plate [55]. |
| High & Low Controls | Quality control samples with known concentrations in the assay range. | Critical for calculating both intra- and inter-assay CV and monitoring plate-to-plate consistency [55]. |
| Precision Pipettes & Tips | Calibrated air-displacement pipettes and low-retention tips. | Proper pipetting is the single most important factor for achieving low CVs [55] [53]. |
| Plate Reader | Instrument for measuring optical density (OD) in each well. | Must be properly calibrated and maintained. Software settings must be consistent across runs [53]. |
| Plate Washer | Automated instrument for consistent wash buffer removal. | Optimized wash protocols (volume, cycles) are vital for reducing background and variability [53]. |
Troubleshooting High %CV in Hormone Assays
Despite careful planning, high CVs can occur. The following table outlines common problems and solutions.
Table 5: Troubleshooting Guide for High Assay Variability
| Problem Area | Potential Cause | Corrective Action |
|---|---|---|
| Pipetting Technique | Inconsistent pipetting angle, speed, or depth; uncalibrated pipettes. | Hold pipettes vertically, aspirate/dispense slowly and smoothly. Perform regular calibration and user training [55] [53]. |
| Sample Handling | High viscosity of sample matrix (e.g., saliva); inconsistent freeze-thaw cycles. | For viscous fluids: vortex, centrifuge, and use pipette tip pre-wetting [55]. Standardize sample handling protocols. |
| Incubation | Temperature gradients across the plate; wells drying out. | Incubate plates in a stable environment away from drafts; always use plate sealers during incubation [53]. |
| Wash Steps | Inconsistent wash volume or number of cycles between runs. | Optimize and standardize the wash protocol. Ensure wash volume is ≥ coating volume; typically 3 wash cycles are effective [53]. |
| Contamination | Bacterial/fungal growth in reagents; cross-contamination between wells. | Use fresh pipette tips for every addition. Never pour unused reagent from a reservoir back into the stock bottle [53]. |
Benchmarking Accuracy: Validating and Comparing Phase Determination Techniques
The accurate determination of menstrual cycle phase is a cornerstone of reproducible research in women's health, yet many studies rely on projection-based methods—self-reported cycle history and calendar-based counting—that introduce significant, unquantified error. These methods project an assumed, standard cycle structure onto individuals, ignoring the documented biological variability in cycle and phase lengths [34] [1]. This article quantifies the errors inherent in these projection-based approaches and provides detailed protocols for integrating direct hormonal assays to generate high-fidelity, reproducible data crucial for drug development and clinical research.
Quantifying the Error of Projection
Relying on self-report and calendar counting to project menstrual cycle phase is a prevalent but methodologically unsound practice. The following tables synthesize quantitative data on the limitations of these approaches.
Table 1: Documented Variability in Menstrual Cycle and Phase Lengths This table compels a move away from the assumed 28-day model by illustrating the natural physiological variation that projection methods ignore.
| Parameter | Mean Length (Days) | Standard Deviation | 95% Confidence Interval (Range in Days) | Primary Source of Cycle Length Variance |
|---|---|---|---|---|
| Total Cycle Length | 27-29 days [34] | Not Specified | 23-32 days [34] | N/A |
| Follicular Phase | 15.7 days [1] | 3.0 days [1] | 10-22 days [1] | 69% of total cycle variance [1] |
| Luteal Phase | 13.3 days [1] | 2.1 days [1] | 9-18 days [1] | 3% of total cycle variance [1] |
Table 2: Prevalence of Methodological Practices and Their Limitations This table summarizes the frequency of common phase-determination methods in the literature and their documented shortcomings.
| Method | Prevalence in Literature (n=146 articles) [34] | Key Documented Limitations & Error Sources |
|---|---|---|
| Self-Report of Menses Onset | 145/146 articles | Cannot detect anovulation or luteal phase defects; assumes standard phase lengths [56]. |
| Urine Luteinizing Hormone (LH) Testing | 50/146 articles | Pinpoints ovulation but requires daily testing; does not confirm subsequent progesterone rise. |
| Serum Hormone Measurement (Estradiol/Progesterone) | 49/146 articles | "Gold standard" but invasive, costly, and subject to diurnal and pulsatile variability [57]. |
The fundamental peril of projection is its inability to account for subtle menstrual disturbances, such as anovulatory or luteal phase deficient cycles, which are often asymptomatic. One analysis illustrated that when cycles are assessed solely by regular menstruation, these disturbances—which present with meaningfully different hormonal profiles—can have a prevalence of up to 66% in exercising females [56]. Projection-based methods classify these cycles as normal, thereby introducing profound misclassification bias.
Experimental Protocols for Accurate Phase Determination
To mitigate the errors of projection, researchers must adopt rigorous, multi-modal protocols that directly measure key hormonal milestones.
Protocol 1: Multi-Method Confirmatory Workflow for Phase Determination
This protocol combines tracking menses with ovulation confirmation and hormonal profiling to definitively identify the luteal phase.
Experimental Workflow: Multi-Method Phase Determination
Procedural Details:
- Participant Training & Menses Tracking: Train participants to identify and record the first day of menstrual bleeding (Cycle Day 1) using a digital calendar or diary.
- Urine LH Surge Detection: Beginning on cycle day 10, participants self-test first-morning urine daily using qualitative LH test kits. The day of the first positive test is designated as the LH surge day (Day 0). Testing continues until a surge is detected or menses begins.
- Serum Progesterone Confirmation: Schedule a blood draw for precisely 7 days (±1 day) after the detected LH surge. Collect 5-10 mL of venous blood into a serum separator tube. Allow the blood to clot for 30 minutes at room temperature, then centrifuge at 1000-2000 RCF for 15 minutes. Aliquot the serum into polypropylene cryovials and store at -80°C until assay.
- Hormone Assay: Quantify serum progesterone concentration using a validated method, such as an automated electrochemiluminescence immunoassay (ECLIA) or liquid chromatography–tandem mass spectrometry (LC-MS/MS). A mid-luteal phase progesterone concentration of ≥ 5 ng/mL is commonly used to confirm ovulation and a functional corpus luteum [1] [56].
Protocol 2: Quantitative Hormonal Profiling for Discrete Subphases
For research requiring precise subphase identification (e.g., early follicular, periovulatory, mid-luteal), comprehensive hormonal profiling is necessary.
Procedural Details:
- Study Visits & Sampling: Schedule laboratory visits based on the participant's individualized cycle timeline, as determined by LH surge testing.
- Early Follicular Phase: 2-5 days after menses onset.
- Late Follicular/Pre-Ovulatory Phase: Day of the LH surge (Day 0).
- Mid-Luteal Phase: 7 days after the LH surge (Day +7).
- Blood Collection & Processing: At each visit, collect and process blood samples as described in Protocol 1, Step 3.
- Multi-Hormone Assay: Quantify serum levels of 17β-estradiol (E2), progesterone (P4), and optionally luteinizing hormone (LH) and follicle-stimulating hormone (FSH). The expected hormonal profiles for a eumenorrheic cycle are summarized in Table 3.
Table 3: Expected Hormonal Ranges by Menstrual Cycle Phase in Eumenorrheic Cycles
| Cycle Phase | Progesterone (P4) | 17β-Estradiol (E2) | Luteinizing Hormone (LH) |
|---|---|---|---|
| Early-Mid Follicular | < 2 ng/mL [34] | 20-200 pg/mL [34] | 5-25 mIU/mL [34] |
| Late Follicular / Pre-Ovulatory | < 2 ng/mL [34] | > 200 pg/mL [34] | Surge to 25-100 mIU/mL [34] |
| Mid-Luteal | Peak: 2-30 ng/mL [34] | Secondary Peak: 100-200 pg/mL [34] | 5-25 mIU/mL [34] |
The Scientist's Toolkit: Research Reagent Solutions
Table 4: Essential Materials and Reagents for Menstrual Cycle Phase Determination
| Item | Function & Application | Key Considerations |
|---|---|---|
| Qualitative Urine LH Test Kits | Detects the pre-ovulatory LH surge to pinpoint ovulation. | For home use by participants. High sensitivity and specificity are critical. |
| Serum Separator Tubes (SST) | Collection and processing of blood samples for hormone analysis. | Standard 5-10 mL tubes are used. |
| Automated Immunoassay (e.g., Roche Elecsys) | High-throughput quantitative analysis of E2, P4, and other hormones. Well-suited for clinical lab settings [25]. | Lower cost and faster turnaround. May overestimate E2 at high concentrations and underestimate P4 and Testosterone vs. LC-MS/MS [25]. |
| Liquid Chromatography-Tandem Mass Spectrometry (LC-MS/MS) | High-specificity, multi-analyte quantification of steroid hormones. Considered the gold standard for specificity [25]. | Higher cost and complexity. Provides greater specificity and the ability to analyze multiple steroids simultaneously [25]. |
| Cryogenic Vials | Long-term storage of serum aliquots at -80°C. | Use polypropylene tubes to prevent analyte adsorption. |
Analytical Considerations and Data Integrity
- Hormonal Variability: Note that reproductive hormones exhibit diurnal and pulsatile secretion. A single morning measurement is often used as a pragmatic snapshot, but researchers should be aware that LH is the most variable (CV 28%), followed by sex-steroid hormones like estradiol (CV 13%) and testosterone (CV 12%) [57].
- Assay Validation: The choice between immunoassay and LC-MS/MS involves a trade-off between cost/convenience and specificity/accuracy. When using automated immunoassays, it is crucial to validate the method for the specific sample matrix (e.g., human serum) and be aware of its performance limitations compared to LC-MS/MS, particularly for testosterone and at extreme high/low concentrations of E2 and P4 [25].
- Statistical Modeling: The menstrual cycle is a within-person process. Statistical approaches like multilevel modeling are the gold standard, requiring a minimum of three observations per person to estimate within-person effects reliably. Studies should be powered to account for between-person differences in within-person hormone changes [1].
Within research aimed at determining menstrual cycle phase, the accurate and reliable measurement of hormones like estradiol, progesterone, and luteinizing hormone (LH) is paramount. The choice of assay matrix—serum, saliva, or urine—directly impacts the validity, precision, and practicality of the findings [15] [8]. Serum testing has traditionally been the gold standard in clinical and research settings, but salivary and urinary methods offer less invasive and more feasible alternatives for field-based or frequent sampling studies [15] [58]. This application note provides a comparative analysis of these three testing mediums, focusing on their sensitivity, specificity, and feasibility, to guide researchers in selecting the most appropriate methodology for menstrual cycle phase determination.
The table below synthesizes key characteristics of serum, salivary, and urinary hormone assays based on current literature and clinical practice.
Table 1: Comparative Analysis of Hormone Assay Matrices for Menstrual Cycle Research
| Characteristic | Serum/Plasma Assays | Salivary Assays | Urinary Assays |
|---|---|---|---|
| Hormone Fraction Measured | Total hormone (bound + free) [59] | Bioavailable, free hormone (unbound) [15] [59] | Hormone metabolites [15] [59] |
| Invasiveness & Feasibility | High (venipuncture required); lower feasibility for frequent sampling [15] [58] | Low (non-invasive); high feasibility and patient compliance [58] | Low (non-invasive); high feasibility for home testing [15] |
| Primary Applications in Cycle Research | Gold standard for validating other methods; definitive phase confirmation [15] [8] | Tracking bioavailable hormone fluctuations; cycle phase mapping [15] | Ovulation detection (LH surge); metabolite profiling [15] [59] |
| Key Methodological Challenges | High participant burden; requires clinical setting [15] | Variable composition; sensitivity to collection procedures; potential for contamination [15] [58] | Reflects metabolites, not active hormone; hydration-dependent concentration [59] |
| Validity & Precision | High validity and precision; considered the reference method [15] | Inconsistencies in validity and precision reported; requires rigorous standardization [15] | Good for detecting LH surge; validity for estrogen/progesterone is complex [15] |
Experimental Protocols for Menstrual Cycle Research
Protocol for Serum Hormone Assay and Phase Determination
Objective: To determine menstrual cycle phases (early follicular, late follicular, ovulation, mid-luteal) through serial serum hormone measurements.
Materials:
- Collection: Venipuncture kit (tourniquet, needle, serum separator tubes)
- Storage: -20°C or -80°C freezer
- Analysis: Electrochemiluminescence immunoassay (ECLIA) or equivalent platform [60]
- Reagents: Commercially available kits for serum Estradiol (E2), Progesterone (P4), and Luteinizing Hormone (LH)
Procedure:
- Participant Scheduling: Schedule blood draws based on participant-reported cycle history. For robust phase determination, collect samples 2-3 times per week across a complete cycle [8].
- Sample Collection: Perform venipuncture following standard clinical procedures. Allow blood to clot in serum tubes, then centrifuge to separate serum.
- Sample Storage: Aliquot serum and store frozen at -20°C or below until analysis.
- Hormone Assay: Analyze serum samples for E2, P4, and LH concentrations using a validated immunoassay according to manufacturer instructions.
- Data Analysis & Phase Determination:
- Ovulation: Identify the LH peak (surge) as a primary marker.
- Follicular Phase: Days from menses onset until the day before the LH surge. Characterized by low P4 and variable, then rising, E2.
- Luteal Phase: Days from ovulation until the next menses onset. Characterized by sustained elevated P4 levels [8] [60].
Protocol for Salivary Hormone Assay
Objective: To non-invasively track fluctuations in bioavailable estradiol and progesterone across the menstrual cycle.
Materials:
- Collection: Salivettes or sterile cryovials. Avoid containers with stabilizing agents unless validated for your assay.
- Storage: -20°C or -80°C freezer
- Analysis: Enzyme-Linked Immunosorbent Assay (ELISA) or Mass Spectrometry optimized for salivary hormones [15] [58]
Procedure:
- Participant Preparation: Instruct participants to avoid eating, drinking, brushing teeth, or smoking for at least 60 minutes prior to sample collection. Rinse mouth with water 10 minutes before collection.
- Sample Collection: Collect unstimulated whole saliva by passive drooling into a sterile tube or via an absorbent swab (Salivette). A minimum volume of 0.5 mL is typically required.
- Sample Processing: Centrifuge saliva samples (e.g., at 1500 x g for 15 minutes) to separate clear supernatant from mucins and cellular debris.
- Sample Storage: Aliquot the clear supernatant and store immediately at -20°C or below to prevent biomarker degradation [58].
- Hormone Assay: Analyze samples using salivary-specific ELISA kits. Report intra- and inter-assay coefficients of variation (CV) to ensure precision [15].
Protocol for Urinary Hormone Metabolite Assay
Objective: To detect the LH surge for ovulation timing and profile estrogen and progesterone metabolites.
Materials:
- Collection: Sterile urine collection cups
- Storage: -20°C freezer; aliquot for multiple assays
- Analysis: Immunoassay strips for LH (qualitative); LC-MS/MS or ELISA for quantitative metabolite analysis (e.g., estrone glucuronide, pregnanediol glucuronide) [15] [59]
Procedure:
- Sample Collection: Collect first-morning void urine, which is more concentrated. Note the time of collection.
- Sample Processing: For quantitative analysis, centrifuge to remove sediments. Aliquot and freeze at -20°C.
- Hormone Assay:
- LH Surge Detection: Use commercially available ovulation predictor kits (immunoassay strips) with daily testing around mid-cycle.
- Metabolite Quantification: Use LC-MS/MS for high-specificity analysis of multiple estrogen and progesterone metabolites. Normalize results to urine creatinine to account for dilution [59].
Visual Workflows and Pathways
Hormone Fluctuation and Phase Determination Logic
This diagram visualizes the logical relationship between hormonal events and the definition of menstrual cycle phases, which underpins the experimental protocols.
Testing Method Selection Workflow
This flowchart outlines a decision-making process for researchers to select the most appropriate hormone testing method based on their study goals and constraints.
The Scientist's Toolkit: Research Reagent Solutions
Table 2: Essential Materials for Hormone Assay in Menstrual Cycle Research
| Item | Function/Application | Examples & Notes |
|---|---|---|
| Serum Separator Tubes | Collection and processing of blood samples for serum isolation. | Standard venipuncture tubes containing a gel barrier. |
| Salivettes / Cryovials | Non-invasive collection of whole saliva. | Salivettes use an absorbent swad; cryovials are for passive drooling. |
| Electrochemiluminescence Immunoassay (ECLIA) | Quantitative analysis of hormone levels in serum with high sensitivity. | Commonly used on automated platforms like Cobas (Roche) [60]. |
| Enzyme-Linked Immunosorbent Assay (ELISA) Kits | Quantitative analysis of hormones in saliva and urine. | Must use kits validated for the specific matrix (salivary/urinary) [15] [58]. |
| Liquid Chromatography-Tandem Mass Spectrometry (LC-MS/MS) | High-specificity quantification of hormones and their metabolites in urine or saliva. | Considered a gold standard for metabolite profiling [59]. |
| Ovulation Predictor Kits (Immunoassay Strips) | Qualitative detection of the LH surge in urine for ovulation timing. | Useful for scheduling lab visits or other phase-dependent measures. |
| Creatinine Assay Kit | Normalization of urinary hormone metabolite concentrations for dilution. | Critical for accurate quantitative analysis in spot urine samples [59]. |
The integration of multimodal data from wearable sensors with machine learning (ML) algorithms is revolutionizing the field of menstrual health research. These technologies enable automated, precise, and non-invasive identification of menstrual cycle phases, offering a powerful alternative to traditional hormone assay methods. This article details the experimental protocols, key reagents, and computational frameworks essential for researchers and drug development professionals seeking to implement these approaches in clinical and research settings, with a specific focus on correlating physiological signals with endocrine events.
Accurately identifying menstrual cycle phases is fundamental to research in women's health, from fertility studies to the investigation of hormone-influenced conditions. Traditional methods reliant on hormone assays, while definitive, are invasive, costly, and impractical for continuous, long-term monitoring. The emergence of wearable devices capable of tracking a suite of physiological parameters, coupled with advanced ML, presents a paradigm shift. These systems can detect the subtle physiological changes orchestrated by hormonal fluctuations, enabling the continuous, automated classification of cycle phases. This document provides application notes and protocols for employing these technologies within a research framework aimed at validating and correlating these digital biomarkers against gold-standard hormone assays.
Current State of Machine Learning in Cycle Phase Identification
Recent studies demonstrate the efficacy of ML models in classifying menstrual cycle phases using data from wrist-worn wearables. Key performance metrics from recent literature are summarized in Table 1.
Table 1: Performance of Selected ML Models in Menstrual Phase Identification
| Study Focus | Model Used | Input Features | Classification Task | Key Performance Metrics | Citation |
|---|---|---|---|---|---|
| Multi-parameter Classification | Random Forest (RF) | Skin Temp, EDA, IBI, HR | 3 Phases (P, O, L) | Accuracy: 87%, AUC-ROC: 0.96 | [61] |
| Multi-parameter Classification | Random Forest (RF) | Skin Temp, EDA, IBI, HR | 4 Phases (P, F, O, L) | Accuracy: 68%, AUC-ROC: 0.77 | [61] |
| Sleeping Heart Rate & Cycle Day | XGBoost | minHR, Cycle Day | Ovulation & Luteal Phase | Improved recall vs. BBT model in subjects with variable sleep | [62] |
EDA: Electrodermal Activity; IBI: Interbeat Interval; HR: Heart Rate; minHR: Heart rate at circadian rhythm nadir; Temp: Temperature; P: Period/Menses; F: Follicular; O: Ovulation; L: Luteal.
These studies highlight several critical insights. First, models classifying three phases (e.g., menstruation, ovulation, luteal) often achieve higher accuracy than those segmenting the cycle into four or more phases, reflecting the challenge of delineating more subtle transitions [61]. Second, the choice of physiological signals is crucial; while multi-parameter models can achieve high accuracy, even single parameters like sleeping heart rate can be highly informative, especially for identifying the post-ovulatory luteal phase [62]. Finally, the random forest algorithm has shown particular promise in this domain, handling the complex, non-linear relationships inherent in physiological data effectively [61].
Experimental Protocols for Data Collection and Model Validation
This section outlines a core protocol for acquiring wearable device data and validating ML models against hormone assays.
Protocol: Correlating Wearable-Derived Features with Hormonal Phase
I. Objective To collect longitudinal physiological data from a wearable device and validate a machine learning model's phase classification against a gold-standard reference (urinary luteinizing hormone (LH) surge and/or serum progesterone).
II. Materials and Reagents
- Participants: Recruit premenopausal, ovulatory women (e.g., aged 18-45). Exclusion criteria include hormonal contraceptive use, pregnancy, lactation, and conditions/medications known to interfere with ovulation or physiological signals.
- Wearable Device: A research-grade wrist-worn device (e.g., Empatica E4, EmbracePlus) capable of continuously measuring:
- Skin Temperature: Proximal for basal body temperature rhythm.
- Electrodermal Activity (EDA): Indicator of sympathetic nervous system activity.
- Electrocardiogram (ECG) or Photoplethysmography (PPG): For deriving Heart Rate (HR) and Interbeat Interval (IBI)/Heart Rate Variability (HRV).
- Accelerometry: To assess physical activity and identify periods of rest.
- Hormone Assay Kits:
- Urinary LH Test Kits: For home use to detect the LH surge. The day of a positive test is designated as LH+0.
- Serum Progesterone Test Kits: For clinical venipuncture to confirm ovulation (progesterone > 3 ng/mL approximately 7 days post-LH surge).
III. Procedure
- Study Setup & Consent: Obtain ethical approval and informed consent. Train participants on device use and LH test procedures.
- Data Collection:
- Wearable Data: Participants wear the device continuously for 2-5 menstrual cycles, removing only for charging. Data is synced via Bluetooth to a secure server.
- Hormonal Reference Data:
- Participants perform daily urinary LH tests from the end of menses until a surge is confirmed.
- Schedule a clinic visit for serum progesterone draw 5-9 days after a detected LH surge.
- Cycle Phase Labeling (Ground Truth): Label data segments based on hormonal data and cycle day [61]:
- Menses (P): Days of active menstrual bleeding.
- Follicular (F): Post-menses period ending 2 days before the LH surge.
- Ovulation (O): The period spanning from 2 days before the positive LH test (LH-2) to 3 days after (LH+3).
- Luteal (L): From LH+4 until the onset of the next menses.
- Data Preprocessing:
- Signal Cleaning: Filter accelerometry data to isolate periods of sleep or rest for stable signal analysis. Impute short, missing data segments using linear interpolation.
- Feature Extraction: From clean data segments, calculate features per 24-hour period or specific sleep intervals:
- Sleeping Heart Rate: Mean nocturnal HR.
- minHR: The lowest 5-minute average HR during sleep [62].
- Skin Temperature: Mean nocturnal temperature.
- HRV Features: SDNN, RMSSD derived from IBI data.
- EDA: Mean amplitude of peaks during sleep.
- Model Training & Validation:
- Data Partitioning: Use a leave-last-cycle-out approach. Train the model on data from the first N-1 cycles and test on the final, held-out cycle for each participant. This simulates real-world prediction [61].
- Model Selection: Train a Random Forest or XGBoost classifier using the extracted features to predict the ground-truth phase labels.
- Performance Evaluation: Evaluate the model on the test set using accuracy, precision, recall, F1-score, and Area Under the Receiver Operating Characteristic Curve (AUC-ROC).
Workflow Visualization
The following diagram illustrates the logical workflow of the experimental protocol, from data acquisition to model validation.
The Scientist's Toolkit: Research Reagent Solutions
Table 2: Essential Materials and Reagents for Integrated Hormone and Wearable Research
| Item | Function/Description | Example Application in Protocol |
|---|---|---|
| Research-Grade Wearable | A device validated for clinical research, providing raw data access and high-frequency sampling of physiological signals. | Continuous acquisition of skin temperature, IBI, and EDA data for feature extraction. [61] |
| Urinary LH Detection Kit | Immunochromatographic test strips for detecting the luteinizing hormone surge in urine, defining the ovulation benchmark. | Used by participants at home to pinpoint the day of the LH surge (LH+0) for ground-truth labeling. [61] |
| Serum Progesterone ELISA Kit | Enzyme-linked immunosorbent assay for quantifying serum progesterone levels. | Confirmation of ovulation via a blood draw 5-9 days post-LH surge; progesterone >3 ng/mL supports luteal phase classification. |
| Data Processing Software (Python/R) | Programming environments with libraries (e.g., scikit-learn, pandas, NumPy) for signal processing, feature engineering, and ML model development. | Implementation of the leave-last-cycle-out cross-validation and training of the Random Forest/XGBoost classifier. [61] [62] |
Signaling Pathways and Hormonal Regulation
The menstrual cycle is governed by the Hypothalamic-Pituitary-Ovarian (HPO) axis. The following diagram maps the key hormonal signaling pathways and their relationship to measurable physiological parameters, illustrating the biological rationale for using wearables.
The automated identification of menstrual cycle phases using machine learning and wearable device data represents a significant advancement for clinical research and drug development. The protocols and frameworks detailed herein provide a roadmap for scientists to build and validate robust models. By systematically correlating digital biomarkers with endocrine events, researchers can create reliable, non-invasive tools that enhance the precision and scalability of women's health studies, ultimately bridging the gap between continuous physiological monitoring and traditional hormone assay research.
Within the broader scope of thesis research focused on determining menstrual cycle phase with hormone assays, establishing robust, validated criteria for hormonal thresholds is a fundamental methodological challenge. The natural fluctuations of hormones like estradiol (E2), progesterone (P4), and luteinizing hormone (LH) define the menstrual cycle's phases, yet significant variability exists between individuals [16]. Relying on imprecise or unvalidated phase-determination methods can lead to misclassification, thereby compromising the validity of research findings in neuroscience, psychology, and drug development [8]. This application note synthesizes current evidence and practical tools to provide detailed protocols for defining and confirming hormone thresholds for each menstrual cycle phase, emphasizing analytical rigor and methodological standardization.
The Challenge of Menstrual Cycle Phase Determination
A critical review of common methodologies reveals that many popular approaches are error-prone. These include projecting phases based solely on self-reported cycle days (count methods), using standardized hormone ranges without local validation, and inferring phase from hormone changes measured at only two time points [8]. One large-scale study of over 600,000 cycles demonstrated that the mean follicular phase length is 16.9 days and the mean luteal phase length is 12.4 days, both exhibiting considerable variation (95% CI: 10–30 and 7–17 days, respectively) [16]. This variability directly challenges the conventional model of a rigid 28-day cycle with a 14-day luteal phase. Furthermore, the follicular phase length decreases with age, while the luteal phase remains relatively stable, adding another layer of complexity for defining universal thresholds [16]. Misclassification not only introduces noise into data but can also lead to false conclusions about hormone-behavior relationships, ultimately hindering scientific progress and the development of tailored therapeutics [8].
Establishing Hormone Thresholds: Criteria and Considerations
Defining valid hormone thresholds requires moving beyond generic ranges to criteria that account for individual hormone dynamics and assay-specific characteristics.
Key Hormonal Dynamics of the Menstrual Cycle
The table below summarizes the characteristic hormonal patterns for each primary menstrual cycle phase, which form the basis for establishing threshold criteria.
Table 1: Characteristic Hormonal Patterns by Menstrual Cycle Phase
| Cycle Phase | Progesterone (P4) | Estradiol (E2) | Luteinizing Hormone (LH) |
|---|---|---|---|
| Early Follicular | Low (< 2 ng/mL) [34] | Low (20-60 pg/mL) [34] | Low (5-25 mIU/mL) [34] |
| Late Follicular | Low (< 2 ng/mL) [34] | High, primary peak (>200 pg/mL) [34] | Low, pre-surge (5-25 mIU/mL) [34] |
| Ovulation | Beginning to rise (2-20 ng/mL) [34] | High, pre-decline (>200 pg/mL) [34] | Surge (25-100 mIU/mL) [34] |
| Mid-Luteal | High, peak (2-30 ng/mL) [34] | Secondary peak (100-200 pg/mL) [34] | Low (5-25 mIU/mL) [34] |
| Late Luteal | Declining (2-20 ng/mL) [34] | Declining (20-60 pg/mL) [34] | Low (5-25 mIU/mL) [34] |
Quantitative Data on Cycle Variability
Understanding population-level variability is crucial for setting realistic threshold boundaries. The following table presents real-world cycle characteristics from a large-scale data analysis.
Table 2: Real-World Menstrual Cycle Characteristics (Based on 612,613 Ovulatory Cycles) [16]
| Parameter | Mean Duration (Days) | 95% Confidence Interval (Days) | Association with Age (25-45 yrs) |
|---|---|---|---|
| Total Cycle Length | 29.3 | Not Provided | Decrease of 0.18 days/year |
| Follicular Phase Length | 16.9 | 10 - 30 | Decrease of 0.19 days/year |
| Luteal Phase Length | 12.4 | 7 - 17 | No significant change |
Critical Methodological Considerations
- Assay Technique and Validation: The choice between immunoassays and liquid chromatography-tandem mass spectrometry (LC-MS/MS) is critical. Immunoassays are susceptible to cross-reactivity and matrix effects, which can lead to inaccurate measurements, particularly for steroid hormones [24]. LC-MS/MS methods are generally superior in specificity but require significant expertise and validation [24]. Any assay, especially a commercial kit, must undergo rigorous on-site verification before use in a study [24].
- Sample Matrix: The sample matrix (serum, saliva, urine) influences hormone concentrations. Saliva measures the bioavailable fraction, urine measures metabolites, and serum measures total hormone (bound and unbound) [15]. Thresholds are not interchangeable between matrices.
- Within-Person vs. Between-Person Designs: The menstrual cycle is a within-person process. Thresholds for confirming a phase change for an individual (e.g., a 2-3 fold rise in progesterone from their own baseline) are often more accurate than applying population-level thresholds between different individuals [63].
Recommended Experimental Protocols
Protocol 1: Comprehensive Phase Determination with Hormonal Confirmation
This protocol outlines the gold-standard approach for definitively identifying menstrual cycle phases in a research setting.
Objective: To accurately identify the early follicular, peri-ovulatory, and mid-luteal phases within a single menstrual cycle using a combination of tracking methods and hormonal confirmation.
Materials:
- Hormone Assay Kit: Validated for your sample matrix (e.g., salivary or serum E2 and P4).
- Ovulation Test Kits: Urinary LH test strips.
- Basal Body Temperature (BBT) Thermometer: Digital, high-precision.
- Sample Collection Supplies: As required by your chosen assay (e.g., Salivettes, serum tubes).
Procedure:
- Initiation and Baseline: Participant reports first day of menstrual bleeding (Cycle Day 1). Schedule a baseline visit within Days 2-4 for early follicular phase confirmation.
- Follicular Phase Monitoring: Beginning on approximately Cycle Day 8, the participant begins daily tracking:
- Urinary LH: Test once daily. A positive LH surge is designated as Day 0.
- BBT: Measure immediately upon waking, before any activity.
- Peri-Ovulatory Confirmation: Schedule a visit within 1-2 days of the detected LH surge.
- Luteal Phase Confirmation: Schedule a visit approximately 7 days after the LH surge (or 5-8 days post-ovulation based on BBT shift) for mid-luteal phase confirmation.
- Sample Analysis: Assay all collected samples for E2 and P4 in a single batch to minimize inter-assay variability.
Validation Criteria:
- Early Follicular Phase: Low E2 and P4 consistent with Table 1.
- Ovulation: Detection of urinary LH surge, followed by a sustained BBT shift.
- Mid-Luteal Phase: P4 levels must exceed a validated threshold, ideally > 5 ng/mL in serum or its equivalent in saliva, confirming ovulation has occurred [63].
Diagram 1: Workflow for hormonally confirmed phase determination, integrating multiple tracking methods for highest accuracy.
Protocol 2: Single-Phase Verification for Cross-Sectional Studies
This protocol is designed for studies that test participants during a single, target phase.
Objective: To verify that a participant was in the intended menstrual cycle phase (e.g., early follicular or mid-luteal) at the time of a single testing session.
Materials:
- Hormone Assay Kit: For P4 (and E2, if verifying luteal phase).
- Sample Collection Supplies.
Procedure:
- Participant Screening: Recruit participants who report regular cycles.
- Scheduling: Schedule the testing session based on the participant's self-report:
- Early Follicular: Days 2-6 after the start of menses.
- Mid-Luteal: Approximately 7 days after reported ovulation (or ~Days 19-23 of a 28-day cycle).
- Sample Collection: Collect a hormone sample (saliva or blood) at the beginning of the testing session.
- Hormone Analysis: Assay the sample for P4 (critical). Assaying E2 can provide additional confirmation for the luteal phase.
Validation Criteria:
- Early Follicular Phase Confirmation: P4 level must be below a validated threshold. This threshold must be established locally but is often < 1-2 ng/mL for serum.
- Mid-Luteal Phase Confirmation: P4 level must be above a validated threshold. A common minimum threshold for confirming ovulation in serum is > 5 ng/mL [63]. Participants with P4 below this threshold should be excluded or their data analyzed with caution.
The Scientist's Toolkit: Essential Research Reagents and Materials
The following table details key materials required for implementing the described protocols.
Table 3: Research Reagent Solutions for Menstrual Cycle Hormone Analysis
| Item | Function/Application | Key Considerations |
|---|---|---|
| LC-MS/MS Assay | Gold-standard for steroid hormone quantification (E2, P4). | High specificity, low cross-reactivity. Allows multiplexing. Requires significant expertise and investment [24]. |
| High-Specificity Immunoassay Kits | Quantify E2, P4, LH in serum, saliva, or urine. | Must be rigorously validated for the specific sample matrix and study population. Susceptible to cross-reactivity [24] [64]. |
| Urinary LH Test Strips | Detect the luteinizing hormone surge to pinpoint ovulation. | For home use by participants. Critical for scheduling peri-ovulatory and post-ovulatory visits [34]. |
| Digital BBT Thermometer | Tracks the biphasic shift in resting body temperature caused by progesterone post-ovulation. | Provides retrospective confirmation of ovulation. High precision is required (to 0.01°F/0.005°C) [16]. |
| Standardized Sample Collection Kits | Ensure consistent, uncontaminated sample collection (e.g., Salivettes, serum separator tubes). | Protocol must prohibit collection after eating, drinking, or brushing teeth (for saliva) to avoid matrix interference [24]. |
Accurately defining and confirming hormone thresholds for menstrual cycle phases is not a matter of applying universal values, but a process that requires careful study design, rigorous assay validation, and an appreciation for individual and methodological variability. By adopting the protocols and criteria outlined in this application note—moving beyond simple count-back methods, establishing local assay-specific thresholds, and using a multi-method verification approach—researchers can significantly reduce phase misclassification. This enhanced methodological rigor is essential for producing reliable, reproducible data on the complex interplay between ovarian hormones and biobehavioral outcomes, ultimately strengthening the foundation of women's health research and drug development.
Conclusion
Accurate determination of menstrual cycle phase is not a matter of convenience but a fundamental requirement for scientific rigor in female-focused research. Moving beyond assumptions and estimations to direct hormonal measurement is paramount. This synthesis underscores that while serum assays remain the clinical gold standard, validated salivary and urinary methods offer feasible alternatives for field-based and longitudinal studies. The integration of multi-modal data, including hormone assays and emerging metrics from wearable technology analyzed by machine learning, represents the future of personalized, dynamic cycle tracking. For the fields of drug development and clinical research, adopting these rigorous, transparent methodologies is essential to generate valid, reliable data that truly advances our understanding of women's health across the lifespan.
References
- 1. How to study the menstrual cycle - PubMed Central - NIH [https://pmc.ncbi.nlm.nih.gov/articles/PMC8363181/]
- 2. The Normal Menstrual Cycle and the Control of Ovulation - NCBI [https://www.ncbi.nlm.nih.gov/books/NBK279054/]
- 3. Menstrual Cycle (Normal Menstruation): Overview & Phases [https://my.clevelandclinic.org/health/articles/10132-menstrual-cycle]
- 4. Understanding the Phases of the Menstrual Cycle [https://helloclue.com/articles/cycle-a-z/the-menstrual-cycle-more-than-just-the-period]
- 5. Using Hormone Data and Age to Pinpoint Cycle Day within ... [https://www.mdpi.com/1648-9144/59/7/1348]
- 6. Establishing a Gold Standard for Quantitative Menstrual ... [https://pmc.ncbi.nlm.nih.gov/articles/PMC10533176/]
- 7. Estrogen: Hormone, Function, Levels & Imbalances [https://my.clevelandclinic.org/health/body/22353-estrogen]
- 8. Determining Menstrual Cycle Phase - PubMed Central - NIH [https://pmc.ncbi.nlm.nih.gov/articles/PMC10714354/]
- 9. Understanding Estrogen Levels During Your Menstrual Cycle [https://helloclue.com/articles/cycle-a-z/estrogen-101]
- 10. Progesterone: Natural Function, Levels & Side Effects [https://my.clevelandclinic.org/health/body/24562-progesterone]
- 11. Progesterone 101: Progesterone Levels During Your Cycle [https://helloclue.com/articles/cycle-a-z/progesterone-101]
- 12. Physiology, Progesterone - StatPearls - NCBI Bookshelf - NIH [https://www.ncbi.nlm.nih.gov/books/NBK558960/]
- 13. Luteinizing Hormone: Levels, Function & Testing [https://my.clevelandclinic.org/health/body/22255-luteinizing-hormone]
- 14. Luteinizing hormone (LH): Functions, Levels, Ovulation [https://ada.com/hormones/luteinizing-hormone/]
- 15. Complexities in salivary and urinary methodology for ... [https://gremjournal.com/journal/01-2025/complexities-in-salivary-and-urinary-methodology-for-ovulation-and-menstrual-cycle-hormone-detection-a-scoping-review/]
- 16. Real-world menstrual cycle characteristics of more than ... [https://www.nature.com/articles/s41746-019-0152-7]
- 17. Characterizing physiological and symptomatic variation in ... [https://www.nature.com/articles/s41746-020-0269-8]
- 18. Machine learning-based menstrual phase identification ... [https://www.nature.com/articles/s44294-025-00078-8]
- 19. Does anovulation exist in eumenorrheic women? [https://www.sciencedirect.com/science/article/abs/pii/S0029784403005271]
- 20. Assessment of Anovulation in Eumenorrheic Women: Comparison of Ovulation Detection Algorithms - PMC [https://pmc.ncbi.nlm.nih.gov/articles/PMC4119548/]
- 21. Study on the correlation between energy availability and ... [https://pmc.ncbi.nlm.nih.gov/articles/PMC11637835/]
- 22. Machine learning model for menstrual cycle phase ... [https://www.sciencedirect.com/science/article/pii/S0010482525000551]
- 23. Extensive monitoring of the natural menstrual cycle using ... [https://pmc.ncbi.nlm.nih.gov/articles/PMC8042396/]
- 24. Improving Science by Overcoming Laboratory Pitfalls With ... [https://pmc.ncbi.nlm.nih.gov/articles/PMC7993596/]
- 25. Comparison of assay methods for quantifying sex hormone ... [https://pmc.ncbi.nlm.nih.gov/articles/PMC11327312/]
- 26. Saliva-Based Hormone Testing [https://articles.medixbiochemica.com/saliva-hormone-testing-a-non-invasive-revolution-in-endocrine-diagnostics]
- 27. saliva vs. blood diagnostics for hormone testing - The Blog [https://www.tecan.com/blog/saliva-hormone-testing-versus-blood-diagnostics]
- 28. Association between salivary and blood hormone ... [https://pubmed.ncbi.nlm.nih.gov/40321070/]
- 29. Salivary/Serum Progesterone Ratio Differs Between Menstrual ... [https://pmc.ncbi.nlm.nih.gov/articles/PMC12239057/]
- 30. Salivary hormonal analysis as a tool for skeletal maturity ... [https://www.nature.com/articles/s41598-025-18182-9]
- 31. Advances in biomonitoring technologies for women's health [https://www.nature.com/articles/s41467-025-63501-3]
- 32. Detection of ovulation, a review of currently available ... [https://pmc.ncbi.nlm.nih.gov/articles/PMC5689497/]
- 33. Comparison between the different methods developed for ... [https://link.springer.com/article/10.1007/s00404-015-3732-z]
- 34. Determining Menstrual Phase in Human Biobehavioral ... [https://pmc.ncbi.nlm.nih.gov/articles/PMC4821777/]
- 35. Top Mistakes to Avoid When Using Ovulation Test Kits [https://www.jalmedical.com/top-mistakes-to-avoid-when-using-ovulation-test-kits/]
- 36. Ovulation Tracking: 5 common mistakes [https://www.myovry.ca/blogs/health-science/ovulation-tracking-5-common-mistakes?srsltid=AfmBOoqg_7-QEAtvM0LjbhbIpyLkhVEOP_3X1AF1tbWt1vq2JWXWJMOn]
- 37. 6 Reasons Why Your Ovulation Test Shows False Positive [https://blog.inito.com/false-positive-on-an-ovulation-test/]
- 38. Validation of urinary reproductive hormone measurements ... [https://www.nature.com/articles/s41598-023-36539-w]
- 39. Current ovulation and luteal phase tracking methods ... [https://pmc.ncbi.nlm.nih.gov/articles/PMC11837971/]
- 40. Why We Must Stop Assuming and Estimating Menstrual ... [https://pmc.ncbi.nlm.nih.gov/articles/PMC12152053/]
- 41. A comparison of methods to predict ovulation day ... [https://pubmed.ncbi.nlm.nih.gov/40668218/]
- 42. Establishing a Gold Standard for Quantitative Menstrual ... [https://www.mdpi.com/1648-9144/59/9/1513]
- 43. Evaluating the added value of salivary hormones in ... [https://www.sciencedirect.com/science/article/pii/S0306453025002185]
- 44. Hormonal balance, anovulatory cycles and luteal phase ... [https://pubmed.ncbi.nlm.nih.gov/40232947/]
- 45. Diagnosis and treatment of luteal phase deficiency: a ... [https://www.asrm.org/practice-guidance/practice-committee-documents/diagnosis-and-treatment-of-luteal-phase-deciency-a-committee-opinion-2021/]
- 46. Menstrual Cycle Mapping [https://www.zrtlab.com/test-specialties/menstrual-cycle-mapping/]
- 47. Female Hormonal Assays [https://www.reproductive.org/female-hormonal-assays]
- 48. Comparison of two ovulation tests to predict timing of the ... [https://pmc.ncbi.nlm.nih.gov/articles/PMC12012743/]
- 49. Comparison of two ovulation tests to predict timing of the ... [https://pubmed.ncbi.nlm.nih.gov/40260795/]
- 50. The 5 best ovulation tests for help determining peak fertility [https://www.ccrmivf.com/news/5-best-ovulation-tests-for-help-determining-peak-fertility-march-16-2021/]
- 51. Prediction of ovulation: new insight into an old challenge [https://www.nature.com/articles/s41598-023-47241-2]
- 52. What Does a Faint Line on an Ovulation Test Mean? [https://blog.inito.com/faint-line-on-an-ovulation-test/]
- 53. %CV in ELISA: How to Reduce Them and Why They're ... [https://www.enzo.com/note/cv-in-elisa-how-to-reduce-them-and-why-theyre-important/]
- 54. Deep diving into menstrual cycle data to enhance women's ... [https://www.nature.com/articles/d43747-024-00025-7]
- 55. Calculating Inter- and Intra-Assay Coefficients of Variability [https://salimetrics.com/calculating-inter-and-intra-assay-coefficients-of-variability/]
- 56. Why We Must Stop Assuming and Estimating Menstrual ... [https://link.springer.com/article/10.1007/s40279-025-02189-3]
- 57. Quantifying the variability in the assessment of ... [https://www.sciencedirect.com/science/article/pii/S0015028223019994]
- 58. Evaluation of Salivary Diagnostics: Applications, Benefits ... [https://pmc.ncbi.nlm.nih.gov/articles/PMC11830415]
- 59. Comparing Saliva, Urine, and Serum Hormone Testing [https://www.drkarafitzgerald.com/2021/07/12/comparing-saliva-urine-and-serum-hormone-testing-choosing-the-best-test-for-each-patient/]
- 60. Menstrual Cycle Phase Influences Cognitive Performance ... [https://www.mdpi.com/2079-7737/14/8/1060]
- 61. -based Machine using... learning menstrual phase identification [https://www.nature.com/articles/s44294-025-00078-8?error=cookies_not_supported&code=96b5f110-4a70-4026-b39d-adb86c24b07b]
- 62. model for Machine classification and... learning menstrual cycle phase [https://pubmed.ncbi.nlm.nih.gov/39889448/]
- 63. How to study the menstrual cycle: Practical tools and ... [https://www.sciencedirect.com/science/article/abs/pii/S0306453020303188]
- 64. The validation of a commercial enzyme-linked ... [https://pmc.ncbi.nlm.nih.gov/articles/PMC7047911/]